

Sponsored by Battle Quest Comics
By Brian Hibbs
“There are three kinds of lies: Lies, Damned Lies, and Statistics”
Ludicrously, this is the twentieth annual report of something that is hard to exactly perceive and understand: the size and shape of the sales of graphic novels and trade paperbacks through the book store market, as seen through the prism of NPD BookScan.
There is a tremendous amount that goes into making these reports, and a whole lot of detail of how these lists get generated, but my wise editor believes that most folks just want to get to the numbers. So, if you are interested in how the sausage gets made, please go down to the bottom of the column for lots of in-depth details.
I will summarize a few things top level concepts up-front however: all sales reported here are generated by The NPD Group, which runs NPD BookScan. These reflect actual sales made through bookstores that report to NPD, which includes Amazon. NPD believes that some 85% or more of book sales are captured by them – so even best-case scenario, these are a little light. They also include a few comic book specialty stores via those stores that use the “ComicsHUB” point-of-sale system, though it is extremely unclear just how much of comic store sales they are capturing. HUB is absolutely no better than the #2 POS system, and they could be significantly smaller as reporting says “over 100” stores use ComicsHUB – last industry wide data suggests there are over three thousand comics stores. (More comprehensive records of Direct Market purchases in 2022 can be found in the excellent reports by John Jackson Miller’s Comichron)
But this BookScan report obviously only includes books sold through the venues that report to NPD BookScan – it certainly doesn’t include sources of sales like, for example, school library purchases, or direct-to-consumer sales through things like the Scholastic book fairs. In some cases, those numbers could potentially be many multiples of the retail trade. I certainly expect that something as broadly popular as “Cat Kid” (the #1 book in 2022’s BookScan report) is selling at least twice as many copies (and maybe much much more!) through academic channels. However, this is very much beyond the scope of this survey.
This also only includes physical books sold! No digital of any kind. (Broadly, digital is an insignificant channel, comprising single digit percentages of printed books)
Also for a top-level note: I am myself a Direct Market (comic book store) retailer – while my individual focus is on book-format material, I have a lot biases, both visible and invisible that I bring to these reports. Please bear these in mind as you read my analysis! Question authority!!!
I have historically divided the data between the “Top 750” because a) that’s all the data I was initially leaked back in 2003, b) it’s a “manageable” chunk of data, and c) “as above, so below” – the top 750 represents about half or more of sales. However, since 2007, I’ve received the “entire” database, which now gives us a solid sixteen years of data to track. I refer to this as “the Long Tail”. This year’s “Long Tail” has more than 50k items! That’s a lot! And a whole lot of those books are selling copies that don’t even add up to one hundred copies sold in a year.
I also do a rough calculation of if you multiply the number of copies sold (a firm number) against the cover price, what you the calculated retail dollar sales be. This is not actually a real number, because a significant percentage of these books sold for less than cover price (thanks Amazon!)
[Editor’s note: as is our custom, we’ve provided a chart of the Top 750 comics, with sales figures removed. This is the raw Top 750 Bookscan chart with non comics titles – such as Wimpy Kids books – removed by the author. Without this correction the #1 book would be Diary of a Wimpy Kid: Diper Överlöde.]
The first thing that I have to do once I receive the report from NPD BookScan is to edit the data I am sent, removing all of the things that are not comics. I literally hand-checked thousands of items every YEAR against Amazon’s “Look Inside” feature” to say “is this a comic or not?” I defined “comics” like this: either a) it has multiple panels sequentially producing a narrative (those don’t have to be on ONE PAGE, so someone like Mo Williams is certainly comics) OR b) a single image that, taken solely by itself, provides a complete thought. So, “The Far Side” is comics, but, no, “Diary of a Wimpy Kid” is NOT (but very glad to see that number as a comparative)
Using these working definitions, starting in 2018 I decided to cut some items that had previously been included: chief among best-sellers would be Rachel Renee Russell’s “Dork Diaries” – they have words, they have pictures, but they don’t work together in the way I’d think we’d commonly agree is “comics”. I also removed prose-driven books like DK Publishing’s “Marvel Encyclopedia”, which, while nominally about comics or comics culture, is factually an encyclopedic prose book with pictures. Or “Wonder Woman: Warbringer” which is a straight-up prose novel that happens to feature a comics character, or “DC Super Heroes: My First Book of Girl Power” where the Amazon “Look Inside” clearly shows is an illustrated reader for 2nd graders, or even “The Bloody Crown of Conan”, which is a prose book that features a character that originally was created in prose, and that I have had to delete from my reports for literally every of the twenty years I have done this.. There is clearly an enormous market for these kinds of material – in fact, in many cases a larger market than for the actual comics themselves – it just isn’t the “comics” market, as I would define it.
And since I am the one writing this analysis, I get to make the definitions.
The Big Picture
Here’s the big picture for just the Top 750 in 2022:
| Year | Total Unit | Growth | Calculated Retail Value | Growth |
| 2003 | 5,495,584 | ——- | $66,729,053 | ——– |
| 2004 | 6,071,123 | 10.5% | $67,783,487 | 1.6% |
| 2005 | 7,007,345 | 15.4% | $75,459,669 | 11.3% |
| 2006 | 8,395,195 | 19.8% | $90,411,902 | 19.8% |
| 2007 | 8,584,317 | 2.3% | $95,174,425 | 5.3% |
| 2008 | 8,334,276 | -2.9% | $101,361,173 | 6.5% |
| 2009 | 7,634,453 | -8.4% | $93,216,014 | -8.0% |
| 2010 | 6,414,336 | -15.9% | $85,266,166 | -8.5% |
| 2011 | 5,696,163 | -11.2% | $79,961,951 | -6.2% |
| 2012 | 5,438,329 | -4.53% | $89,918,354 | 12.45% |
| 2013 | 5,654,351 | 3.97% | $96,062,709 | 6.83% |
| 2014 | 6,659,031 | 17.77% | $112,768,709 | 17.39% |
| 2015* | 8,762,983 | 31.60% | $141,226,518 | 25.24% |
| 2016* | 9,967,907 | 13.75% | $159,510,075 | 12.95% |
| 2017 | 10,310,682 | 3.44% | $154,026,517 | -3.44% |
| 2018 | 11,755,903 | 14.02% | $165,885,527 | 7.70% |
| 2019 | 15,537,520 | 32.17% | $226,370,566 | 36.46% |
| 2020 | 18,245,279 | 17.43% | $274,308,460 | 21.18% |
| 2021 | 30,698,081 | 68.25% | $443,735,058 | 61.76% |
| 2022 | 31,010,409 | 1.02% | $471,444,963 | 6.25% |
2022 brought the single highest set of totals we’ve seen in the history of tracking BookScan, but the overall growth dropped to nearly flat. Still, anything that beat, even by an inch, the record setting numbers of the pandemic-related boom in 2021 is a thing to be praised. Sales are up just over 1% for the Top 750 in quantity sold, and the Hibbs-created Calculated Retail Value, which is almost certainly wrong because many books are sold at a discount, is up six-and-a-quarter percent
(I want to remind you that while I asterisk 2015-2016 in terms of the sheer number of data points that I was getting was probably edited, it appears to be that the top 750 itself was fairly rock solid – there is more on this down below in the sausage making section)
The trend for print books in general (not just looking at comics) through bookstores in 2022, according to the NPD group and NPD BookScan appears to show a general drop of 6.5%, which does nothing but continue the now nine-year trend of comics-material being significantly stronger than the general curve!
As I discuss in the boilerplate below, I primarily write about the top 750 because a) that’s all the data I was initially leaked back in 2003, b) it’s a “manageable” chunk of data, and c) “as above, so below” – the top 750 represents about half of sales. However, since 2007, I’ve received the “entire” database, which now gives us a solid fifteen years of data to track, that’s“the Long Tail”.
Here’s what the sales of all comics sales NPD BookScan tracks in this category looks like – but, seriously, let me remind you that the dataset changes enough each year this can be an awkward set of comparisons! Even putting aside “the asterisk years”, prior to 2013 this didn’t include Walmart, for just one example (of scores!) of the lack of direct comparison.
| Year | # of listed items | Percent Change | Total Unit Sold | Percent Change | Calculated Retail Value | Percent Change | Av. Sale per title | Av $ per title |
| 2007 | 13,181 | —– | 15,386,549 | —– | $183,066,142 | —– | 1167 | $13,889 |
| 2008 | 17,571 | 24.98% | 15,541,769 | 1.00% | $199,033,741 | 8.02% | 885 | $11,327 |
| 2009 | 19,692 | 12.07% | 14,095,145 | -9.31% | $189,033,736 | -5.02% | 716 | $9,560 |
| 2010 | 21,993 | 11.68% | 12,130,232 | -13.94% | $172,435,244 | -8.78% | 552 | $7,840 |
| 2011 | 23,945 | 8.88% | 11,692,058 | -3.61% | $175,634,490 | 1.86% | 488 | $7,335 |
| 2012 | 23,365 | -2.42% | 9,562,236 | -18.22% | $164,415,366 | -6.39% | 409 | $7,037 |
| 2013 | 24,492 | 4.82% | 10,153,628 | 6.18% | $176,419,370 | 7.30% | 415 | $7,326 |
| 2014 | 26,976 | 10.14% | 11,820,324 | 16.41% | $207,598,355 | 17.67% | 438 | $7,696 |
| 2015* | 22,431 | -16.85% | 15,269,550 | 29.18% | $259,807,532 | 25.15% | 681 | $11,583 |
| 2016* | 21,295 | -5.06% | 17,302,891 | 13.32% | $293,583,180 | 13.00% | 813 | $13,786 |
| 2017 | 35,338 | 65.95% | 18,385,086 | 6.25% | $302,300,435 | 2.97% | 520 | $8,555 |
| 2018 | 38,424 | 8.73% | 19,965,469 | 8.60% | $318,345,707 | 5.31% | 520 | $8,855 |
| 2019 | 40,745 | 6.06% | 24,694,686 | 23.69% | $399,322,754 | 25.44% | 606 | $9,801 |
| 2020 | 44,316 | 8.76% | 29,251,619 | 18.45% | $480,408,257 | 20.31% | 660 | $10,841 |
| 2021 | 47,630 | 7.48% | 51,822,538 | 77.16% | $826,280,847 | 72.00% | 1088 | $17,348 |
| 2022 | 50,056 | 5.09% | 52,614,342 | 1.53% | $863,574,176 | 4.51% | 1051 | $17,252 |
Overall, this is our Topline conclusion for the whole NPD BookScan 2022: Up more than 5% in total number books listed, essentially flat with 1.5% growth of Units Sold, and up 4.5% in the calculated retail value if all books sold for cover price (they didn’t, not in the “bookstore” market) – as you read through individual publisher listings, you can compare their “long tail” performance this year against those benchmarks to see if they overperformed or underperformed the market.

But, as amazing as those topline numbers look, please remember that it really is largely “hits” that are driving the business – the “average” book still only sold approximately 1,051 copies, nationwide, in the entire year. Almost no one can earn a living from that (including book sellers!)
Let’s take a look at the Top 20 best-selling items on the 2022 chart, including actual sales, which we’re allowed to run. It looks like this:
| Position | Unit sales | Title | Author |
| #1 | 623,348 | CAT KID COMIC CLUB v3 : ON PURPOSE | PILKEY, DAV |
| #2 | 400,367 | CAT KID COMIC CLUB v2: PERSPECTIVES | PILKEY, DAV |
| #3 | 325,719 | CAT KID COMIC CLUB v4 : COLLABORATIONS | PILKEY, DAV |
| #4 | 285,335 | DOG MAN v10: MOTHERING HEIGHTS | PILKEY, DAV |
| #5 | 283,452 | FIVE NIGHTS AT FREDDY’S v3: THE FOURTH CLOSET | CAWTHON, SCOTT |
| #6 | 276,761 | CHAINSAW MAN, VOL. 1 | FUJIMOTO, TATSUKI |
| #7 | 271,376 | SPY X FAMILY, VOL. 1 | ENDO, TATSUYA |
| #8 | 264,824 | DEMON SLAYER: KIMETSU NO YAIBA, VOL. 1 | GOTOUGE, KOYOHARU |
| #9 | 255,269 | THE BABY-SITTERS CLUB v11: GOOD-BYE STACEY, GOOD-BYE | EPSTEIN, GABRIELA |
| #10 | 252,762 | DOG MAN v9: GRIME AND PUNISHMENT | PILKEY, DAV |
| #11 | 247,520 | WINGS OF FIRE v5: THE BRIGHTEST NIGHT | SUTHERLAND, TUI T. |
| #12 | 239,088 | CAT KID COMIC CLUB v1 | PILKEY, DAV |
| #13 | 227,641 | DOG MAN v7: FOR WHOM THE BALL ROLLS | PILKEY, DAV |
| #14 | 223,736 | CHAINSAW MAN, VOL. 2 | FUJIMOTO, TATSUKI |
| #15 | 214,662 | DEMON SLAYER: KIMETSU NO YAIBA–STORIES OF WATER AND FLAME | HIRANO, RYOJI |
| #16 | 211,865 | FIVE NIGHTS AT FREDDY’S v2: THE TWISTED ONES | CAWTHON, SCOTT |
| #17 | 207,081 | FIVE NIGHTS AT FREDDY’S v1: THE SILVER EYES | CAWTHON, SCOTT |
| #18 | 187,523 | DOG MAN v8: FETCH-22 | PILKEY, DAV |
| #19 | 186,627 | HEARTSTOPPER v2 | OSEMAN, ALICE |
| #20 | 181,895 | DOG MAN v1 | PILKEY, DAV |
Depending on your exact definitions of intended audiences, it appears that fifteen of the Top Twenty is intended for children or middle readers. The other five of the Top Twenty are Manga, and if you are looking for a “Marvel / DC-style superhero” comic, you are not even in the top two hundred-and-fifty! In fact, the first DC superhero comic to appear is at #257 with Batman: Year One. Jinkies! As for Marvel? Their very first appearance isn’t until all the way down at #483 with Moon Knight by Lemire & Smallwood. Ultimately this means that a comic that started as an homage/parody of Frank Miller’s writing (Teenage Mutant Ninja Turtles) skunked their master (The Last Ronin came in at #115), and that Scholastic’s license of Marvel trounced anything that Marvel published natively (Miles Morales: Shock Waves came in at #204) (We’ll talk more about this below)
Not a single book in the Top Twenty sells less than 182k copies! (it was 150k in 2021, and not even 100k as recently as 2019), and the combined circulation of the Top Twenty is over 5.3 million copies – that is: just over 10% of the unit sales of all 50k different graphic novels sold by BookScan reporters in 2022 (52m copies) was being generated by just twenty books. We appear to have become a “blockbusters”-driven business.
American comics aimed at adults are a small minority at the top of the charts – of the top 100, fifty-three are manga, forty-one are kids books, and a mere six are American comics aimed at adults: three versions of Maus and three volumes of Lore Olympus. For the second year in a row, manga sells the greatest number of copies overall: of the 52 million graphic novels sold via BookScan in 2022, 29m are manga (roughly 56%)
Dav Pilkey and his various series of books (Cat Kid and Dog Man) remain the current Rulers of comic sales in the bookstores – he is the Top four best-sellers, inclusive, and nine of the Top Twenty. What’s critical to remember about this is that Scholastic is also presumably selling a metric shedload of these books through the Scholastic Book Fairs, to elementary and middle school libraries, and any number of other places that don’t report to NPD BookScan. This here continues to be just the tip of the iceberg.
Pilkey’s hold on the charts is very strong, if declining a bit: The #1 best-seller (Cat Kid v3: On Purpose) sold 623k copies via BookScan in 2022, a bit under half of the 1.3 million copies the same placement (Dog Man v10: Mothering Heights) sold in 2021.
At #2, Pilkey places Cat Kid v2: Perspectives with a bit over 400k, at #3 is Cat Kid v4: Collaborations (326k), while #4 is the first placement of Dog Man (the aforementioned v10, Mothering Heights) with 285k sold. Then others interrupt his streak and Pilkey’s next placement is #10 with “Dog Man v9” (253k), #12’s “Cat Kid v1” (239k), #13 with “Dog Man v7” (228k), #18 with “Dog Man v8” (188k), and #20 with “Dog Man v1” (182k)
Pilkey’s success isn’t just a trend or a fluke – it is very deep and long lasting. There are sixty-five Pilkey comics that place on the chart in 2022 (this includes Spanish translations and boxed sets and so on), with nineteen of them in the Top 750. All combined, Pilkey sells 3.7m copies in 2022, which amounts to just over 7% of all comics sold via BookScan! That’s pretty massive!
But the Top Twenty is not only Dav Pilkey! What first breaks his hold on the market? Why, it is more material from the Graphix imprint from Scholastic! At #5 is v3 of Five Nights at Freddy’s (The Fourth Closet) with 283k sold, while #9 is v11 of Baby Sitter’s Club (Goodbye Stacey, Goodbye) with 255k sold. #11 is Wings of Fire v5 (The Brightest Night with 248k sold), while #16 & #17 go back to Five Nights at Freddy’s – v2 at 212k and v1 at 207k, respectively. And at #19 is the 2nd volume of Heartstopper (187k)
Altogether, Scholastic takes fifteen of the Top Twenty best-sellers in 2022, the same number as last year. Those fifteen books represent 4.1 million copies sold, or a bit over ten percent of the total of every single book of comics combined sold for the year – these fifteen books are 7.8% of the total sum of all comics sold to BookScan reporters this year. The best-seller drives the fortunes of publishing more than almost anything else.
Scholastic’s hold on the Top Twenty is not total, however, and Viz gets its piece: Book #6 is our first Manga, Tatsuki Fujimoto’s Chainsaw Man v1 (277k), while #7 is Tatsuya Endo’s Spy X Family (271k) and #8 is Koyoharu Gotouge’s Demon Slayer: Kimetsu No Yaiba v1 (267k). Viz sweeps up the last of the Top Twenty with v2 of Chainsaw Man at #14 (224k) and Stories of Water & Flame another Demon Slayer volume at #15 (215k)
No other publisher that Viz or Scholastic places a book in the Top Twenty, and it’s the first volume of Art Spiegelman’s “Maus” at #25 (177k) from Pantheon that first breaks that streak, as well as the first US-produced comic intended for adults.
“Hits!” is the word of 2022 as there are 68 comics that sold over 100k copies – that was 52 in 2021 and just 22 in 2020. Book #20 sold 182k in 2022, while in 2021 that same placement sold 129k: the floor has risen 41% for slot #20 in a year.
I will continue to underline the fact that not one of these books was created “for” the traditional Direct Market audience, and that the DM (as purchased through Diamond at least) likely does a mediocre job stocking or selling any of these books – although Diamond eliminated sales reports during the pandemic so there’s not actually any way to be certain of what the DM is selling, any longer. And, to be fair, many DM stores are buying these books from non-Diamond sources (because Diamond uniformly has the worst wholesale pricing for each and every book in the Top Twenty, on top of catastrophically usurious shipping charges)
How about if we sort things by author? There are 10,839 different names on the entire NPD BookScan list for 2022. Here are people who sold more than 100k copies combined via NPD BookScan reporters in 2022:
| 3,671,400 | PILKEY, DAV |
| 1,900,904 | FUJIMOTO, TATSUKI |
| 1,849,850 | GOTOUGE, KOYOHARU |
| 1,441,404 | AKUTAMI, GEGE |
| 1,114,995 | HORIKOSHI, KOHEI |
| 1,071,230 | ENDO, TATSUYA |
| 850,478 | TELGEMEIER, RAINA |
| 846,556 | SUTHERLAND, TUI T. |
| 814,487 | AIDAIRO |
| 799,667 | MIURA, KENTARO |
| 789,913 | CAWTHON, SCOTT |
| 767,924 | ISAYAMA, HAJIME |
| 558,371 | ITO, JUNJI |
| 543,361 | ODA, EIICHIRO |
| 522,292 | TORIYAMA, AKIRA |
| 502,589 | ODA, TOMOHITO |
| 413,179 | SMYTHE, RACHEL |
| 409,700 | OSEMAN, ALICE |
| 382,159 | ISHIDA, SUI |
| 371,641 | ONE |
| 365,618 | EPSTEIN, GABRIELA |
| 352,733 | GREEN, JOHN PATRICK |
| 347,714 | PEIRCE, LINCOLN |
| 345,958 | ARAKI, HIROHIKO |
| 345,008 | SPIEGELMAN, ART |
| 335,161 | FURUDATE, HARUICHI |
| 326,376 | FARINA, KATY |
| 324,471 | OHKUBO, ATSUSHI |
| 315,569 | OHBA, TSUGUMI |
| 312,973 | CHUGONG |
| 301,981 | SHIRAI, KAIU |
| 296,685 | FGTEEV |
| 283,943 | MATSUMOTO, NAOYA |
| 282,910 | CHAU, CHAN |
| 262,387 | GAIMAN, NEIL |
| 251,248 | TOGASHI, YOSHIHIRO |
| 248,181 | TARSHIS, LAUREN |
| 227,787 | KISHIMOTO, MASASHI |
| 223,163 | TABATA, YUKI |
| 220,018 | GALLIGAN, GALE |
| 218,480 | MILLER, KAYLA |
| 214,662 | HIRANO, RYOJI |
| 210,001 | TAKEUCHI, NAOKO |
| 199,195 | FUJITA |
| 190,585 | YANG, GENE LUEN |
| 189,036 | CLANTON, BEN |
| 180,107 | HIMEKAWA, AKIRA |
| 174,572 | ARAKAWA, HIROMU |
| 171,535 | SIMPSON, DANA |
| 169,791 | MASHIMA, HIRO |
| 169,474 | KIRKMAN, ROBERT |
| 166,787 | KIBUISHI, KAZU |
| 164,984 | KUSAKA, HIDENORI |
| 161,378 | LIBENSON, TERRI |
| 159,681 | FUKUDA, SHINICHI |
| 158,932 | BONASTRE TUR, MÃRIAM |
| 154,261 | OSBORNE, MARY POPE |
| 153,004 | HAYASHIDA, Q. |
| 152,791 | MATSUI, YUSEI |
| 152,135 | YAMAGUCHI, TSUBASA |
| 148,451 | ITAGAKI, PARU |
| 145,506 | CRAFT, JERRY |
| 145,179 | TAKAYA, NATSUKI |
| 143,421 | HALE, SHANNON |
| 139,492 | ASANO, INIO |
| 137,325 | KUBO, TITE |
| 134,578 | FLYNN, IAN |
| 133,295 | YAZAWA, AI |
| 133,256 | KAKU, YUJI |
| 133,088 | ASAGIRI, KAFKA |
| 132,944 | YUKIMURA, MAKOTO |
| 132,561 | HALE, NATHAN |
| 128,186 | WATTERSON, BILL |
| 124,919 | CARIELLO, SERGIO |
| 118,380 | KASAMA, SANSHIRO |
| 118,329 | OSHIMI, SHUZO |
| 112,114 | KANESHIRO, MUNEYUKI |
| 111,907 | INOUE, TAKEHIKO |
| 111,583 | SNYDER, SCOTT |
| 109,763 | URASAWA, NAOKI |
| 107,657 | KIZU, NATSUKI |
| 107,275 | AKASAKA, AKA |
| 103,819 | MOORE, ALAN |
| 103,379 | JAMIESON, VICTORIA |
| 102,853 | INAGAKI, RIICHIRO |
| 102,297 | NANASHI |
| 102,202 | HUNTER, ERIN |
| 101,033 | MIYAJIMA, REIJI |
| 100,753 | SUZUKI, NAKABA |
These 89 people represent 62% of all sales of NPD BookScan-reported sales in 2022. What you can take from this is that only a tiny number of creators drive the vast majority of the business in comics (and books in general, as far as I can tell); and conversely, this probably means that the numerical majority of comics published aren’t actually significantly profitable any given year. I think it’s further worth noting that historically US comics aimed at adults are created by paying a page rate, so that the very creation of comics could allow a living wage for their creators.
Conversely, a great many of the graphic novel creators on this list are either being paid an advance-on-royalties, or in a few cases initially worked for free for the “streaming services”; or in the case of many of the Manga-ka, the creative costs have already long ago been paid from the original publication in Japan. When you add together those points, along with the “average” sale of a book in the Bookscan-reported market being just around 1000 copies, it would seem very safe to infer that most people making comics today aren’t even making US minimum wage to do so, while just a small minority of people hit the royalty targets to properly “earn out” a living.
There is potentially a lot of money in comics on the higher end, but most creative people aren’t actually seeing much of a financial reward, because the creation of comics is extremely labor intensive.
Let’s now switch our attention to looking at how publishers performed.
As a way to make the publisher breakdowns more readable, I split the chart into “eastern” (Manga) and “western” comics, because I think there are a few clear market distinctions between those categories. So, without further ado:
2022 Manga
Overall sales are up again for the Manga category in 2022 – sales are up by nearly a million pieces within the Top 750 (6%), and rose to 13% in calculated dollars. For the second year running, Manga is the majority of sales in the US marketplace.
Here’s a year-to-year comparison chart for the Top 750:
| Year | # of placing titles | Unit sales | Calculated Retail Value |
| 2003 | 447 | 3,361,966 | $34,368,409 |
| 2004 | 518 | 4,603,558 | $45,069,684 |
| 2005 | 594 | 5,691,425 | $53,922,514 |
| 2006 | 575 | 6,705,624 | $61,097,050 |
| 2007 | 575 | 6,837,355 | $61,927,238 |
| 2008 | 514 | 5,624,101 | $53,033,579 |
| 2009 | 451 | 4,414,705 | $41,068,604 |
| 2010 | 436 | 3,117,019 | $30,212,561 |
| 2011 | 392 | 2,627,570 | $27,017,081 |
| 2012 | 367 | 1,908,186 | $21,324,368 |
| 2013 | 315 | 1,665,487 | $21,256,777 |
| 2014 | 271 | 1,748,185 | $22,601,720 |
| 2015* | 279 | 2,033,534 | $26,191,474 |
| 2016* | 311 | 2,629,366 | $35,915,488 |
| 2017 | 284 | 2,427,380 | $35,433,489 |
| 2018 | 299 | 2,641,158 | $35,955,537 |
| 2019 | 332 | 3,539,031 | $49,900,429 |
| 2020 | 358 | 5,419,328 | $77,703,520 |
| 2021 | 495 | 15,945,960 | $218,310,280 |
| 2022 | 458 | 16,905,898 | $246,052,418 |
Sales and calculated dollars are up for the category in 2022, while the number of placing books is down a bit. And, once again this is the best year for Manga since we’ve been tracking! Be clear, however, that calculated dollars is a pretty fictional measurement because no one anywhere knows how much any individual book is actually selling for. For at least part of 2022, manga was also hampered by the “North American Manga Shortage” that began as a result of COVID lockdowns, as well as massive paper shortages – although these factors appear to have been largely fixed by the end of the year.
Once again, despite the record setting unit sales it is still not the greatest number of titles placing – that was the 594 books back in 2005.
As is typical with Manga, this is driven by the near-exclusive domination of series in the manga world – when there’s not a strong anime driving sales, manga tankobon series start to perform more like periodicals than books (albeit over a wider horizon); rather than generally building a strong core backlist that sells forever, year-in-and-year out, manga tends instead to ebb and flow with culture and fashion (and especially what anime is airing currently!) – manga sales are broadly not about specific graphic novels selling, they’re all about the series.
While there are 458 individual volumes of manga placing in the Top 750 this year, those only represent 127 distinct properties. For example, the best-selling Manga this year is Chainsaw Man – there are eleven different volumes of this series that place in the Top 750. The number two series, Spy X Family, has all eight volumes chart. Number three is Demon Slayer: Kimetso No Yaiba, which has 25 entries, number four is Jujutsu Kaiden with 19 books, while number five is My Hero Academia with 29 entries. Just these five series are more than 20% of the number of volumes placing in the Top 750 – those five series are nineteen of the Top Twenty, with only Berserk left to crack that group
Manga, as a category, has a “long tail”, where we’re looking at all sales for the year, and not just within the Top 750 best-sellers:
| Year | # of listed items | Percent Change | Total Unit Sold | Percent Change | Calculated Retail Value | Percent Change | Av. Sale per title | Av $ per title |
| 2007 | 6231 | —— | 11,323,487 | —— | $108,770,537 | —– | 1817 | $17,456 |
| 2008 | 7842 | 20.54% | 10,173,091 | -11.31% | $100,800,283 | -7.91% | 1297 | $12,854 |
| 2009 | 8756 | 11.66% | 8,148,490 | -19.90% | $81,770,442 | -18.78% | 931 | $9,339 |
| 2010 | 8764 | —— | 6,239,725 | -23.42% | $67,092,668 | -17.95% | 712 | $7,655 |
| 2011 | 8991 | 2.59% | 5,690,327 | -8.80% | $62,810,728 | -6.38% | 633 | $6,986 |
| 2012 | 6332 | -29.57% | 3,510,057 | -38.32% | $40,943,613 | -34.81% | 554 | $6,466 |
| 2013 | 7024 | 10.93% | 3,516,208 | 0.01% | $44,651,823 | 9.06% | 501 | $6,357 |
| 2014 | 7452 | 6.09% | 3,914,385 | 11.32% | $51,557,925 | 15.47% | 525 | $6,919 |
| 2015* | 4412 | –40.79% | 4,580,434 | 17.02% | $62,253,624 | 20.75% | 1038 | $14,110 |
| 2016* | 4968 | 12.60% | 5,821,892 | 27.10% | $81,314,479 | 30.62% | 1172 | $16,368 |
| 2017 | 10,248 | 106.8% | 5,865,412 | 0.75% | $85,581,224 | 5.25% | 572 | $8,351 |
| 2018 | 10,839 | 5.77% | 6,100,260 | 4.00% | $87,421,299 | 2.15% | 563 | $8,065 |
| 2019 | 9928 | -8.40% | 7,461,077 | 22.31% | $110,577,066 | 26.49% | 752 | $11,138 |
| 2020 | 12,423 | 25.13% | 10,766,492 | 44.30% | $161,611,294 | 46.15% | 867 | $13,009 |
| 2021 | 13,006 | 4.69% | 27,717,479 | 157.44% | $396,260,629 | 145.19% | 2131 | $30,468 |
| 2022 | 14,595 | 12.22% | 29,593,184 | 6.77% | $438,873,124 | 10.75% | 2028 | $30,070 |
This continues to be terrific general “Long-Tail” growth in the category overall – number of books available hits a new record at over 14k items, while both units sold and calculated dollars are show solid growth. Average sales per title are down a smidge, but this is still a lot of books sold!
When you start breaking down the manga portion of the chart by publisher, there’s really not any contest at all: there’s a two-ton gorilla, and then a bunch of smaller houses struggling in their shadow. This chart represents all 14,595 books that are “manga” in NPD BookScan in 2022, by quantity sold, and represents the entire “long tail” of the charts:
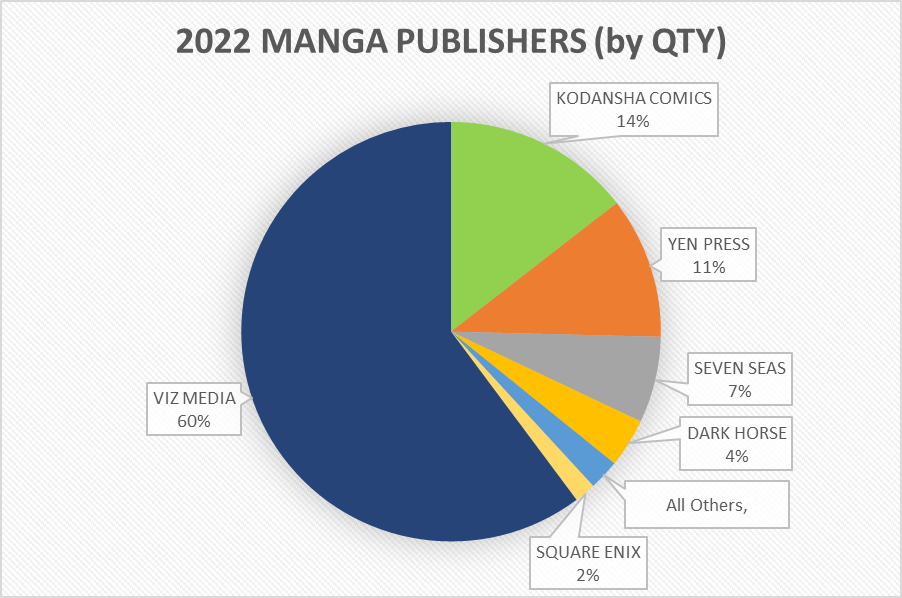
Viz is unquestionably the dominant player, selling 60% of all manga sold in 2022. This is up from 57% last year.
If we look solely within the Top 750, the picture is very similar: The #1 publisher is Viz who takes 301 of the 458 manga spots in the Top 750, keeping them as the overwhelmingly dominant player with almost two thirds of the placing titles! Within the Top 750, Viz (and their Yaoi sub-imprint of Sublime) charted about 12.6 million pieces, for more than $158 million of calculated retail dollars – this is yet another year of strong growth for Viz: they sold 10.8m books the previous year.
Viz controls the manga charts as they have for a very long time now. It is nearly impossible to envision anyone really challenging them substantially for that role because they are more than four times the size than their nearest competitor in their segment.
Viz’s #1 Best-seller is Chainsaw Man, and v1 is the year’s best-selling manga with nearly 277k sold, and there are four volumes within Viz’s Top Ten (at places #4, #8, and #9), and all eleven released volumes make the Top 750 – together, those eleven volumes sell 1.8m copies. This is a great example of a book which appears to be driven significantly by the anime adaptation.
I’d say much the same for Viz’s #2 seller, “Spy X Family” – v1 is the #2 book, with 271k sold, two volumes in the Top Ten (v2 is #10, with 174k), and all eight released volumes are in the Top 750, with combined sales of nearly 1.1m. It looks to me that sales are driven as much by the anime as not.
“Demon Slayer: Kimetsu No Yaiba” is Viz’s #3 most popular property in 2022, with two volumes placing in their top ten (v1 shifts 265k, while “Stories of Water and Flame” sells about 215k at #5), and all twenty-three volumes (and the box set – 49k copies sold!) place in the Top 750. Combined this property shifts 2.1 million units. It was only 1.6m units in 2020. Again, it also has a recent anime release.
“Jujutsu Kaisen” has volume 0 placing as Viz’s #6 best seller (182k), and all nineteen volumes of the series place in the Top 750, selling 1.4m combined
The last unique title placing in Viz’s Top Ten, at #7 is “My Hero Academia” with v1 shifting 180k copies. There are 32 volumes total, plus another three spin-off series with another 20 volumes (“Smash!!”, “Team Up Missions” and “Vigilantes” are the series) with 29 of the 52 combined appearing in the Top 750. If you combine every MHA title, you come up with 1.3m copies sold of those fifty-two books (that was just about 2m copies last year, so it’s a real drop)
MHA is a great example of “The Hammock Principle”. Briefly stated, this is books in a series that generally sell in a sales pattern that looks like a hammock if you chart it out: the first few volumes and the last few volumes sell the best, with the ends running down into the middle volumes which have the lowest sales, like the sagging part of a hammock. The problem with this is both that stores don’t have infinite rack space, as well as publishers that need a certain volume and velocity to keep things in print, so that sagging middle becomes unsustainable for most series over time, and many stores start to only carry the first and last few volumes. In the case of MHA, v1 sold 180k, v30 sold 123k, which the worst selling of the main series, v15 sold “only” 8600 copies this year. That’s a pretty massive gap in sales that is running down the hammock, and shows just how hard it is for retail stores to carry every volume in a series so wide.
Other strong series for Viz outside of their Top Ten include “Kaiju No. 8” (#20 for v1 at 118k sold), Junji Ito’s “Uzumaki” (#28, with 106k sold – Ito also sells 60k copies of “Tomie”), “Komi Can’t Communicate” (#32 for v1 at 96k), “Haikyu!!” (#34 for v1 at 94k), “Death Note” (“Short Stories” places #37 and 87k sold, while v1 of the “Black Edition” is #44 with 76k sold), as well as Deadpool: Samurai, a manga version of the Marvel comic, that sells 74k of v1 at #45 for Viz. It’s worth noting here that the best-selling comic Marvel itself is able to sell is a relatively paltry 17k copies of “Moon Knight” (more on that below), less than a quarter of what Viz was able to do.
Viz also sells 70k copies of v1 of “Tokyo Ghoul”, 67k copies of “The Promised Neverland” v1, 63k copies of the newest volume (v15) of “Dragon Ball Super”, 57k copies of v1 of “One Punch Man”, 52k copies of v1 of “One Piece” and 50k copies of v1 of “Naruto”. All-in-all Viz sells a staggering seventy-two individual books over 50k copies. That is ginormous!
For Viz’s Yaoi imprint, Sublime, the best-seller is “Given”, where v1 shifts 33k, with v2 at 15k and v3 at 13k. The imprint also places, in the Top 750, “Links” (15k), as well as “Dick Fight Island” (15k for v1, and 13k for v2)
Let’s take a look at the “long tail” of Viz? This is their sales of all products sold for the entire year, whether or not it made the Top 750
| Year | # of listed items | Percent Change | Total Unit Sold | Percent Change | Calculated Retail Value | Percent Change | Av. Sale per title | Av $ per title |
| 2007 | 2018 | —— | 6,249,324 | —— | $55,123,347 | —– | 3097 | $27,316 |
| 2008 | 2447 | 21.26% | 5,536,286 | -11.41% | $50,311,791 | -8.97% | 2263 | $20,561 |
| 2009 | 2793 | 14.14% | 4,819,407 | -12.95% | $44,310,790 | -11.93% | 1726 | $15,865 |
| 2010 | 3088 | 10.56% | 3,576,671 | -25.79% | $35,041,305 | -20.92% | 1158 | $11,348 |
| 2011 | 3393 | 9.88% | 3,276,297 | -8.40% | $32,766,960 | -6.49% | 966 | $9,657 |
| 2012 | 3518 | 3.68% | 2,099,560 | -35.92% | $22,433,721 | -31.54% | 597 | $6,377 |
| 2013 | 3636 | 3.35% | 1,853,211 | -11.73% | $21,586,923 | -3.77% | 510 | $5,937 |
| 2014 | 3765 | 3.55% | 1,855,161 | 0.11% | $22,732,074 | 5.30% | 493 | $6,038 |
| 2015* | 2264 | -39.87% | 2,150,656 | 15.93% | $28,134,971 | 23.77% | 950 | $12,427 |
| 2016* | 2405 | 6.23% | 2,811,978 | 30.75% | $38,854,681 | 38.10% | 1169 | $16,156 |
| 2017 | 4443 | 84.74% | 2,958,351 | 5.21% | $41,594,729 | 7.80% | 666 | $9,362 |
| 2018 | 4637 | 4.37% | 3,184,274 | 7.64% | $44,423,434 | 6.80% | 687 | $9,580 |
| 2019 | 4702 | 1.40% | 4,329,369 | 35.96% | $60,817,993 | 36.91% | 921 | $12,934 |
| 2020 | 4856 | 3.28% | 6,614,179 | 52.77% | $94,768,000 | 55.82% | 1362 | $19,516 |
| 2021 | 5183 | 6.73% | 15,804,613 | 138.95% | $208,440,832 | 119.95% | 3049 | $40,216 |
| 2022 | 5270 | 1.68% | 17,816,487 | 12.73% | $233,268,459 | 11.91% | 3381 | $44,263 |
Viz’s long-tail is incredibly impressive, with an under 2% growth of products, but nearly a 13% growth in circulation this year, all on their highest totals of sales as long as we have recorded this. Viz in 2022 has five books over 200k, an additional 25 books over 100k, 42 more over 50k, another 44 over 30k, an additional 44 over 20k, and an incredible 178 others over 10k. They are a very very very strong publisher in short, and they completely blow past the scales we’ve invented to describe other publishers.
In second place among manga publishers, we have Kodansha Comics (They also publish as Vertical, which they completed purchase of in 2020), which places 65 titles within the top 750, with just under 1.6 million in units sold (compared to 3m in sales in 2021), and $23.8 million in calculated retail dollars ($40.6m in 2020). Kodansha lost a great deal of market share in 2022.
Kodansha’s licenses formerly were both the original backbone of Tokyopop, as well as being the majority of Del Rey Manga. Kodansha pulled Tpop’s license in March of ’09 and Del Rey in October of ’10. You may want to look at those publisher’s listings below to get a better historical overview.
Kodansha’s #1 best-seller is Attack on Titan, with v1 shifting nearly 88k units in 2022 – this is a big drop from 170k last year. Attack on Titan takes five of the ten top spots for Kodansha, and within the Top 750, 17 volumes place, selling 570k copies – the first seven and the most recent six, the first three 3-in-1 omnibus, and two box sets. The rest are down in “the hammock”. As noted, v1 sold 88k, with v34 selling 72k, but v24 is down at about 3400 copies. That is only about 5% of the higher ends of “the hammock” All told there are 95 different volumes of “AoT” (and spinoffs) on BookScan 2022, and they sum up to 800k sold.
Also within the Top Ten for Kodansha is “Sailor Moon” (v1 is #4 with 59k, v2 is #9 at 40k), “Wotakoi: Love is Hard for Otaku” (v1 is #5 at 57k, v6 is #7 at 53k) and v1 of “Blue Lock” at #8 and 51k. They only have eight books over 50k this year.
The best-seller of the Vertical imprint is v1 of The Complete Chi’s Sweet Home, which registers a bit over 17k sold.
These Long Tail figures are for Kodansha-published titles, and they reflect that Kodansha, itself, first started publishing in 2010. I have adjusted the figures from 2011 on to now include Vertical as well:
| Year | # of listed items | Percent Change | Total Unit Sold | Percent Change | Calculated Retail Value | Percent Change | Av. Sale per title | Av $ per title |
| 2010 | 9 | —— | 13,291 | —— | $322,717 | —— | 1477 | $35,857 |
| 2011 | 192 | 2033.33% | 246,083 | 1751.50% | $3,236,474 | 902.88% | 1282 | $16,857 |
| 2012 | 364 | 89.58% | 369,853 | 50.30% | $4,697,856 | 45.52% | 1016 | $12,906 |
| 2013 | 479 | 31.59% | 563,460 | 52.35% | $7,427,739 | 58.11% | 1176 | $15,507 |
| 2014 | 629 | 31.32% | 904,610 | 60.55% | $11,972,992 | 61.19% | 1438 | $19,035 |
| 2015* | 617 | -1.91% | 965,519 | 6.73% | $12,894,698 | 7.70% | 1565 | $20,899 |
| 2016* | 772 | 25.12% | 1,154,178 | 19.54% | $15,527,849 | 20.42% | 1495 | $20,114 |
| 2017 | 1164 | 50.78% | 1,098,812 | -4.80% | $16,795,188 | 8.16% | 944 | $14,429 |
| 2018 | 1399 | 20.19% | 1,033,780 | -5.92% | $15,396,607 | -8.33% | 739 | $11,005 |
| 2019 | 1564 | 11.79% | 1,152,720 | 11.51% | $18,674,181 | 21.29% | 737 | $11,940 |
| 2020 | 1740 | 11.25% | 1,548,349 | 34.32% | $24,524,651 | 31.33% | 890 | $14,095 |
| 2021 | 1975 | 13.51% | 5,655,992 | 265.29% | $84,299,372 | 243.73% | 2864 | $42,683 |
| 2022 | 2255 | 14.18% | 4,289,828 | -24.15% | $69,249,595 | -17.85% | 1902 | $30,709 |
In 2022, Kodansha took a pretty big hit – despite having 14% more books, sales are down nearly a quarter. Much of this is the receding tide from “Attack on Titan”. Kodansha has eight books selling over 50k, four more over 30k, fifteen others over 20k, and fifty-three more titles that sell over 10k – this is still a solid performance, but it pales next to the giant that is Viz.
The #3 publisher of Manga in 2022 is Yen Press, which places 46 titles into the Top 750, for about 1.5 million copies sold (up about 200k copies from the previous year), and $47.9 million of calculated retail gross. Yen is a division of Hachette (more on them later).
Yen’s major hit is Toilet-Bound Hanako-Kun, which takes six of their ten best-selling spots. V1 (their #1 best-seller) sells 123k copies in 2022, while v2 (#2) pulls in 96k, v0 (#5) sells 63k, v3 (#7) racks up 62k. They also place v13 (#9 and 52k) while v4 sells about 45k copies at position #10.
Yen’s other four Top Ten best-sellers is completed by Solo Leveling where v1 (#3) sells almost 89k, v4 (#4) does 65k, v2 is #6 with 63k, and v3 is #8 at 52k. Nothing else from Yen sells over 50k.
Finally, Yen has a Korean comics sub-imprint called “Ize Press” (this is technically “Manwha”, rather than “Manga” if you want to split hairs) that began this year. It places a single title in the Top 750, Villains Are Destined to Die, which sold around 13k
In the Long Tail Yen things show solid growth
| Year | # of listed items | Percent Change | Total Unit Sold | Percent Change | Calculated Retail Value | Percent Change | Av. Sale per title | Av $ per title |
| 2007 | 10 | —— | 12,896 | —— | $147,449 | —– | 1,290 | $14,745 |
| 2008 | 90 | 800.00% | 110,126 | 753.95% | $1,237,860 | 739.52% | 1,224 | $13,754 |
| 2009 | 211 | 134.44% | 330,962 | 200.53% | $3,697,113 | 198.67% | 1,569 | $17,522 |
| 2010 | 344 | 63.03% | 560,983 | 69.50% | $6,650,871 | 79.89% | 1,680 | $19,334 |
| 2011 | 460 | 33.72% | 764,125 | 36.21% | $9,953,966 | 49.66% | 1,661 | $21,639 |
| 2012 | 548 | 19.13% | 647,948 | -15.20% | $8,735,264 | -12.24% | 1,182 | $15,940 |
| 2013 | 654 | 19.34% | 692,380 | 6.86% | $9,715,421 | 11.22% | 1,059 | $14,855 |
| 2014 | 776 | 18.65% | 682,135 | -1.48% | $9,985,502 | 2.78% | 776 | $12,868 |
| 2015* | 649 | -16.37% | 917,620 | 34.52% | $13,248,445 | 32.68% | 1414 | $20,414 |
| 2016* | 793 | 22.19% | 1,072,008 | 16.82% | $15,520,207 | 17.15% | 1352 | $19,572 |
| 2017 | 1403 | 76.92% | 928,962 | -13.34% | $13,866,675 | -10.65% | 662 | $9,884 |
| 2018 | 1737 | 23.81% | 890,228 | -4.17% | $13,051,751 | -5.88% | 513 | $7,514 |
| 2019 | 1846 | 6.28% | 884,596 | -0.63% | $13,008,175 | -0.33% | 479 | $7,047 |
| 2020 | 2010 | 8.88% | 1,090,002 | 23.22% | $15,797,758 | 21.44% | 542 | $7,860 |
| 2021 | 2147 | 6.82% | 3,018,454 | 176.92% | $43,696,021 | 176.60% | 1406 | $20,352 |
| 2022 | 2297 | 6.99% | 3,224,346 | 6.82% | $47,913,494 | 9.65% | 1404 | $20,859 |
Yen Press in 2022 grows unit sales by 6.8%, and has one book over 100k, another eight titles over 50k, eight more over 30k, another nine selling over 20k copies, and twenty-four more that place over 10k. This is a great performance.
Moving up a bit to the #4 manga publisher as represented by the NPD BookScan Top 750 is Seven Seas, which places 11 titles for almost 201k copies sold combined and a calculated value that comes out just over $4.1 million.
Seven Seas also includes Ghost Ship, though that imprint doesn’t place anything in the Top 750 this year.
Seven Seas’ biggest success in 2022 is the Omnibus editions of Tokyo Revengers: v1 (#1) sells almost 38k, while v2 (#4) is at 18k. The omnibus edition of I Want to Eat Your Pancreas (#2) sells 29k, while “Orange” v1 (#3) does 21k, and v2 (#8). And the back of the Top Ten is brought up with Seaside Stranger (v1, #5, 16k and v2, #6, 15k), the omnibus hardcover of The Girl From The Other Side: Siúil, a Rún (#7, 14k), v1 of Cat Massage Therapy (#8, 14k) and v1 of Creepy Cat with 11k at #10.
The best-seller for the Ghost Ship imprint is Darling in the Franxx at 10k
Seven Seas’ Long Tail shows another “best year ever”, with growth beating most of their Manga peers
| Year | # of listed items | Percent Change | Total Unit Sold | Percent Change | Calculated Retail Value | Percent Change | Av. Sale per title | Av $ per title |
| 2007 | 54 | —— | 50,641 | —— | $558,450 | —– | 938 | $10,342 |
| 2008 | 76 | 41.74% | 80,112 | 58.20% | $833,667 | 49.28% | 1054 | $10,969 |
| 2009 | 97 | 27.63% | 74,967 | -6.42% | $807,666 | -3.12% | 773 | $8.326 |
| 2010 | 93 | -4.12% | 75,764 | 1.06% | $875,612 | 8.41% | 815 | $9,415 |
| 2011 | 118 | 26.88% | 116,360 | 53.58% | $1,426,618 | 62.93% | 986 | $12,090 |
| 2012 | 151 | 27.97% | 124,262 | 6.79% | $1,684,994 | 18.11% | 823 | $11,159 |
| 2013 | 223 | 47.68% | 204,419 | 64.51% | $2,942,608 | 74.64% | 917 | $13,196 |
| 2014 | 300 | 34.53% | 284,484 | 39.17% | $3,979,338 | 35.23% | 948 | $13,264 |
| 2015* | 304 | 1.34% | 374,715 | 31.72% | $5,177,568 | 30.11% | 1233 | $17,031 |
| 2016* | 417 | 37.17% | 491,947 | 31.29% | $6,960,634 | 34.44% | 1180 | $16,692 |
| 2017 | 554 | 32.85% | 478,336 | -2.77% | $6,801,527 | -2.29% | 863 | $12,277 |
| 2018 | 906 | 63.54% | 667,556 | 39.56% | $9,511,591 | 39.84% | 737 | $10,498 |
| 2019 | 1049 | 15.78% | 671,362 | 0.57% | $9,498,329 | -0.14% | 640 | $9,055 |
| 2020 | 1230 | 17.25% | 699,127 | 4.14% | $9,913,480 | 4.37% | 568 | $8,060 |
| 2021 | 1518 | 23.41% | 1,590,317 | 127.47% | $22,972,596 | 131.73% | 1048 | $15,133 |
| 2022 | 2031 | 33.79% | 1,967,627 | 23.73% | $30,001,482 | 30.60% | 969 | $14,472 |
Seven Seas has the one title that sells over 30k, two more over 20k, and an additional thirteen more over 10k.
Falling back a step to #5 manga publisher in the Top 750 in 2022 is Dark Horse. They place 20 titles in the Top 750, whose combined sales represent 732k copies sold (up from 596k in last year) and $31.8m in calculated retail.
The best-selling DH series continues to be Berserk with the $50 hardcover editions outselling the cheaper softcovers: 16 of Dark Horse’s placing books are Berserk. The HC of v1 (#1 for Dark Horse) racked up an impressive 146k sold – this is up from 57kk last year. V2 (#2) sells more than 82k, v3 (#3) racks 54k, v10 (#4) does 46k, v4 (#5) does 45k, and v5 (#6) moves 43k. Then we shift to the softcover of v1 (#7) that sells 34k, and then we shift back to HC for v6 (#8) with 33k, v11 (#9) with 31k, and v7 rounding out at #10 and 31k. Altogether, all Berserk combined sells 799k copies for Dark Horse.
Other than Berserk, Dark Horse also does well with Mob Psycho 100 where v1 sells almost 27k
Looking at the Long Tail, this is what Dark Horse’s (manga only!) recent performance looks like – like most manga in 2022 it’s growing! There is much more on Dark Horse down below in the “Western Publishers” section.
| Year | # of listed items | Percent Change | Total Unit Sold | Percent Change | Calculated Retail Value | Percent Change | Av. Sale per title | Av $ per title |
| 2007 | 341 | —— | 249,943 | —— | $3,329,464 | —– | 733 | $14,745 |
| 2008 | 420 | 23.17% | 248,981 | -0.38% | $3,176,870 | -4.58% | 593 | $7,564 |
| 2009 | 455 | 8.33% | 226,497 | -9.03% | $2,915,693 | -8.22% | 498 | $6,408 |
| 2010 | 473 | 3.96% | 194,494 | -14.13% | $2,633,077 | -9.69% | 411 | $5,567 |
| 2011 | 497 | 5.07% | 189,329 | -2.66% | $2,602,230 | -1.17% | 381 | $5,236 |
| 2012 | 493 | -0.80% | 112,373 | -40.65% | $1,631,038 | -37.32% | 228 | $3,308 |
| 2013 | 521 | 5.68% | 103,538 | -7.86% | $1,678,563 | 2.91% | 199 | $3,222 |
| 2014 | 559 | 7.29% | 100,894 | -2.60% | $1,617,251 | -3.65% | 180 | $2,893 |
| 2015* | 303 | -45.80% | 135,444 | 34.24% | $2,238,167 | 38.39% | 447 | $7,387 |
| 2016* | 225 | -25.74% | 174,298 | 28.69% | $2,291,355 | 2.38% | 775 | $10,184 |
| 2017 | 527 | 234.22% | 238,089 | 36.60% | $3,795,506 | 65.64% | 452 | $7,202 |
| 2018 | 531 | 0.76% | 224,010 | -5.91% | $3,579,135 | -5.70% | 422 | $6,740 |
| 2019 | 384 | -27.68% | 329,034 | 46.88% | $7,280,058 | 103.40% | 857 | $18,958 |
| 2020 | 472 | 22.92 | 430,762 | 30.92% | $11,111,354 | 52.63% | 913 | $23,541 |
| 2021 | 431 | -8.69% | 1,009,527 | 134.36% | $26,954,363 | 142.58% | 2342 | $62,539 |
| 2022 | 455 | 5.57% | 1,113,260 | 10.28% | $39,082,966 | 45.00% | 2447 | $85,897 |
It’s a good performance in units, but it’s an exceptional performance with Calculated retail. In fact, Dark Horse is earning more per copy sold than any other manga publisher, by a serious margin (at least… theoretically, Calculated retailer is mostly a fiction) – those $50 hardcovers sure add up. Dark Horse Manga has one book over 100k, two more over 50k, eight more over 30k, another two over 20k, and seven more books over 10k. Pound for pound Dark Horse is doing superb with Manga.
Finally for the Manga category in the Top 750 in 2022, we have, at #6 placement, relatively new imprint Square Enix – they launched in late 2019. This year within the Top 750, they place eleven titles that combine for 242k sold, and just over $4 million in calculated dollars.
Square Enix’s best seller is My Dress-Up Darling, which takes six of the top ten. V1 (#1) sells 36k while the other five all sell between 22 and 28k, a surprisingly grouped sales pattern. This is broken by Soul Eater v1 (#4) at 25k, v2 (#9) at 14k and v5 (#10) at just under 14k, and followed at #8 by A Man and His Cat with 18k.
Because this is the first time they’ve placed books over 10k sold, and is their second year directly printing books under this imprint’s name, this will be the first time that I’ll be building a Long Tail for them, which looks like this:
| Year | # of listed items | Percent Change | Total Unit Sold | Percent Change | Calculated Retail Value | Percent Change | Av. Sale per title | Av $ per title |
| 2020 | 20 | ——– | 49,251 | ——- | $703,806 | ——- | 568 | $8,060 |
| 2021 | 50 | 150% | 294,520 | 498.00% | $4,298,970 | 510.82% | 5890 | $85,979 |
| 2022 | 99 | 98% | 485,713 | 64.92% | $7,516,321 | 74.84% | 4906 | $75,922 |
Square Enix has one book over 30k, six more over 20k, and another four over 10k.
Finally for Manga in 2022, we have a new first: we’ve got several books that qualified for the Top 750, but are not from sources where it is valuable to create full Long Tail listings for.
The first such book is Hayao Miyazaki’s Shuna’s Journey which sells an impressive 40k copies in Hardcover. It is published by FirstSecond, an imprint of Macmillan. Since that’s basically the only Manga coming from FirstSecond, it will be reflected in the “Western” Long Tail down below.
Next, we have Disney Manga: Time Burton’s The Nightmare Before Christmas – Mirror Moon, quite a long-winded title! While it makes the Top 750, it’s down towards the bottom, with right around 16k sold. This is a Tokyopop book, and is the first Tpop book to show in the charts in quite some time. However, despite it having a BISAC listing that identifies it as Manga, none of the creators are Asian, and the Amazon Look Inside shows a book that very much looks like a Western comic to this viewer, rather than Manga. I’ll let you decide, though my guess is that this book won’t show in next year’s chart, making real debate fairly moot.
And finally for the Manga category, we wrap up with v1 of I Hear the Sunspot: Limit (about 13k sold) from One Peace Books.
2022 Western Publishers
When I say “Western” here, I mean publishers/work from Europe and America, as opposed to Asia, not publishers of the genre of “western” comics!
NPD BookScan itself does not try to control how data gets initially logged (or changed), leaving that all to publishers. I think that I understand this reasoning: the publisher is the customer to BookScan, and they should have some level of control over how they are represented, but as a person who tries to decipher the data each year, I know that I would prefer some sort of internally-consistent (and externally-petionable!) method of categorizing titles that doesn’t seem to change in some fashion from year-to-year – Books will appear and disappear, almost seemingly willy-nilly, and it makes showing you anything even resembling consistent data staggeringly difficult. All of this is a function of how publishers assign BISACs and in what order – please please read the long section below on how the sausage is made!X
I’d also like to continue to give you a top-level reminder that back in 2008 there was some sort of behind-the-scenes recategorization in what got sent to me – I now know this is probably a change in BISAC codes! – and most of the “cartoon-strip humor” books like “Calvin & Hobbes” and “The Far Side” suddenly disappeared, so there’s kind of a not-strictly apples thing going on with the pre-2008 numbers here. Do keep that in mind when making comparisons both in the Top 750 chart, as well as the Long Tail.
Another observation I have to repeat is that NPD BookScan tracks (theoretically at least, since again, publishers set their own BISACs) Adult reading distinctly from YA and Kids. I don’t. Part of this is that I’m a bookseller, and I’m rather agnostic about who specifically buys books as a result. But I have to be certain to make this point as clearly as I can: the market for who is buying comics is changing, and it is changing for the wider and the better. The eight year old who is inhaling Dav Pilkey in 2022 is going to be the comics-literate adult of 2035 (or whatever), which is going to change what comics readers in the 2030s will want or expect from comics. The kids reading comics in 1965 totally imagined what the 1980’s comics scene could and would be, which is why we’re where we are today, but the shape of the Western industry in the future is absolutely what today’s children read and see.
Ignore this at your deadliest of perils: the future is always shaped by the present, even if that isn’t what you personally want.
OK, enough editorializing, let’s look at the market!
Here’s the Western Top 750 over time:
| Year | # of placing titles | Unit sales | Calculated Retail price |
| 2003 | 304 | 2,133,618 | $32,360,644 |
| 2004 | 233 | 1,467,535 | $22,713,802 |
| 2005 | 142 | 1,315,920 | $21,537,155 |
| 2006 | 174 | 1,689,571 | $29,314,852 |
| 2007 | 175 | 1,746,962 | $33,247,187 |
| 2008 | 236 | 2,710,175 | $48,327,594 |
| 2009 | 299 | 3,219,748 | $52,147,410 |
| 2010 | 314 | 3,297,317 | $54,515,605 |
| 2011 | 358 | 3,068,593 | $77,254,870 |
| 2012 | 383 | 3,530,143 | $68,593,986 |
| 2013 | 435 | 3,988,864 | $74,805,932 |
| 2014 | 479 | 4,910,846 | $90,166,989 |
| 2015* | 471 | 6,729,449 | $115,035,044 |
| 2016* | 439 | 7,338,541 | $123,594,588 |
| 2017 | 466 | 7,846,357 | $117,761,519 |
| 2018 | 451 | 9,114,745 | $129,929,990 |
| 2019 | 418 | 11,998,489 | $176,470,137 |
| 2020 | 392 | 12,825,951 | $196,604,939 |
| 2021 | 255 | 14,752,121 | $225,424,778 |
| 2022 | 292 | 14,104,511 | $225,392,545 |
2022 NPD BookScan’s Top 750 for Western publishers is doing passably: more titles placed this year than last, but sales are down within the Top 750 by 4.4% in units (and are essentially flat in calculated dollars) It’s a broadly poor performance when you compare it to Manga for the year, but it’s still the second largest total sales that we’ve tracked in twenty years of doing this.
If we were to look at the entirety of all of NPD BookScan’s reported numbers for the total 35,461 distinct “Western” comics, things look generally like this – there are 1891 publishers listed in the 2022 chart, but only 14 of them manage to capture 1% or more of the market
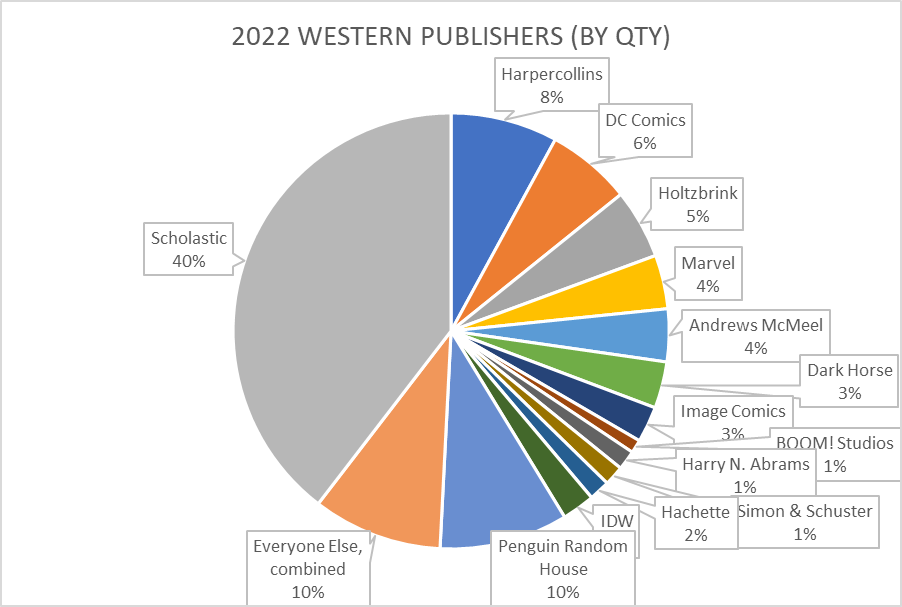
This is not quite as lopsided as the Manga chart… But it is still a bit overwhelming that one publisher (Scholastic) is 40% of all graphic novels sold. And that Marvel and DC combined are only 10% in the book market.
Let’s start with a look at the Long Tail for Western publishers collectively. As you see the comparison against the Top 750 is leaning harder on best-sellers – the best-selling books in the Top 750 sell around 60% of the volume of all graphic novels sold in 2021 as reported to NPD BookScan. Please pay attention: the “other” 34,000+ books really don’t sell all that well. This is how books work.
| Year | # of listed items | % Change | Total Pieces | % Change | Calculated Retail Value | % Change | Av. Sale per title | Av $ per title |
| 2007 | 6950 | — | 3,029,039 | — | $74,595,605 | — | 436 | $10,733 |
| 2008 | 9728 | 39.97% | 5,368,678 | 77.24% | $98,233,459 | 31.69% | 552 | $10,098 |
| 2009 | 10,936 | 12.30% | 5,946,595 | 10.76% | $107,263,294 | 9.19% | 544 | $9,808 |
| 2010 | 13,229 | 20.97% | 5,890,507 | -0.01% | $105,342,577 | -0.02% | 445 | $7,963 |
| 2011 | 14,954 | 13.04% | 6,001,731 | 1.89% | $112,823,763 | 7.10% | 401 | $7,545 |
| 2012 | 17,031 | 13.89% | 6,052,179 | 0.84% | $123,471,753 | 9.44% | 355 | $7,250 |
| 2013 | 17,468 | 2.57% | 6,637,420 | 9.67% | $131,767,547 | 6.72% | 380 | $7,543 |
| 2014 | 19,524 | 11.77% | 7,905,939 | 19.11% | $156,040,431 | 18.21% | 405 | $7,992 |
| 2015* | 18,019 | -7.71% | 10,689,116 | 34.44% | $197,553,909 | 26.60% | 593 | $10,964 |
| 2016* | 16,328 | -9.38% | 11,516,867 | 7.74% | $212,698,759 | 7.67% | 705 | $13,027 |
| 2017 | 25,183 | 54.23% | 12,544,715 | 8.92% | $217,360,776 | 2.19% | 498 | $8,631 |
| 2018 | 27,583 | 9.53% | 13,865,209 | 10.53% | $230,924,408 | 6.24% | 503 | $8,372 |
| 2019 | 30,816 | 11.72% | 17,233,606 | 24.29% | $288,745,613 | 25.04% | 559 | $9,370 |
| 2020 | 31,893 | 3.49% | 18,495,127 | 7.3% | $318,796,963 | 10.41% | 580 | $9,996 |
| 2021 | 34,624 | 8.56% | 24,105,059 | 30.33% | $430,020,217 | 34.89% | 696 | $12,420 |
| 2022 | 35,461 | 2.42% | 23,021,158 | -4.50% | $424,701,052 | -1.24% | 649 | $11,977 |
The Long Tail is not looking fantastic for the Western graphic novel in 2022 – nearly 2.5% more products, but sales are down by 4.5%. Much of this is drops at the top of the sales charts, but it’s still a thing to watch to see if it continues.
Next, we’ll survey each of the publishers, and their best-selling titles, ranking them by the number of pieces they sold this year with the Top 750 of NPD BookScan. We’ll also look at the “long tail” for each entry discussing the entirety of NPD BookScan.
It is now the eighth year in the row that our #1 Western publisher in the NPD BookScan Top 750 is Scholastic. Given that they only started “doing” comics in 2005, and in that time they’ve grown to 40% of the market with only 520 SKUs… well, I think that is a hell of an achievement. Further, it seems unlikely to get supplanted anytime soon unless kids collectively decide that they suddenly don’t like Dav Pilkey any longer.
Within the Top 750, Scholastic sells a staggering 8.5 million copies, from 91 placing books – but this is a real drop from 9.4 million copies sold the previous year. Every number reported here is only from retail sales through NPD BookScan reporters – this doesn’t count what I will assume are much larger numbers of copies that happen via the incredibly successful Scholastic Book Fairs, direct to students. Nor does this count any sales that are being done to elementary and middle school libraries, numbers that likely exceed retail sales. Possibly by a multiple?
Also consider that the next largest publisher sold a combined 1.5m copies in the Top 750, or only about a sixth of Scholastic’s volume. Or, how about this: if you combine the Top 750 performance of all of the traditional Direct Market “Premiere” publishers (Boom!, Dark Horse, DC, Dynamite, IDW, Image and Marvel) those combined best-sellers only amount to 890k books sold combined, or about a tenth of Scholastic alone. Scholastic is, quite simply, the ruler of the Top 750 in the Western charts.
Scholastic has several imprints – besides the Graphix imprint, they also publish as AFK, Arthur A. Levine and Blue Sky, as well as “Scholastic”, itself (although almost of the big sales action is at Graphix)
In alphabetical order by imprint:
Virtually none of Scholastics imprints don’t fit inside the Top 750 this year, including our alphabetical first: AFK’s best-seller is not quite 4500 copies of “Bendy: Crack-Up Comics Collection” which is material from the 1930s and 1940s
Arthur A. Levine does a bit better: a bit over 6k copies of “The Arrival” by Shaun Tan.
Blue Sky not only misses the Top 750, but they do almost nothing at all in this year’s BookScan – the best-selling book labeled as being from Blue Sky on the comics charts is Dav Pilkey’s The Adventures of Ook and Gluk, Kung-Fu Cavemen From The Future, which sells, erm, all of 29 copies this year. I think I expected more, given the rampaging success of “Dog Man” and “Cat Kid”!
The Graphix imprint is where all of the action is. Up above at the top of the column in the “Top Twenty” section we talked about Dav Pilkey, and “Five Nights at Freddy’s” and “Baby Sitters Club” and “Wings of Fire” and “Heartstopper” so there doesn’t seem to be an enormous need to talk about all of the same books again? And those books are all in Scholastic’s Top 20 as well.
Outside of those, I’m not sure what else to mention? Hm, how about this: while she was once “The Queen of Comics”, Raina Telgemeier’s books have dropped off quite a bit – this year, her self-created titles “Guts” (145k), “Smile” (123k), “Drama” (102k), “Sisters” (70k), and “Ghosts” (61k) have all dropped considerably – between all of the various editions and sets, Raina “only” sells about 560k books, down considerably from a million copies last year. But she’s had five years since her last new book, which is half the life of her mostly-kids audience. Kazu Kibuishi’s “Amulet” has also dropped off considerably, which I will also ascribe to no new releases in a half-decade.
After this, we’re looking at books under 50k, though many of these still sell much better than things you would otherwise expect – one super-clear example is the 42k copies of Scholastic’s Miles Morales: Shock Waves, which sells about three times better than any other Marvel graphic novel published by Marvel. The success of Scholastic is funny to me in that I start drawing arbitrary lines at 50k as “important enough to mention”, when almost any other publisher is incredibly lucky to have more than three or four titles selling that well.
The Long Tail for Scholastic looks like this – they had a real drop this year:
| Year | # of listed items | Percent Change | Total Unit Sold | Percent Change | Calculated Retail price | Percent Change | Av. Sale per title | Av $ per title |
| 2007 | 28 | —— | 203,900 | —— | $2,018,694 | —– | 7282 | $72,096 |
| 2008 | 39 | 39.29% | 346,134 | 69.76% | $3,498,012 | 73.28% | 8875 | $89,693 |
| 2009 | 52 | 33.33% | 432,070 | 24.83% | $4,654,686 | 33.07% | 8309 | $89,513 |
| 2010 | 60 | 15.38% | 361,086 | -16.43% | $4,084,718 | -12.25% | 6018 | $68,079 |
| 2011 | 72 | 20.00% | 419,010 | 16.04% | $4,708,860 | 15.28% | 5819 | $65,401 |
| 2012 | 76 | 5.56% | 325,088 | -22.42% | $3,955,249 | -16.00% | 4277 | $52,043 |
| 2013 | 91 | 19.74% | 437,590 | 34.61% | $5,365,921 | 35.67% | 4809 | $58,967 |
| 2014 | 97 | 6.59% | 846,277 | 93.39% | $10,204,175 | 90.17% | 8725 | $105,198 |
| 2015* | 140 | 44.33% | 1,449,296 | 71.26% | $17,170,714 | 68.27% | 10,352 | $122,648 |
| 2016* | 131 | -6.43% | 1,940,760 | 33.91% | $23,919,704 | 39.31% | 14,815 | $182,593 |
| 2017 | 166 | 26.72% | 2,823,345 | 45.55% | $33,884,541 | 41.66% | 17,008 | $204,124 |
| 2018 | 224 | 34.94% | 4,623,212 | 63.75% | $54,645,209 | 61.27% | 20,639 | $243,952 |
| 2019 | 270 | 20.54% | 6,868,794 | 48.57% | $88,878,195 | 62.65% | 25,440 | $329,179 |
| 2020 | 343 | 27.03% | 7,164,029 | 4.30% | $95,638,289 | 7.61% | 20,886 | $278,829 |
| 2021 | 436 | 27.11% | 9,987,540 | 39.41% | $137,156,876 | 43.43% | 22,907 | $314,580 |
| 2022 | 520 | 19.27% | 9,236,437 | -7.52% | $135,077,506 | -1.52% | 17,762 | $259,764 |
Scholastic has one book over 500k, another six over 250k, twenty-five more over 100k, eleven others over 50k, thirty-four more over 20k, and an additional seventeen over 10k. Whew! Any other publisher would be satisfied with a tiny fraction of that (as you will clearly see if you keep reading along)
Even with the 7.5% year-over-year drop, Scholastic still feels like a juggernaut to me: the vast majority of their portfolio is extremely likely to continue as “perennial seller” status. And I continue to lustily fantasize about what might happen if they decided to do two streams of revenue and serialized first before eventual collection.
Stepping up a slot to #2 is one of the traditional “Big Five” book publishers: Penguin Random House. They land 38 titles into the 2022 NPD BookScan Top 750, selling 1.5 million copies for just over $28m in calculated gross sales.
Like a lot of the “big five” book publishers, these companies have lots and lots of imprints built up over decades of publishing books. Penguin Random House, as best as I can tell, has ten distinct imprints that appear in the Top 750 list for 2022 – Alfred A. Knopf, Del Rey, Dial, Pantheon, Penguin, Random House Books For Younger Readers, Random House Graphic, Razorbill, Triangle, and Tundra.
They’re also, in the long tail: (deep breath!) Ace, Ballantine, Bantam, Berkley, Blue Snake, Broadway Books, Clarkson N. Potter, Crown, Delacorte, Doubleday, Dutton, Emblem, Golden, Gotham Books, G.P. Putnam & Sons, Grossett & Dunlap, Hudson Street, InkLit, Knopf, McClelland & Stewart, Montena, Nan A. Talese, New American Library, One World, Penguin, Philomel, Plume, Potter Style, Prestel, Price Stern Sloan, Puffin, Putnam, Riverhead, Rodale, Schocken, Schwartz & Wade, Tarcherperigee, Ten Speed, Three Rivers, Viking Books For Young Readers, Villard, Waterbrook, Watson-Guptill and Yearling. (whew!)
However, they are not (Brian writes down here so he remembers this research each year – you’d be shocked how long it take me to sort through this stuff every time!) the PRH-distributed-only Angry Robot, BCN Multimedia, Beacon, Black Balloon, Campfire, Catapult, Charlesbridge, Devil’s Panties, Dragonfly, Fawcett, Frog In Well, Gefen, Library of America, M Press, New York Review, Nobrow, NoStarch, North Atlantic, Overlook Press, Powerhouse, Quirk, Ramble House, Rizzoli, Sasquatch, Seven Stories Press, Shambhala, Smithsonian, Soft Skull, Sonoma Valley Press, Sunday Press, Universe, or Verso (I am sure I missed a few!!)
Looking at those imprints in alphabetical order, within the Top 750:
Alfred A. Knopf Books For Younger Readers places one book into the Top 750, though not within PRH’s Top Twenty: Roughly 19k copies of White Bird: A Wonder Story.
Del Rey has one placing title for 2022, the Dave Wenzel adaptation of The Hobbit for about 18k copies, and this is solid, steady perennial volume that has consistently placed for years and years.
Dial places two books in the Top 750, and both are by Victoria Jamieson: When Stars Are Scattered (#7 for PRH) at almost 70k copies, Roller Girl (not in the Top Twenty) at about 16k.
Pantheon is their “literary” comics wing, and has some of PRH’s steadiest-sellers. There are four placing in 2022, including Art Spiegelman’s Pulitzer Prize-winning Maus, where volume 1, My Father Bleeds History (#1 for PRH overall) sells nearly 177k copies. Because I was having a conversation on Facebook recently with another retailer who didn’t know this, it’s perhaps worth mentioning that Maus isn’t a “graphic novel”, per se: it’s a collection of an originally serialized mini-comic that was bound into “Raw” Magazine in the early 1980s. This is one of the reasons it is actually split into two volumes, and v2, And Here My Troubles Began (#6 for PRH overall) sells about 73k copies. The complete hardcover edition of both volumes (#3) also sells another 93k copies. In addition to this, v1 Marjane Satrapi’s Persepolis (#10 for PRH overall) sells just over 50k. As always surprises me with Pantheon books, way way less people read v2 – less than a tenth, at 4200 copies, not even making it into the Top 750! But the Complete edition of Persepolis sells 23k. I’m genuinely not sure that I understand these sales patterns, though my assumption is that Pantheon simply isn’t doing a good job explaining these are multi-volume series.
From Penguin Group is almost 14k copies sold of Penguin Classics: Amazing Spider-Man v1, which reprints a bit more than the first nineteen issues of ASM, along with text essays. It’s worth observing that Marvel itself also publishes this same material: in a slightly smaller “Mighty Marvel Masterworks” format for $16 (vs the $28 here), that doesn’t even crack 5k with that (despite it being Marvel’s 9th best-selling book), as well in the $45 full sized “Epic” collection which sells almost 1800 copies, as well as a $125 hardcover, which trickles out 1600 copies sold. Though it seems significant to me that Marvel is the worst publisher for Marvel comics, with Penguin, Scholastic, and Viz all doing meaningfully better in selling Marvel products.
Random House Books For Younger Readers places three titles into the Top 750, all of which are comics adaptations of Mary Pope Osborne’s Magic Tree prose novels. Dinosaurs Before Dark places at #11 for PRH overall, with nearly 49k sold, while The Knight at Dawn (#13) with about 39k. Also selling is Mummies in the Morning which sells a smidge under 15k.
Random House Graphic (which on some level is a rebrand for the previous imprint) has 11 placing books in the Top 750, led by Sweet Valley Twins: Best Friends (#14 for PRH overall, 38k in sales). Following that is v1 of Katie the Catsitter by Colleen Venable (#19, 27k) – v2 sells 24k. And rounding out the top 20 for PRH is v8 of Judd Winick’s Hilo (#20, 26k). Other successful books in the Top 750 for RHG are Pizza & Taco (four volumes), v1 of Witches of Brooklyn, Five Worlds v5 and Housecat Trouble.
New this year is the imprint called Random House Worlds, which just has one series placing: Lore Olympus by Rachel Smythe, which is natively a webcomic. Interestingly, the hardcover versions sell the best – and strangely v2 is the most successful (#2, 108k), then v1 (#4, 78k), then v3 (#5, 77k). This is immediately followed by the softcover versions, which follow in the much more typical pattern of v1 (#8, 67k), v2 (#9, 54k) and v3 (#19, 28k). This, combined with Hooky from HarperCollins below would appear to clearly show an enormous potential audience for print-editions of successful (free!) webcomics. This is a giant development that shouldn’t be understated, though we will see how sustainable it is over the next few years, as more titles come to print. That this appears to be the opposite result of comics that were sold digital first is the most interesting part of this result, if you ask me?
Razorbill places a single book in the Top 750: about 20k of Paws: Gabby Gets it Together by Nathan Fairbairn.
Triangle Square also places a single book: around 18k of Sex is a Funny Word by Cory Silverberg.
And finally, Tundra has six placing volumes of Ben Clanton’s “Narwahl: Unicorn of the Sea” series. Volume 6, Narwhal’s School of Awesomeness (#12 for PRH overall, 43k sold) leads the pack, followed by v1 (#15, 37k), v4 (#16, 34k) and v7 (#17, 29k). The other two aren’t in PRH’s top 20, but v3 sells 15k, and v2 sells 13k. The “hammock” rules don’t seem to apply to this series!
Penguin Random House formed out of a merger in 2013 – prior to that they were separate publishers Penguin and Random House. Here’s what the Long-Tail for the combined Penguin Random House looked like in 2022:
| Year | # of listed items | % Change | Total Pieces | % Change | Calculated Retail Value | % Change | Av. Sale per title | Av $ per title |
| 2013 | 282 | ——- | 447,174 | ——- | $7,259,364 | ——- | 1,586 | $25,742 |
| 2014 | 252 | -10.64% | 428,634 | -4.15% | $7,415,712 | 2.15% | 1,701 | $29,427 |
| 2015* | 450 | 78.57% | 513,611 | 19.83% | $8,517,761 | 14.49% | 1,141 | $18,928 |
| 2016* | 293 | -34.88% | 435,877 | -15.13% | $7,150,087 | -16.06% | 1,488 | $24,403 |
| 2017 | 409 | 39.59% | 664,858 | 52.53% | $10,136,224 | 41.76% | 1,626 | $24,783 |
| 2018 | 613 | 49.88% | 760,314 | 14.36% | $11,136,058 | 9.86% | 1,240 | $18.166 |
| 2019 | 635 | 3.59% | 1,013,092 | 33.25% | $15,745,448 | 41.39% | 1,595 | $24,796 |
| 2020 | 551 | -13.23% | 1,380,328 | 36.25% | $21,157,243 | 34.37% | 551 | $38,398 |
| 2021 | 809 | 46.82% | 1,901,467 | 37.75% | $30,131,057 | 42.41% | 2,350 | $37,245 |
| 2022 | 760 | -6.06% | 2,330,883 | 22.58% | $41,906,282 | 39.08% | 3,067 | $55,141 |
However, I’m not willing to pull an “We’ve always been at war with Eurasia” moment, so let’s look at the individual pieces of the past. This is what Penguin Putnam (Ace, Berkley Books, Dial, Dutton, Gotham Books, Grossett & Dunlap, Hudson Street, InkLit, New American Library, Penguin, Philomel, Plume, Price Stern Sloan, Puffin, Putnam, Razorbill, Riverhead and Viking) used to look like alone)
| Year | # of listed items | % Change | Total Pieces | % Change | Calculated Retail Value | % Change | Av. Sale per title | Av $ per title |
| 2007 | 18 | —— | 13,545 | —— | $178,260 | —— | 753 | $9,903 |
| 2008 | 28 | 55.56% | 28,606 | 111.19% | $310,856 | 74.38% | 1022 | $11,102 |
| 2009 | 39 | 39.29% | 40,288 | 40.84% | $444,928 | 43.13% | 1033 | $11,408 |
| 2010 | 45 | 15.38% | 50,628 | 25.67% | $623,650 | 40.17% | 1125 | $13,859 |
| 2011 | 53 | 17.78% | 123,749 | 144.43% | $1,576,161 | 152.73% | 2335 | $29,739 |
| 2012 | 60 | 13.21% | 121,769 | -1.60% | $1,499,660 | -4.85% | 2029 | $24,994 |
This is what Random House (Alfred A. Knopf, Ballantine, Bantam, Broadway, Crown, Del Rey, Doubleday, Pantheon, Random House, Schocken, and Three Rivers) looked like alone:
| Year | # of listed items | % Change | Total Pieces | % Change | Calculated Retail value | % Change | Av. Sale per title | Av $ per title |
| 2007 | 74 | — | 216,580 | — | $2,890,347 | — | 2,927 | $39,059 |
| 2008 | 77 | 5.47% | 383,105 | 76.89% | $5,698,922 | 97.17% | 4,975 | $74,012 |
| 2009 | 109 | 41.56% | 405,598 | 5.87% | $5,398,890 | -5.26% | 3,721 | $49,531 |
| 2010 | 132 | 21.10% | 389,410 | -3.99% | $5,831,814 | 8.02% | 2,950 | $44,180 |
| 2011 | 144 | 9.09% | 397,143 | 1.99% | $6,356,212 | 8.99% | 2,760 | $44,140 |
| 2012 | 185 | 28.47% | 375,254 | -5.51% | $7,124,794 | 12.09% | 2,028 | $38,512 |
Penguin Random House has two titles over 100k, another three books over 75k, four more titles over 50k, 14 additional books over 20k, and another 19 books over 10k.
Dropping down a step is the now #3 largest publisher with Western comics in NPD BookScan Top 750 in 2022: HarperCollins. Worth remembering is that HarperCollins completed the purchase of Houghton Mifflin Harcourt in 2021 – HMH was the 11th largest Top 750 NPD BookScan publisher in 2020, if you will recall. Harper places 43 books into the Top 750 for a total of 1.3 million copies sold, and a calculated retail cover price of $19.7 million. There’s a lot of imprints with the word “Harper” in the title in the Long Tail (Harper, Harper Paperbacks, Harper Teen, Harper Festival, Harper Teen, and so on), and Harper is also Blazer & Bray, Clarion/Etch, Katherine Tegan, Mariner, Quill Tree and William Morrow (in the Top 750); as well as Amistad, Dey Street, Ecco, Fourth Estate, Friday Project, Greenwillow, Harvest, Houghton Mifflin Harcourt, Joanna Cotler, IT books, Thomas Nelson, Versify, William Collins and Zondervan (out of the Top 750)
In alphabetical-by-imprint order:
At Balzer & Bray they place seven titles into the Top 750, and it continues to be mostly all about Terri Libenson. Remarkably Ruby is her newest book (it appears to be the sixth book in the series, though HC doesn’t refer to this in titling or metadata) and is the #4 overall best-seller for HarperCollins. It sells nearly 67k, a very strong result. Truly Tyler (#14, 28k) comes next, followed by four other volumes in the series that sell between 11k-18k. Also placing in the Top 750 for this imprint is Almost American Girl, which sells about 16k copies.
Clarion/Etch was a formerly Houghton Mifflin Harcourt middle-grade imprint that is new to the Harper family. Clarion places eleven titles within the Top 750, led by the success of the web-first Hooky by Miriam Bonastre Tur – v1 (#3 overall for HarperCollins) leads with almost 95k copies, while v2 (#6) comes in at 53k sold. This is followed by the success of Kayla Miller, first with Camp (#7, 49k), then Crunch (#8, 44k), Clash (#10, 36k), Besties (#13, 30k), as well as three other books from her which sell between 13k-20k. Clarion also places Crumbs by Danie Stirling (19k) and The Crossover by Kwame Alexander (18k).
At the various Harper-named imprints, they have 13 titles within the overall NPD BookScan Top 750. Their biggest hit is from gaming stars from YouTube. FGTeev’s The Switcheroo Rescue! is #1 for HarperCollins, with almost 150k sold. This is followed by Into The Game! (#5, 64k), Saves The World! in hardcover (#11, 34k) and paperback (#12, 31k), and even Game Break! sells 13k copies. Other big successes are Johnnie Christmas’ Swim Team (#16, 26k), Erin Hunter’s Warriors: Winds of Change (#17, 26k) – Exile from Shadowclan also sells 24k – as well as Alicia Keys’ Girl on Fire (#19, 25k), and Lily Lamotte’s Measuring Up (#20, 24k)
Katherine Tegan’s best-seller in 2022 is The First Cat In Space Ate Pizza (#18 for Harper overall), which sells 26k copies.
Mariner was also a former HMH imprint, and has two in the Top 750: Alison Bechdel’s Fun Home at 19k sold, and an adaptation of George Orwell’s 1984 with a bit under 15k sold.
The Quill Tree imprint places four books, including Harper’s #2 best-seller for the year: Jerry Craft’s New Kid with 95k sold, while at #9 is Craft’s Class Act (37k). And down towards the bottom of the Top 750 is Nate Stevenson’s perennial Nimona, with almost 14k sold.
Finally, the William Morrow imprint is in the Top 750 overall, but not a Top Twenty book for Harper – they sell 11k of the forever perennial Understanding Comics by Scott McCloud.
Here is the Long Tail for Harper, now with HMH included only for this year:
| Year | # of listed items | Percent Change | Total Unit Sold | Percent Change | Calculated Retail value | Percent Change | Av. Sale per title | Av $ per title |
| 2007 | 18 | —— | 36,940 | —— | $600,540 | —– | 2052 | $33,363 |
| 2008 | 36 | 100.00% | 48,264 | 30.66% | $863,808 | 43.84% | 1341 | $23,995 |
| 2009 | 42 | 16.67% | 81,774 | 69.43% | $1,308,891 | 15.53% | 1947 | $31,164 |
| 2010 | 41 | -2.38% | 64,429 | -21.21% | $719,328 | -45.04% | 1571 | $17,545 |
| 2011 | 50 | 21.95% | 75,394 | 17.02% | $1,083,609 | 50.64% | 1508 | $21,672 |
| 2012 | 80 | 60.00% | 159,573 | 111.65% | $2,113,744 | 95.07% | 1995 | $26,422 |
| 2013 | 68 | –15.00% | 197,595 | 23.83% | $2,667,933 | 26.22% | 2906 | $39,234 |
| 2014 | 115 | 69.12% | 158,193 | -19.94% | $2,398,836 | -10.09% | 1376 | $21,042 |
| 2015* | 109 | -5.22% | 188,181 | 18.96% | $2,646,378 | 10.32% | 1726 | $24,279 |
| 2016* | 108 | -0.09% | 261,183 | 38.79% | $4,473,589 | 69.05% | 2418 | $41,422 |
| 2017 | 107 | -0.09% | 357,972 | 37.06% | $5,530,994 | 23.64% | 3346 | $51,692 |
| 2018 | 148 | 38.32% | 517,800 | 44.65% | $7,506,751 | 35.72% | 3499 | $50,721 |
| 2019 | 154 | 4.05% | 891,701 | 72.21% | $13,894,052 | 85.09% | 5790 | $90,221 |
| 2020 | 220 | 42.86% | 1,219,785 | 36.79% | $19,396,157 | 39.60% | 5544 | $88,164 |
| 2021 | 403 | 83.18% | 1,668,202 | 36.76% | $26,028,053 | 34.19% | 4139 | $64,586 |
| 2022 | 522 | 29.53% | 1,852,589 | 11.05% | $28,095,121 | 7.94% | 3549 | $53,822 |
HarperCollins has one book over 100k, another five over 50k, a further 16 books over 20k, and another 23 more over 10k.
Just for the historical record to remain intact, here is what Houghton Mifflin Harcourt used to sell before HarperCollins bought them in 2021; these numbers are not included in the above chart:
| Year | # of listed items | Percent Change | Total Unit Sold | Percent Change | Calculated Retail value | Percent Change | Av. Sale per title | Av $ per title |
| 2007 | 4 | —— | 20,474 | —— | $434,495 | —— | 5119 | $108,624 |
| 2008 | 6 | 50.00% | 14,183 | -30.73% | $307,019 | -29.34% | 2363 | $51,170 |
| 2009 | 14 | 233.33% | 24,568 | 73.22% | $436,328 | 42.12% | 1755 | $31,166 |
| 2010 | 17 | 21.43% | 29,163 | 18.70% | $532,539 | 22.05% | 1715 | $31,326 |
| 2011 | 18 | 5.88% | 24,239 | -16.88% | $450,536 | -15.40% | 1347 | $25,030 |
| 2012 | 21 | 16.67% | 23,562 | -2.79% | $402,575 | -10.65% | 1122 | $1,9170 |
| 2013 | 29 | 38.10% | 44,558 | 89.11% | $687,920 | 70.88% | 1536 | $23,721 |
| 2014 | 27 | -6.90% | 32,751 | -26.50% | $552,884 | -19.63% | 1213 | $20,477 |
| 2015* | 33 | 22.22% | 78,357 | 239.25% | $1,214,786 | 219.72% | 2374 | $36,812 |
| 2016* | 38 | 15.15% | 60,359 | -22.97% | $943,188 | 22.36% | 1588 | $24,821 |
| 2017 | 27 | -28.95% | 42,963 | -28.82% | $710,481 | -24.67% | 1591 | $26,314 |
| 2018 | 60 | 222.22% | 41,596 | -3.18% | $701,891 | -1.21% | 693 | $11,698 |
| 2019 | 59 | -1.67% | 192,157 | 361.96% | $2,909,580 | 314.53% | 3257 | $49,315 |
| 2020 | 75 | 27.12% | 253,602 | 31.98% | $3,611,395 | 24.12% | 3381 | $48,152 |
Coming in at #4 is Holtzbrinck, which owns Macmillan, another of the “big five”, and is also one of those publishers with lots and lots (and lots) of imprints, although only FirstSecond and Roaring Brook place within the NPD BookScan Top 750 – I have also identified Farrar, Straus and Giroux, Feiwel & Friends, Griffin, Henry Holt, Hill + Wang, Imprint, Metropolitan, Picador, Rodale Press, Square Fish, St. Martins Griffin, Times books, and Tor. Holtzbrinck also distributes several other publishers they don’t own (including Bloomsbury, Drawn & Quarterly, Papercutz, and Seven Seas) Holtzbrinck-owned companies placed sixteen titles in the Top 750, for about 633k copies sold and about a calculated $8.2m gross combined.
FirstSecond is their most successful imprint, and their biggest hit is John Patrick Green’s Investigators where Braver and Boulder (this is v5, though there is no metadata indication of the same) is #1 for Holtzbrinck with 91k sold. This is followed by Heist and Seek (v6, #2, 67k), Ants in our P.A.N.T.S. (v4, #4, 56k), the self-titled first volume (#6, 50k), Off The Hook (v3, #7, 44k), and Take The Plunge (v2, #8, 42k) – I guess you can’t have a hammock if you don’t number the books! They also do great with Shannon Hale’s “Friends” trilogy: v3, Friends Forever is #3 with 61k sold, while v2 Best Friends is #10 with 28k. Real Friends (the first book), does a comparatively low 24k. And Holtzbrink’s Top Ten is rounded out by Gene Luen Yang’s perennial American Born Chinese (#9, 37k). FirstSecond also sells a solid 21k with Kevin Panetta’s Bloom.
Roaring Brook cracks the Top Ten with Nick Bruel’s Bad Kitty Gets a Phone (#5, and 52k); while Leigh Bardugo’s Demon in the Woods sells 25k.
Here’s Holtzbrinck’s Long Tail
| Year | # of listed items | Percent Change | Total Unit Sold | Percent Change | Calculated Retail value | Percent Change | Av. Sale per title | Av $ per title |
| 2007 | 39 | —— | 31,452 | —— | $559,681 | —– | 806 | $14,351 |
| 2008 | 66 | 69.23% | 63,473 | 101.81% | $1,132,767 | 102.40% | 962 | $17,163 |
| 2009 | 88 | 33.34% | 84,090 | 32.48% | $1,438,044 | 26.95% | 956 | $16,341 |
| 2010 | 108 | 22.73% | 68,599 | -18.42% | $1,085,311 | -24.53% | 635 | $10,049 |
| 2011 | 139 | 28.70% | 114,243 | 66.54% | $1,794,084 | 65.31% | 822 | $12,907 |
| 2012 | 165 | 18.71% | 126,745 | 10.94% | $2,077,143 | 15.78% | 768 | $12,589 |
| 2013 | 187 | 13.33% | 142,375 | 12.33% | $2,395,569 | 15.33% | 761 | $12,811 |
| 2014 | 222 | 18.72% | 190,682 | 33.93% | $3,096,858 | 23.27% | 859 | $13,950 |
| 2015* | 104 | -53.15% | 99,223 | -47.96% | $1,804,001 | -41.75% | 954 | $17,346 |
| 2016* | 272 | 161.54% | 272,668 | 174.80% | $4,240,075 | 135.04% | 1,002 | $15,589 |
| 2017 | 336 | 23.53% | 437,258 | 60.36% | $6,616,130 | 56.04% | 1,301 | $19,691 |
| 2018 | 427 | 27.08% | 723,096 | 65.37% | $11,701,046 | 76.86% | 1,693 | $27,403 |
| 2019 | 494 | 15.70% | 946,680 | 30.92% | $15,814,819 | 35.16% | 1,916 | $32,014 |
| 2020 | 552 | 11.74% | 1,022,598 | 8.02% | $16,455,419 | 4.05% | 1,853 | $29,811 |
| 2021 | 602 | 9.06% | 1,214,283 | 18.74% | $18,989,371 | 15.40% | 2,017 | $31,544 |
| 2022 | 683 | 13.46% | 1,203,338 | -0.01% | $18,701,422 | -1.52% | 1,762 | $27,381 |
Holtzbrinck has five books over 50k, eight more over 20k, and six others over 10k.
Next in the Top 750 at #5 publisher is Andrews McMeel. Andrews is a publisher that often has frustrated me by how they’ve been represented by NPD BookScan – as I noted, it used to be that “humor” books like “Far Side” and “Calvin & Hobbes” used to rule the NPD BookScan charts. Until, one day, poof! Almost of those books disappeared entirely from the dataset I was given, throwing off a whole lot of my comparables. And, for the most part, comic strip reprints have stayed out of these charts for half a decade. But, they’ve started creeping back into the listings for the last few years. I’m actually fine with comic strips and comic books co-existing in the same places – at least they’re both comics – but the inconsistency just drives me nucking futz.
I found twenty-six titles from Andrews in the Top 750 in 2022, for 524k copies and $9.7 million in calculated dollars, but clearly that number would scale up to some large degree if it listed all of the strip collections they publish. What’s interesting about Andrews McMeel is that, for the most part, their “graphic novels” are reformatted/repackaged newspaper strips. In other words, this is basically another paid-for way one can serialize work: through syndicated newspaper pages.
2022’s top book for Andrew’s McMeel is Lincoln Peirce’s Big Nate, where v26 (Beware of Low-Flying Corn Muffins) is their #1 book, selling 55k. Big Nate is also #3 (v27, Release the Hounds!, 31k), #5 (The “Top Dog” 2-in-1 omnibus, 29k), and #6 (v25, “Aloha”, 29k), as well as #12, #17, and #20 (and #24), though we’re under 20k at that point.
Then Dana Simpson’s Phoebe and Her Unicorn starts placing – the self-titled v1 (#2) sells 36k, while v14 (Unicorn Playlist) is #9 with 19k, and there are also volumes placing at #13, #19, and #24
After that, the rest of their Top Ten includes Gina Loveless’ Animal Rescue Friends (#4, 30k), Bill Watterson’s softcover of the Complete Calvin and Hobbes (#7, 24k), Matthew Cody’s Cat Ninja (#8, 23k) and Catana Chetwynd’s You Are Home (#10, 19k).
Andrews McMeel’s Long Tail chart is for sure my most frustrating one because they publish a whole lot of comics (humor strips, like “Calvin & Hobbes”) where the BISAC changed to something we’re having a hard time properly getting – so almost certainly they’re doing several times better than this chart would suggest because of those books. Further, things appear and disappear in a way I’ve never been able to make sense of – it might be them changing BISACs after the fact. Most of my comparatives are terrible and counterproductive here, and I really apologize for the crappiness of my data in this specific instance.
| Year | # of listed items | Percent Change | Total Unit Sold | Percent Change | Calculated Retail Value | Percent Change | Av. Sale per title | Av $ per title |
| 2007 | 22 | —— | 29,835 | —— | $461,238 | —– | 1,356 | $20,965 |
| 2008 | 20 | -9.09% | 25,115 | -15.82% | $388,965 | -15.67% | 1,256 | $19,448 |
| 2009 | 21 | 5.00% | 26,205 | 4.34% | $401,982 | 3.35% | 1,248 | $19,142 |
| 2010 | 19 | -9.52% | 47,181 | 80.05% | $544,852 | 35.54% | 2,483 | $28,676 |
| 2011 | 17 | -10.53% | 116,850 | 147.66% | $1,222,171 | 124.31% | 6,874 | $71,892 |
| 2012 | 31 | 82.53% | 225,546 | 93.02% | $2,737,935 | 124.02% | 7,276 | $88,320 |
| 2013 | 43 | 38.71% | 343,681 | 52.38% | $3,747,799 | 36.88% | 7,993 | $87,158 |
| 2014 | 59 | 37.21% | 373,713 | 8.74% | $4,387,252 | 17.06% | 6,334 | $74,360 |
| 2015* | 76 | 28.81% | 502,061 | 34.34% | $5,950,368 | 35.63% | 6,606 | $78,294 |
| 2016* | 85 | 11.84% | 472,145 | -5.96% | $5,147,673 | -13.49% | 5,555 | $60,561 |
| 2017 | 140 | 64.71% | 520,554 | 10.25% | $5,644,031 | 9.64% | 3,718 | $40,315 |
| 2018 | 273 | 95.00% | 735,184 | 41.23% | $11,862,349 | 210.18% | 2,693 | $43,452 |
| 2019 | 277 | 1.46% | 611,784 | -16.79% | $11,078,977 | -6.60% | 2,209 | $39,996 |
| 2020 | 288 | 3.97% | 644,390 | 5.33% | $13,539,999 | 22.21% | 2,237 | $47,014 |
| 2021 | 359 | 24.65 | 929,267 | 44.21% | $20,557,874 | 51.83% | 2,588 | $57,264 |
| 2022 | 374 | 4.18% | 913,185 | -1.73% | $17,581,342 | -14.48% | 2,442 | $47,009 |
Andrews McMeel has one book over 50k, seven more over 20k, and 19 others over 10k.
Still at the #6 publisher in the Top 750 is DC Entertainment. DC spent a really long time as the #1 Western publisher before losing it to Scholastic, and was at least #2 until 2018. If there was a traditional Direct Market publisher that already had all of the tools they needed to compete in the book market (at least, before AT&T Discovery started laying people off) it was DC, but modern DC can’t get above sixth place, so it seems obvious to me that the brain drain from their cost-cutting layoffs has done them dramatically more harm than good.
In 2022 they placed just 20 titles in the Top 750 – about half of a mere two years ago – for 397k units, and almost $9 million in calculated retail price.
DC has three charting imprints in the Top 750: plain “DC Comics”, DC Ink and Vertigo. Down in the long tail we can still track America’s Best Comics, Black Label, CMX, Jinxworld, Paradox, Mad, Minx, Wildstorm, Zoom and Zuda – makes you wonder how stores still have those handful of copies to sell of imprints that in some cases have been defunct for two decades now! But a certain amount of this should be wholly in DC’s control as they control their metadata. It’s just weird that Teen Titans: Raven has “DC INK” listed as publisher, and Teen Titans: Beast Boy and …Beast Boy Loves Raven show as “DC COMICS”; or that earlier printings of Sandman reads as “Vertigo” when that’s not an imprint of DC’s any longer, and so on.
Here’s a year-to-year comparison chart of the Top 750 for DC (Because I started from my first NPD BookScan survey with a complete Direct Market bias, but I hate throwing away charts, especially ones with twenty years of provenance):
| Year | # of placing titles | Unit sales | Calculated Retail price |
| 2003 | 74 | 336,569 | $6,151,258 |
| 2004 | 39 | 179,440 | $3,135,983 |
| 2005 | 42 | 298,484 | $5,440,001 |
| 2006 | 59 | 551,160 | $10,246,082 |
| 2007 | 58 | 487,467 | $9,953,976 |
| 2008 | 71 | 1,015,864 | $19,805,098 |
| 2009 | 93 | 1,223,733 | $24,061,834 |
| 2010 | 96 | 648,403 | $12,523,128 |
| 2011 | 107 | 660,706 | $13,083,378 |
| 2012 | 104 | 688,870 | $14,811,979 |
| 2013 | 130 | 767,686 | $15,620,981 |
| 2014 | 131 | 931,239 | $19,207,755 |
| 2015* | 119 | 1,074,304 | $21,701,088 |
| 2016* | 117 | 1,234,047 | $23,203,071 |
| 2017 | 101 | 827,544 | $15,234,525 |
| 2018 | 47 | 360,414 | $7,810,753 |
| 2019 | 33 | 413,923 | $9,691,574 |
| 2020 | 29 | 442,163 | $10,332,226 |
| 2021 | 17 | 396,475 | $8,335,338 |
| 2022 | 20 | 396,743 | $8,986,139 |
2022 is a very very modestly better performance for DC in the Top 750
DC’s #1 book via NPD BookScan reporters in 2022 is Neil Gaiman’s Sandman – certainly driven by the Netflix TV adaptation. At the same time, DC released softcovers of the four former “Absolute” versions of the book, which are in issue-release order (rather than “storyline” order like the previous ten paperbacks). As a bookseller, I’m pretty certain that moving to four $40 volumes, as opposed to ten $20 volumes a) depressed the maximum size of the audience (since far fewer people will “jump in” at the more expensive initial price point) and 2) cost them money in absolute terms ($80 vs $200 for the entire story), but I guess that’s why I just sell comics for a living. But, looking at it in a vacuum, Sandman is a hit, the new “Book” formats are #1 (Book One, 59k), #5 (Book Two, 24k), and #13 (14k), while the old v1 format of “Preludes & Nocturnes” is #9 (18k). Book Four doesn’t hit the top 750, but is #21 for DC with under 11k sold.
This is followed by eight “Batman” comics – Year One by Frank Miller and David Mazzuchelli is #2 (33k), Batman/Fortnite is #6 (20k), Long Halloween by Jeph Loeb & Tim Sale is #7 (19k), Killing Joke by Alan Moore and Brian Bolland is #10 (17k), while Scott Snyder & Jock’s The Batman Who Laughs is #12 (14k), Hush by Loeb & Jim Lee is #14 (14k), Miller’s Dark Knight Returns is #17 (13k), and Snyder & Greg Capullo’s Court of Owls is #19 (12k). These numbers are not really meaningfully much different than last year’s spread of 11k-28k, which actually seems pretty surprising to me given the huge success of the newest Batman movie that came out in 2022. Especially for Year One, which was explicitly mentioned by crew as an inspiration for this film. I find it pretty shocking that we aren’t seeing 50k+ sales in the civilian-driven market represented by BookScan.
Most of the rest of DC’s Top 750 is made up of Young Adult and Middle Reader positioned versions of DC’s character, which I think normally we could point to (especially in contrast with Marvel) as a company changing with the times, but despite their relative success compared to other DC comics, they’re still pretty low when you compare it to other YA and Middle Readers books from other publishers, with DC’s best is Kami Garcia and Gabriel Picolo’s Teen Titans: Beast Boy Loves Raven (#3) and is just under 30k. The other two books in this series also chart, Teen Titans: Beast Boy at #8 (18k), and Teen Titans: Raven at #16 (13k). On the middle reader side, DC’s best seller is the original superhero Primer by Jennifer Muro, Thomas Krajewski and Gretel Lusky at #11 (14k) which was released in 2020, and has charted every year since then, so it appears showing some really meaningful legs! Where’s volume 2? Also of note is Shannon Hale and Asiah Fulmore’s Amethyst: Princess of Gemworld (#15, 13k), and Gene Yang and Gurihiru’s Superman Smashes the Klan (#18, 12k)
I started the previous paragraph with “most of the rest”, but there are two exceptions that come down straight to Alan Moore: Watchmen with Dave Gibbons (#4, 29k), and V For Vendetta with David Lloyd (#20, 12k). Any books that can sell 10k+ year after year after year with near-zero promotion or effort by the publisher, for multiple decades, should be celebrated.
Here’s DC’s Long Tail – and it isn’t a great year-over-year performance for them
| Year | # of listed items | % Change | Total Pieces | % Change | Calculated Retail Value | % Change | Av. Sale per title | Av $ per title |
| 2007 | 1644 | — | 1,181,218 | — | $22,033,212 | — | 719 | $13,402 |
| 2008 | 2057 | 25.12% | 1,719,330 | 45.56% | $33,609,704 | 52.54% | 836 | $16,339 |
| 2009 | 2264 | 10.06% | 1,902,181 | 10.64% | $37,816,864 | 12.52% | 840 | $16,704 |
| 2010 | 2442 | 7.86% | 1,320,262 | -30.59% | $25,982,910 | -31.29% | 541 | $10,640 |
| 2011 | 2423 | -0.07% | 1,323,630 | 0.26% | $27,130,811 | 4.42% | 546 | $11,197 |
| 2012 | 2452 | 1.20% | 1,206,198 | -8.87% | $26,729,997 | -1.48% | 492 | $10,901 |
| 2013 | 2551 | 4.04% | 1,369,850 | 13.57% | $29,881,153 | 11.79% | 537 | $11,714 |
| 2014 | 2746 | 7.64% | 1,638,901 | 19.64% | $35,388,570 | 18.43% | 597 | $12,887 |
| 2015* | 1690 | -38.46% | 1,997,577 | 21.89% | $43,031,546 | 21.60% | 1182 | $25,462 |
| 2016* | 1214 | -28.17% | 2,262,888 | 13.82% | $47,963,215 | 11.46% | 1864 | $39,508 |
| 2017 | 3152 | 259.64% | 1,948,037 | -13.91% | $42,921,514 | -10.51% | 618 | $13,617 |
| 2018 | 3364 | 6.73% | 1,333,836 | -31.53% | $31,844,186 | -25.81% | 397 | $9,466 |
| 2019 | 3229 | -4.01% | 1,303,807 | -2.25% | $33,428,626 | 4.98% | 404 | $10,353 |
| 2020 | 3668 | 13.59% | 1,338,405 | 2.65% | $36,315,104 | 8.63% | 365 | $9,901 |
| 2021 | 3905 | 3.46% | 1,694,306 | 26.59% | $49,650,333 | 36.72% | 434 | $12,715 |
| 2022 | 3985 | 0.20% | 1,466,165 | -13.47% | $43,450,832 | -12.49% | 368 | $10,904 |
DC has one book over 50k, five over 20k, and fifteen more that come in over 10k.
With a big move forward this year, IDW Publishing zooms up from #10 to become the #7 Western publisher in the BookScan 2022 Top 750, placing seven books for a total of 221k sold (up from 134k last year), and a bit over $4.5m in calculated dollars. The vast majority of this growth comes down to TMNT: The Last Ronin HC, but any “W” is a “W”. Further, for the third year in a row, they beat out both Image and Marvel in the Top 750. IDW has a lot of imprints, including Artist Editions, Black Crown, Library of American Comics, Top Shelf, Yoe Books, and, of course, IDW itself.
As implied above, their best-seller is “TMNT: The Last Ronin” (#1), which sells 66k in its debut, while they also sell a good amount of “Sonic The Hedgehog” comics – most likely on the back of the movie. V1, “Fallout” is #4 best-seller for IDW this year, with 22k, “Sonic & Tails: Best Buds Forever” is #5 (21k), the “30th Anniversary Celebration” is #6 with 15k, while v2, “The Fate of Dr. Eggman” is #7 with 11k.
Here is IDW’s Long Tail for 2022 – back to double digit growth!
| Year | # of listed items | Percent Change | Total Unit Sold | Percent Change | Calculated Retail value | Percent Change | Av. Sale per title | Av $ per title |
| 2007 | 233 | —— | 102,118 | —— | $2,090,647 | —– | 438 | $8,973 |
| 2008 | 335 | 43.78% | 146,125 | 43.09% | $2,766,505 | 32.33% | 436 | $8,258 |
| 2009 | 477 | 42.39% | 215,907 | 47.76% | $4,346,836 | 57.12% | 453 | $9,113 |
| 2010 | 623 | 30.61% | 161,578 | -25.16% | $3,653,680 | -15.95% | 259 | $5,865 |
| 2011 | 785 | 26.00% | 206,136 | 27.58% | $4,884,606 | 33.69% | 263 | $6,222 |
| 2012 | 937 | 19.36% | 162,599 | -21.12% | $4,329,973 | -11.35% | 174 | $4,621 |
| 2013 | 1059 | 13.02% | 180,694 | 11.13% | $4,443,372 | 2.62% | 171 | $4,196 |
| 2014 | 1134 | 7.08% | 228,895 | 26.68% | $5,309,992 | 19.50% | 200 | $4,641 |
| 2015* | 959 | -15.43% | 310,512 | 35.66% | $6,478,023 | 22.00% | 324 | $6,755 |
| 2016* | 978 | 1.98% | 343,197 | 10.53% | $8,194,098 | 26.49% | 351 | $8,378 |
| 2017 | 1639 | 67.59% | 346,368 | 0.92% | $8,278,617 | 1.03% | 211 | $5,051 |
| 2018 | 1811 | 10.05% | 279,435 | -19.32% | $6,525,696 | -21.17% | 154 | $3,603 |
| 2019 | 1817 | 0.33% | 330,051 | 18.11% | $7,443,310 | 14.06% | 182 | $4,096 |
| 2020 | 1906 | 4.90% | 527,405 | 59.80% | $12,365,146 | 66.12% | 277 | $6,487 |
| 2021 | 1979 | 3.83% | 512,757 | -2.78% | $12,723,523 | 2.90% | 259 | $6,429 |
| 2022 | 1898 | -4.09% | 567,910 | 10.76% | $14,192,263 | 11.54% | 299 | $7,477 |
IDW has two books over 50k, three more over 20k, and another three over 10k.
Also with a forward move this year, #8 of the Western Publishers in the Top 750 is another of the “Big Five”: Hachette, which includes the imprints of Jimmy Patterson, JY, and Little Brown in the Top 750, as well as Back Bay, Basic Books, Black Dog & Leventhal, Bold Type, Da Capo, Grand Central, Hodder, Nation Books, Orchard, Orion, Running Press, Trapeze, Voracious and Warner Books in the Long Tail. In the Top 750 they place ten books, selling 176k copies and $2.2m. They also publish manga as Yen which is up above in the previous section.
Little, Brown is their most successful imprint, and it places seven of those ten titles into the Top 750. The biggest hit is at #1, and is a “modern graphic retelling” of a prose novel: “The Secret Garden on 81st St.” (retelling “The Secret Garden”) with nearly 31k sold, while at #2 is “Anne of West Philly” (“Anne of Green Gables”) with 26k sold, and at #5 is “Meg, Jo, Beth and Amy” (“Little Women”) with 14k sold. The imprint also does well with “Catstronauts: Mission Moon” by Drew Brockington (#6, 14k), “Just Pretend” (#7, 12k) by Tori Sharp, “Baloney and Friends” (#8, 12k) by Greg Pizzoli, and “Consent (For Kids!): Boundaries, Respect and Being in Charge of You” (#9, 11k) by Rachel Brian.
The JY imprint is home to Svetlana Chmakova’s Enemies (#3 with 25k sold) and Awkward (#4) which sells 18k.
Jimmy Patterson is a kid’s book imprint for James Patterson (go figure), and they place Jacky Ha-Ha: My Life is a Joke (#10) sells a bit more than 11k.
None of their other imprints manage to score any titles at 10k or over.
Here’s the Long Tail of just the Western books for Hachette.
| Year | # of listed items | Percent Change | Total Unit Sold | Percent Change | Calculated Retail value | Percent Change | Av. Sale per title | Av $ per title |
| 2007 | 15 | —— | 39,181 | —— | $689,383 | —— | 2,612 | $45,959 |
| 2008 | 18 | 20.00% | 37,519 | -4.24% | $596,609 | -13.46% | 2,084 | $33,145 |
| 2009 | 18 | —— | 40,172 | 7.07% | $642,935 | 7.76% | 2,232 | $35,719 |
| 2010 | 19 | 5.56% | 160,992 | 300.76% | $3,097,996 | 381.85% | 8,473 | $163,052 |
| 2011 | 24 | 26.32% | 88,131 | -45.26% | $1,273,500 | -58.89% | 3,672 | $53,063 |
| 2012 | 28 | 16.67% | 110,897 | 25.83% | $1,565,744 | 22.95% | 3,961 | $55,919 |
| 2013 | 24 | -14.29% | 39,093 | -65.75% | $584,783 | -62.65% | 1,629 | $24,366 |
| 2014 | 32 | 33.33% | 38,853 | -0.61% | $593,667 | 1.52% | 1,214 | $18,552 |
| 2015* | 30 | -0.63% | 61,539 | 58.39% | $830,047 | 39.82% | 2,051 | $27,668 |
| 2016* | 56 | 86.67% | 81,648 | 32.68% | $1,654,511 | 99.33% | 1,458 | $29,545 |
| 2017 | 78 | 39.29% | 220,591 | 170.17% | $2,998,501 | 81.23% | 2,828 | $38,442 |
| 2018 | 203 | 260.26% | 363,575 | 64.82% | $4,541,954 | 51.47% | 1,791 | $22,374 |
| 2019 | 152 | -25.12% | 356,334 | -1.99% | $4,469,594 | -1.59% | 2,344 | $29,405 |
| 2020 | 216 | 42.11% | 359,018 | 0.75% | $5,141,443 | 15.03% | 1,662 | $23,803 |
| 2021 | 261 | 20.83% | 382,223 | 6.46% | $5,411,286 | 5.25% | 1,464 | $20,733 |
| 2022 | 270 | 3.45% | 360,902 | -5.58% | $4,894,962 | -9.54% | 1,337 | $18,129 |
And if you add the Manga from Yen, the combined total looks a whole lot better, like this:
| Year | # of listed items | Percent Change | Total Unit Sold | Percent Change | Calculated Retail value | Percent Change | Av. Sale per title | Av $ per title |
| 2007 | 25 | —— | 52,077 | —— | $836,832 | —– | 2,083 | $33,473 |
| 2008 | 108 | 332.00% | 147,645 | 183.51% | $1,834,469 | 119.22% | 1,367 | $16,986 |
| 2009 | 229 | 112.04% | 371,134 | 151.37% | $4,340,048 | 132.78% | 1,621 | $18,952 |
| 2010 | 363 | 58.52% | 721,975 | 94.53% | $9,748,867 | 124.63% | 1,999 | $26,856 |
| 2011 | 484 | 33.33% | 852,256 | 18.05% | $11,227,466 | 15.17% | 1,761 | $23,197 |
| 2012 | 576 | 19.01% | 758,845 | -10.96% | $10,301,009 | -8.25% | 1,317 | $17,884 |
| 2013 | 678 | 17.71% | 731,473 | -3.61% | $10,300,204 | —– | 1,079 | $15,192 |
| 2014 | 808 | 19.17% | 720,988 | -1.43% | $10,579,169 | 2.71% | 892 | $13,093 |
| 2015* | 742 | -8.17% | 994,407 | 37.92% | $14,304,955 | 35.22% | 1,340 | $19,279 |
| 2016* | 849 | 14.42% | 1,153,656 | 16.01% | $17,174,718 | 20.06% | 1,359 | $20,229 |
| 2017 | 1481 | 74.44% | 1,199,553 | 3.98% | $16,865,176 | -1.80% | 810 | $11,388 |
| 2018 | 1940 | 30.99% | 1,253,803 | 4.52% | $17,593,705 | 4.32% | 646 | $9,069 |
| 2019 | 1998 | 2.99% | 1,240,930 | -1.03% | $17,477,769 | -0.66% | 621 | $8,748 |
| 2020 | 2226 | 11.41% | 1,449,020 | 16.77% | $20,939,201 | 19.80% | 651 | $9,407 |
| 2021 | 2408 | 8.18% | 3,400,677 | 134.69% | $49,107,307 | 134.52% | 1,412 | $20,393 |
| 2022 | 2567 | 6.60% | 3,585,248 | 5.43% | $52,808,456 | 7.54% | 1,397 | $20,572 |
Hachette has one title over 30k, two more titles over 20k, and seven others over 10k, on the Western charts.
Our #9 publisher for the NPD BookScan Top 750 this year, while not considered one of the book world’s “Big Five”, is Harry N. Abrams. They are not also considered a traditional Direct Market publisher, either. They publish as Abrams Comicarts, Harry N. Abrams, as well as Amulet Books. They distribute, but do not publish, U.K. publisher SelfMadeHero, and are distributed themselves by the aforementioned Hachette. Abrams places nine books that they publish, selling 139k copies for $2.4m in calculated dollars.
Abrams’ best-seller in 2022 is from the Amulet imprint: #1 is El Deafo by Cece Bell, selling 29k copies. Coming in for the imprint at #2 is Nathan Hale’s kid-oriented historical retellings, with “Cold War Correspondent” (22k), Hale’s “Treaties, Trenches, Mud, and Blood” is #4, with 13k sold, while “Blades of Freedom” is #7 with 12k sold, and “Raid of No Return” is #8, just about one hundred copies below that. Amulet also places “The Great Candy Caper” by Jojo Siwa at #6 with 12k sold.
Otherwise, listed as plain ol’ Harry N. Abrams is Alex Ross’ Fantastic Four: Full Circle at #3 with 16k sold – this is another example of “publishers that aren’t named ‘Marvel’ selling better than those who are”, while the second volume of the “Dune” Adaptation (“Muad’Dib”) comes in at #9, and 11k sold.
Here is your long-tail, with an adequate performance:
| Year | # of listed items | Percent Change | Total Unit Sold | Percent Change | Calculated Retail value | Percent Change | Av. Sale per title | Av $ per title |
| 2008 | 3 | —— | 10,031 | —— | $148,675 | —— | 3,344 | $49,558 |
| 2009 | 25 | 733.33% | 24,116 | 140.41% | $640,635 | 330.90% | 965 | $25,625 |
| 2010 | 41 | 64.00% | 48,240 | 100.03% | $1,109,444 | 73.18% | 1,177 | $27,060 |
| 2011 | 49 | 19.51% | 31,846 | -33.98% | $731,054 | -34.11% | 650 | $14,919 |
| 2012 | 62 | 26.53% | 37,522 | 17.82% | $756,650 | 3.50% | 605 | $12,204 |
| 2013 | 70 | 12.90% | 72,538 | 93.32% | $3,278,063 | 333.23% | 1,036 | $46,829 |
| 2014 | 88 | 25.71% | 74,083 | 2.13% | $2,324,820 | -29.10% | 842 | $26,418 |
| 2015* | 92 | 4.55% | 145,633 | 96.58% | $1,898,267 | -18.35% | 1,583 | $20,633 |
| 2016* | 112 | 21.74% | 177,127 | 21.63% | $2,326,956 | 22.58% | 1,581 | $20,776 |
| 2017 | 124 | 10.71% | 248,580 | 40.34% | $3,449,807 | 48.25% | 2,005 | $27,821 |
| 2018 | 138 | 11.29% | 258,334 | 3.92% | $3,776,138 | 9.46% | 1,872 | $27,363 |
| 2019 | 148 | 7.25% | 265,300 | 2.70% | $4,089,631 | 8.30% | 1,791 | $27,633 |
| 2020 | 152 | 2.70% | 306,087 | 15.37% | $4,891,229 | 19.60% | 2,014 | $32,179 |
| 2021 | 181 | 19.08% | 372,948 | 21.84% | $6,803,571 | 39.10% | 2,060 | $37,589 |
| 2022 | 212 | 17.13% | 336,512 | -9.77% | $6,279,071 | -7.71% | 1,587 | $29,618 |
Harry N. Abrams has two books over 20k, and nine more over 10k in 2022.
We wrap up the top ten Western publishers this year with Dark Horse Comics, which drops down #10. They place eight titles into the Top 750 for 136k, and $2.3m in calculated retail value.
Dark Horse’s Western best-seller is Minecraft (v1 is #1, with 38k sold), but v2 (#5, 15k) and v3 (#6, 12k) also do well. Next comes Avatar: The Last Airbender, where the large paperback omnibus format is the king. At #2 (17k) is The Search, at #3 (15k) is The Promise, and at #7 (12k) is North and South. And wrapping up their Top 750 performance is a new “Critical Role” release, Caleb Widogast (#4, 15k) as well as Stranger Things and Dungeons & Dragons (#8, 11k). No comics-native creator owned material appears in the Top 750.
Here’s what Dark Horse’s Western performance looks like in the Long Tail. They’re down from the last two years, but they’ve still kept a good portion of their “pandemic boost”, being almost double 2019.
| Year | # of listed items | Percent Change | Total Unit Sold | Percent Change | Calculated Retail value | Percent Change | Av. Sale per title | Av $ per title |
| 2007 | 597 | —— | 413,022 | —— | $7,607,264 | —– | 692 | $14,745 |
| 2008 | 734 | 22.95% | 552,815 | 33.85% | $9,329,828 | 22.64% | 753 | $12,711 |
| 2009 | 798 | 8.72% | 455,924 | -17.53% | $7,757,240 | -16.86% | 571 | $9,721 |
| 2010 | 955 | 19.67% | 445,248 | -2.34% | $7,852,063 | 1.22% | 466 | $8,222 |
| 2011 | 1025 | 7.33% | 389,514 | -12.52% | $7,102,710 | -9.54% | 380 | $6,929 |
| 2012 | 1133 | 10.54% | 377,322 | -3.13% | $6,907,772 | -2.74% | 333 | $6,097 |
| 2013 | 1238 | 9.27% | 383,391 | 1.61% | $7,391,831 | 7.01% | 310 | $5,971 |
| 2014 | 1420 | 14.70% | 421,708 | 9.99% | $8,982,411 | 21.52% | 297 | $6,326 |
| 2015* | 947 | -33.31% | 376,231 | -10.78% | $8,120,937 | -9.59% | 397 | $8,575 |
| 2016* | 877 | -7.39% | 461,297 | 22.61% | $9,076,526 | 11.77% | 526 | $10,350 |
| 2017 | 1598 | 82.21% | 478,658 | 3.76% | $9,256,795 | 1.99% | 300 | $5,793 |
| 2018 | 1615 | 1.06% | 485,919 | 1.52% | $9,410,362 | 1.66% | 301 | $5,827 |
| 2019 | 1612 | -0.18% | 459,996 | -5.33% | $9,617,364 | 2.20% | 285 | $5,966 |
| 2020 | 1686 | 4.59% | 971,551 | 111.21% | $20,408,830 | 112.21% | 576 | $12,105 |
| 2021 | 1894 | 12.34% | 988,766 | 1.77% | $22,230,359 | 8.93% | 522 | $11,737 |
| 2022 | 1930 | 1.90% | 806,402 | -18.44% | $18,718,651 | -15.80% | 418 | $9,699 |
Dark Horse, on the Western charts alone, has one title over 30k, and eleven more over 10k.
Dark Horse’s Manga offerings are up in that section. Dark Horse is one of the rare publishers that does a significant business in both Eastern and Western comics, and I’m sure they’d prefer all of their numbers to be represented together. In which case, their Long Tail actually looks like this:
| Year | # of listed items | Percent Change | Total Unit Sold | Percent Change | Calculated Retail value | Percent Change | Av. Sale per title | Av $ per title |
| 2007 | 938 | —— | 662,965 | —— | $10,936,728 | —– | 707 | $11,660 |
| 2008 | 1075 | 14.61% | 801,796 | 20.94% | $12,506,698 | 14.36% | 746 | $11,634 |
| 2009 | 1253 | 16.56% | 682,421 | -14.89% | $10,672,933 | -14.66% | 545 | $8,518 |
| 2010 | 1428 | 13.97% | 639,742 | -6.25% | $10,485,140 | -1.76% | 448 | $7,343 |
| 2011 | 1522 | 6.58% | 578,843 | -9.52% | $9,704,940 | -7.44% | 380 | $6,376 |
| 2012 | 1626 | 6.83% | 489,695 | -15.40% | $8,538,810 | -12.02% | 301 | $5,251 |
| 2013 | 1759 | 8.18% | 486,929 | -0.56% | $9,070,394 | 6.23% | 277 | $5,157 |
| 2014 | 1979 | 12.51% | 522,602 | 7.33% | $10,599,661 | 16.86% | 264 | $5,356 |
| 2015* | 1250 | -36.84% | 511,675 | -2.09% | $10,359,104 | -2.27% | 409 | $8,287 |
| 2016* | 1102 | -11.84% | 635,595 | 24.22% | $11,367,881 | 9.74% | 577 | $10,316 |
| 2017 | 2125 | 92.83% | 716,747 | 12.77% | $20,624,676 | 81.43% | 337 | $9,706 |
| 2018 | 2146 | 0.99% | 709,929 | -0.09% | $12,989,497 | -37.02% | 331 | $6,053 |
| 2019 | 2023 | -5.73% | 977,155 | 37.64% | $19,467,752 | 49.87% | 483 | $9,623 |
| 2020 | 2158 | 6.67% | 1,402,313 | 43.51% | $31,520,184 | 61.91% | 650 | $14,606 |
| 2021 | 2325 | 7.74% | 1,998,293 | 42.50% | $49,184,722 | 56.04% | 859 | $21,155 |
| 2022 | 2385 | 2.59% | 1,919,662 | -3.93% | $57,801,617 | 17.52% | 805 | $24,235 |
Down in units, but up in gross dollars is a fine result.
That is it for the top ten publishers, but there’s a few more publishers it’s worth singling out for attention because they have a historical importance, they are significant for either the book or comics markets, they are growing, or there is otherwise something of note about them!
Since this is a report on bookstore sales, let’s start with the last of the mainstream book world’s “Big Five”: Simon & Schuster. They manage to place five titles into this year’s Top 750, but missed the cutoff for Top Ten Publishers (They would be #12). These five titles place 113k copies, for about $1.4m in calculated dollar sales.
Simon has several imprints, including Aladdin, Atria, Atheneum, Free Press, Margaret K. Elderberry, Gallery 13, Little Simon, Pocket, Scribner, and Touchstone, though not all of those imprints made it into the Top 750.
Simon’s #1 book is the kids-aimed Spy School (34k sold), from their self-named “For Younger Readers” imprint, while the Atheneum imprint has #2 (“Bunnicula” at 26k) and #3 (“Long Way Down” at 24k). The Little Simon imprint is #4, with “The Coldfire Curse” (18k), and the Aladdin imprint closes out these at #5 with “The Okay Witch” selling 12k.
Here is Simon & Schuster’s Long Tail, which includes the imprints that I’m aware of.
| Year | # of listed items | % Change | Total Pieces | % Change | Calculated Retail Value | % Change | Av. Sale per title | Av $ per title |
| 2007 | 12 | — | 8,317 | — | $158,014 | — | 693 | $13,168 |
| 2008 | 26 | 116.67% | 14,917 | 79.36% | $211,798 | 34.04% | 574 | $8,146 |
| 2009 | 41 | 57.69% | 109,558 | 634.45% | $1,430,544 | 575.43% | 2,672 | $34,891 |
| 2010 | 46 | 12.20% | 214,828 | 96.09% | $2,660,094 | 85.95% | 4,670 | $57,828 |
| 2011 | 62 | 34.78% | 187,531 | -12.71% | $2,383,491 | -10.40% | 3,025 | $38,443 |
| 2012 | 63 | 1.61% | 165,831 | -11.57% | $2,844,453 | 19.34% | 2,632 | $45,150 |
| 2013 | 67 | 6.35% | 258,931 | 56.14% | $4,165,350 | 46.44% | 3,865 | $62,169 |
| 2014 | 71 | 5.97% | 383,878 | 48.25% | $6,520,821 | 26.55% | 5,407 | $91,843 |
| 2015* | 75 | 5.63% | 910,341 | 237.14% | $13,386,461 | 205.29% | 12,138 | $178,486 |
| 2016* | 75 | —— | 618,922 | -32.01% | $9,477,798 | -29.20% | 8,252 | $126,371 |
| 2017 | 89 | 18.67% | 449,243 | -27.42% | $6,788,432 | -28.38% | 5,048 | $76,275 |
| 2018 | 88 | -1.12% | 38,804 | -91.36% | $739,664 | -89.10% | 441 | $8,405 |
| 2019 | 100 | 13.64% | 80,795 | 108.21% | $1,502,286 | 103.10% | 808 | $15,023 |
| 2020 | 128 | 28.00% | 93,785 | 16.08% | $1,841,672 | 22.59% | 733 | $14,388 |
| 2021 | 193 | 50.78% | 247,842 | 164.27% | $3,454,596 | 87.58% | 1,284 | $17,899 |
| 2022 | 287 | 48.70% | 344,299 | 38.92% | $4,526,426 | 31.03% | 1200 | $15,772 |
[Almost all of that 2018 drop was my reconsidering hybrid-prose books like Rachel Renee Russell’s “Dork Diaries” as not properly being “comics”, so that was on me, not them!]
Simon & Schuster has one title over 30k, two more books over 20k, and four books over 10k this year.
While not one of the “Big Five”, Hyperion/Disney Press is also a bookmarket-first publisher who did well in the Top 750. They place three books, which sell 53k, or $715k calculated
Disney Press / Hyperion is, like Marvel, also owned by Disney. Technically, that probably means I should fold them together like I do with the various individual companies that make up a publisher like Penguin Random House, but I resist, how I resist (largely because they are distributed completely separately). But I have to point out that once again, Hyperion/Disney Press did better than Marvel did – Hyperion would be the #15 publisher in the Top 750, while Marvel only has a single placing book.
Their best-selling title is the adaptation of “Percy Jackson: The Lightning Thief” (19k), #2 is “Gravity Falls: Lost Legends”, selling about 400 fewer copies, while at #3 is “Spidey and His Amazing Friends: Team Spidey Does It All!” with 14k sold.
Here is the Long Tail for Hyperion/Disney. Not looking great, honestly.
| Year | # of listed items | Percent Change | Total Unit Sold | Percent Change | Calculated Retail value | Percent Change | Av. Sale per title | Av $ per title |
| 2007 | 10 | —– | 39,121 | —– | $336,771 | —– | 3,912 | $33,677 |
| 2008 | 19 | 90.00% | 41,005 | 4.82% | $409,051 | 21.46% | 2,158 | $21,529 |
| 2009 | 24 | 26.32% | 23,301 | -43.18% | $234,078 | -42.78% | 971 | $9,753 |
| 2010 | 26 | 8.33% | 30,860 | 32.44% | $314,067 | 34.17% | 1,187 | $12,080 |
| 2011 | 29 | 11.54% | 46,553 | 50.85% | $392,652 | 25.02% | 1,605 | $13,540 |
| 2012 | 31 | 6.90% | 33,105 | -28.89% | $376,735 | -4.05% | 1,068 | $12,153 |
| 2013 | 33 | 6.45% | 102,537 | 209.73% | $1,298,672 | 244.72% | 3,107 | $39,354 |
| 2014 | 38 | 15.15% | 77,045 | -24.86% | $1,015,188 | -21.83% | 2,028 | $26,715 |
| 2015* | 57 | 50.00% | 63,290 | -17.85% | $831,477 | -18.10% | 1,110 | $14,587 |
| 2016* | 36 | -36.84% | 61,730 | -2.46% | $926,504 | 11.43% | 1,715 | $25,736 |
| 2017 | 41 | 13.89% | 99,589 | 61.33% | $1,592,970 | 71.93% | 2,429 | $38,853 |
| 2018 | 54 | 31.71% | 132,623 | 33.17% | $2,228,412 | 39.89% | 2,456 | $41,267 |
| 2019 | 63 | 16.67% | 158,896 | 19.81% | $2,473,413 | 10.99% | 2,522 | $39,261 |
| 2020 | 49 | -22.22% | 149,565 | -5.82% | $2,362,499 | -4.48% | 3,052 | $48,214 |
| 2021 | 45 | -8.16% | 125,017 | -16.41% | $1,966,885 | -16.75% | 2,778 | $43,709 |
| 2022 | 43 | -4.44% | 86,720 | -30.63% | $1,291,665 | -34.33% | 2,017 | $30,039 |
Hyperion/Disney has three books over 10k.
Outside of those bookstore-native publishers, we’ve got a couple of publishers who placed more than two titles into the Top 750. One of those is a Direct Market-native: Image Comics would be the #13 publisher in the NPD BookScan Top 750 this year. Image has five titles placing within the Top 750 in 2022, which sell 90k copies.
Because Image is a primarily Direct Market retailer, we’ve always built a special year-by-year chart for them in the Top 750 (Hey! I have my own biases!), and this is what Image’s performance has looked like for the last eighteen years:
| Year | # of placing titles | Unit sales | Calculated
Retail Value |
| 2003 | 1 | 2,328 | $30,148 |
| 2004 | 1 | 402 | $5,206 |
| 2005 | 3 | 8,699 | $100,236 |
| 2006 | 1 | 5,311 | $113,465 |
| 2007 | 4 | 28,349 | $344,026 |
| 2008 | 9 | 55,033 | $830,574 |
| 2009 | 11 | 78,874 | $1,210,094 |
| 2010 | 22 | 289,044 | $6,479,930 |
| 2011 | 27 | 367,265 | $8,670,917 |
| 2012 | 33 | 701,050 | $20,389,762 |
| 2013 | 38 | 651,390 | $19,371,269 |
| 2014 | 47 | 691,804 | $17,554,492 |
| 2015 | 71 | 878,262 | $22,587,672 |
| 2016 | 72 | 908,655 | $22,917,758 |
| 2017 | 52 | 556,196 | $11,092,960 |
| 2018 | 42 | 402,584 | $7,611,777 |
| 2019 | 26 | 223,569 | $5,446,399 |
| 2020 | 6 | 55,711 | $1,927,993 |
| 2021 | 5 | 111,451 | $6,863,339 |
| 2022 | 5 | 89,662 | $4,933,090 |
Things are a little herky-jerky for Image.
The #1 book for Image was v1 of the $65 Invincible Compendium, which sold a solid 28k copies via NPD BookScan reporters (down from 43k in 2021), while v2 was #3 (17k) and v3 was #4 (14k). And to continue Robert Kirkman’s streak, you can find at #5 the first volume of the Walking Dead Compendium (13k)
But if you can count, you might be asking, “Hey, what is book #2?” Well, that would be the newest volume of Saga, with v10 bringing in about 17k — great news for Brian K Vaughan and Fiona Staples as “Saga” had been hovering in a sub-10k range during pandemic, so that’s a really healthy surge forward for the return of the series after a multi-year hiatus.
Nothing else from Image sells over 10k via BookScan reporters.
Here’s what Image’s Long Tail looks like. They’re selling less books in the book market than they were anytime since 2011
| Year | # of listed items | Percent Change | Total Unit Sold | Percent Change | Calculated Retail Value | Percent Change | Av. Sale per title | Av $ per title |
| 2007 | 438 | —— | 116,015 | —— | $2,313,477 | —– | 265 | $5,282 |
| 2008 | 515 | 17.58% | 121,001 | 4.30% | $2,445,765 | 5.72% | 235 | $4,749 |
| 2009 | 571 | 10.87% | 156,466 | 29.31% | $3,207,033 | 31.13% | 274 | $5,617 |
| 2010 | 642 | 12.43% | 359,238 | 229.59% | $8,152,806 | 254.22% | 560 | $12,699 |
| 2011 | 749 | 16.66% | 466,637 | 29.90% | $11,041,187 | 35.43% | 623 | $14,741 |
| 2012 | 868 | 15.89% | 794,419 | 70.24% | $22,797,279 | 106.47% | 915 | $26,264 |
| 2013 | 994 | 14.52% | 776,507 | -2.25% | $22,085,860 | -3.12% | 781 | $22,219 |
| 2014 | 1006 | 1.21% | 830,735 | 6.98% | $20,309,973 | -8.04% | 826 | $20,189 |
| 2015* | 842 | -16.30% | 1,070,299 | 28.84% | $26,175,438 | 28.88% | 1271 | $31,087 |
| 2016* | 876 | 4.04% | 1,187,316 | 10.93% | $28,267,847 | 7.99% | 1355 | $32,269 |
| 2017 | 1531 | 174.77% | 938,991 | -20.91% | $18,564,975 | -34.32% | 613 | $12,126 |
| 2018 | 1706 | 11.43% | 769,180 | -18.08% | $14,923,335 | -19.62% | 451 | $8,748 |
| 2019 | 1757 | 2.99% | 641,353 | -16.62% | $14,305,501 | -4.14% | 365 | $8,142 |
| 2020 | 1844 | 4.95% | 511,927 | -20.18% | $11,432,907 | -20.08% | 278 | $6,200 |
| 2021 | 1888 | 2.39% | 707,850 | 38.27% | $19,509,633 | 70.64% | 375 | $10,333 |
| 2022 | 1970 | 4.34% | 622,897 | -12.00% | $17,116,221 | -12.27% | 316 | $8,688 |
Image has just one title over 20k, and four more over 10k.
The other publisher placing more than one title into the Top 750 is religious publisher David C Cook who publishes Sergio Cariello’s The Action Bible: God’s Redemptive Story. The “expanded” version of this book sells nearly 107k copies – a really substantial number of copies. And the, well, I guess “unexpanded: edition still shifts almost 13k copies. I’m not going to make a formal long tail here, since they publish nothing else that does nearly as well, but really register that those over 100k copies is more than a few publishers sell annually for everything they publish!
Everyone from here on is just placing a single title in 2022, but many have Long Tails I have built for a long time. Let’s switch over to alphabetical order, shall we?
Boom! Sells only single title into the Top 750 this year. Boom! uses the imprints Archaia, Boom, Boom Box, Boom Town, and Kaboom. Boom!’s biggest success is the Keanu Reeves-driven BRZRKR which sells 14k. Nothing else sells over 10k into the book market.
The Long tail for Boom!:
| Year | # of listed items | Percent Change | Total Unit Sold | Percent Change | Calculated Retail value | Percent Change | Av. Sale per title | Av $ per title |
| 2007 | 21 | —– | 10,462 | —– | $246,984 | —— | 498 | $11,761 |
| 2008 | 44 | 109.52% | 10,943 | 4.60% | $394,361 | 59.67% | 249 | $8,963 |
| 2009 | 93 | 111.36% | 25,378 | 131.91% | $485,485 | 23.11% | 273 | $5,220 |
| 2010 | 202 | 117.20% | 64,770 | 155.22% | $1,140,019 | 134.82% | 321 | $5,644 |
| 2011 | 253 | 25.25% | 75,472 | 16.52% | $1,435,514 | 25.92% | 298 | $5,674 |
| 2012 | 307 | 21.34% | 59,758 | -20.82% | $1,160,894 | -19.13% | 195 | $3,781 |
| 2013 | 347 | 13.03% | 86,637 | 44.98% | $1,650,374 | 42.16% | 250 | $4,756 |
| 2014 | 388 | 11.82% | 108,504 | 25.24% | $1,894,658 | 14.80% | 280 | $4,883 |
| 2015* | 295 | -23.97% | 126,029 | 16.15% | $2,159,071 | 13.96% | 427 | $7,319 |
| 2016* | 309 | 4.75% | 134,386 | 6.63% | $2,313,502 | 7.15% | 435 | $7,488 |
| 2017 | 633 | 104.85% | 171,133 | 27.34% | $2,983,775 | 28.97% | 270 | $4,714 |
| 2018 | 768 | 21.33% | 198,773 | 16.15% | $3,659,046 | 22.63% | 259 | $4,764 |
| 2019 | 825 | 7.42% | 228,120 | 14.76% | $4,344,256 | 18.74% | 277 | $5,266 |
| 2020 | 951 | 15.27% | 236,779 | 3.80% | $4,634,903 | 6.69% | 249 | $4,874 |
| 2021 | 1022 | 7.47% | 295,639 | 24.86% | $5,643,860 | 21.77% | 289 | $5,522 |
| 2022 | 1041 | 1.86% | 230,394 | -22.07% | $4,640,840 | -17.77% | 221 | $4,458 |
Boom! has just the one book over 10k.
Drawn & Quarterly places a single book into the Top 750: Kate Beaton’s Ducks: Two Years in the Oil Sands, which sells a solid 14k in its opening frame.
Their Long Tail looks pretty healthy and sustainable.
| Year | # of listed items | Percent Change | Total Unit Sold | Percent Change | Calculated Retail value | Percent Change | Av. Sale per title | Av $ per title |
| 2007 | 62 | — | 24,689 | — | $500,764 | — | 398 | $8,077 |
| 2008 | 82 | 32.26% | 42,038 | 70.27% | $912,774 | 82.28% | 513 | $11,131 |
| 2009 | 107 | 30.49% | 42,957 | 2.19% | $920,014 | 0.79% | 401 | $8,598 |
| 2010 | 126 | 17.76% | 44,737 | 4.14% | $1,009,387 | 9.71% | 355 | $8,011 |
| 2011 | 145 | 15.08% | 62,286 | 39.23% | $1,399,793 | 38.68% | 430 | $9,654 |
| 2012 | 155 | 6.90% | 43,098 | -30.81% | $926,233 | -33.83% | 278 | $5,976 |
| 2013 | 189 | 21.94% | 41,887 | -2.81% | $893,905 | 3.49% | 222 | $4,730 |
| 2014 | 205 | 8.47% | 46,030 | 9.90% | $1,032,032 | 15.45% | 225 | $5,034 |
| 2015* | 219 | 6.83% | 73,471 | 59.62% | $1,680,878 | 62.87% | 335 | $7,675 |
| 2016* | 233 | 6.39% | 57,326 | -21.97% | $1,266,170 | -24.67% | 246 | $5,434 |
| 2017 | 247 | 6.01% | 68,087 | 18.77% | $1,548,813 | 22.32% | 276 | $6,271 |
| 2018 | 285 | 15.38% | 79,765 | 17.15% | $2,055,019 | 32.68% | 280 | $7,211 |
| 2019 | 303 | 6.32% | 80,084 | 4.32% | $2,112,455 | 2.79% | 264 | $6,972 |
| 2020 | 329 | 8.59% | 80,384 | 0.37% | $2,302,356 | 8.99% | 244 | $6,177 |
| 2021 | 331 | 0.61% | 80,346 | -0.05% | $1,975,217 | -14.21% | 243 | $5,967 |
| 2022 | 334 | 0.91% | 82,109 | 2.19% | $2,267,686 | 14.81% | 246 | $6,789 |
Drawn & Quarterly has just the one book over 10k
Dynamite also places a single book into the Top 750. Same as last year, it is v1 of The Boys Omnibus, which sells about 15k into the bookstores. Does anyone else remember when this was originally published by DC? As the kids say, “LOL”
Here’s Dynamite’s long-tail – they’re growing, and at much better percentage than almost any of their DM-birthed contemporaries!
| Year | # of listed items | Percent Change | Total Unit Sold | Percent Change | Calculated Retail value | Percent Change | Av. Sale per title | Av $ per title |
| 2007 | 21 | —– | 1,082 | —– | $17,861 | —– | 52 | $851 |
| 2008 | 71 | 238.10% | 7,300 | 574.68% | $138,083 | 673.10% | 103 | $1,945 |
| 2009 | 124 | 74.65% | 23,748 | 225.32% | $485,272 | 251.44% | 192 | $3,913 |
| 2010 | 177 | 42.74% | 31,194 | 31.35% | $660,904 | 36.19% | 176 | $3,734 |
| 2011 | 246 | 38.98% | 57,801 | 85.30% | $1,300,079 | 96.71% | 235 | $5,285 |
| 2012 | 288 | 17.07% | 38,798 | -32.88% | $887,083 | -31.77% | 135 | $3,080 |
| 2013 | 347 | 20.49% | 32,296 | -16.76% | $799,021 | -9.93% | 93 | $2,303 |
| 2014 | 405 | 16.71% | 31,528 | -2.38% | $788,130 | -1.36% | 78 | $1,946 |
| 2015* | 192 | -52.59% | 31,452 | -0.24% | $797,977 | 1.25% | 164 | $4,156 |
| 2016* | 174 | -9.38 | 42,280 | 34.43% | $997,956 | 25.06% | 243 | $5,735 |
| 2017 | 552 | 217.24% | 38,053 | -10.00% | $868,682 | -12.95% | 69 | $1,574 |
| 2018 | 630 | 14.13% | 50,538 | 32.81% | $1,227,967 | 41.36% | 80 | $1,949 |
| 2019 | 654 | 3.81% | 81,198 | 60.67% | $2,112,720 | 72.05% | 124 | $3,230 |
| 2020 | 682 | 4.28% | 100,008 | 23.17% | $2,735,911 | 29.50% | 148 | $4,012 |
| 2021 | 662 | -2.93% | 73,595 | -26.41% | $1,971,384 | -27.94% | 111 | $2,978 |
| 2022 | 678 | 2.42% | 87,671 | 19.13% | $2,544,245 | 29.06% | 129 | $3,753 |
Dynamite just has one book over 10k.
Then we have Marvel Comics – the overwhelming majority of sales within the Direct Market; the absolute 800 pound gorilla…. But they’re pretty much nothing in the Bookstore channel, at least as represented by NPD BookScan.
I will apologize, I can not help but editorialize like mad in this section. First off, let’s here’s the last of my DM-centric charts I have been building since forever, showing Marvel’s overall performance in the BookScan Top 750!
| Year | # of placing titles | Unit sales | Calculated
Retail value |
| 2003 | 73 | 455,553 | $8,428,962 |
| 2004 | 50 | 227,985 | $3,756,764 |
| 2005 | 26 | 153,317 | $2,459,027 |
| 2006 | 33 | 294,852 | $5,702,307 |
| 2007 | 37 | 376,918 | $7,599,057 |
| 2008 | 38 | 303,639 | $6,446,359 |
| 2009 | 34 | 226,541 | $5,019,216 |
| 2010 | 33 | 206,273 | $4,979,323 |
| 2011 | 27 | 128,364 | $3,303,496 |
| 2012 | 32 | 141,145 | $3,872,683 |
| 2013 | 39 | 187,598 | $4,229,242 |
| 2014 | 53 | 342,706 | $8,341,787 |
| 2015* | 63 | 478,076 | $10,611,981 |
| 2016* | 60 | 555,715 | $12,088,278 |
| 2017 | 50 | 378,689 | $7,840,198 |
| 2018 | 44 | 363,360 | $7,885,015 |
| 2019 | 27 | 220,845 | $4,151,908 |
| 2020 | 6 | 49,838 | $1,292,944 |
| 2021 | 0 | 0 | 0 |
| 2022 | 1 | 16,822 | $588,602 |
So, for the good news? They at least placed a single book into the Top 750. Hooray? But this seems paltry when you see that at least four other publishers licensed to publish Marvel characters (Viz with the Manga Deadpool: Samurai; 74k, Scholastic with “Miles Morales: Shockwaves”; 42k, PRH with “Penguin Classics: Amazing Spider-Man”; 14k, and Abrams with “Fantastic Four: Full Circle”; 16k) beat every single comic Marvel itself published, except for one: “Moon Knight by Lemire & Smallwood”, with 17k.
If everyone can do better than you selling your characters, it makes you wonder why you’re still in the publishing business. Starting recently (April 1st, I believe), Marvel’s bookstore distribution switches from Hachette to Penguin Random House, so I guess we’ll see if and how their sales change in the book market, but if there is another year of results like this I would imagine stockholders would have to start asking pointed question.
Marvel does have two other books over 10k this year – though neither of the others makes the Top 750. They are also both Moon Knight comics. Their fourth best-seller is a volume of “Ms Marvel” (though that one sells around 8k copies only), which would seem to suggest that Marvel’s bookstore sales purely devolve on “what’s broadcasting on Disney+ right now”
Once again, let’s state the obvious: Marvel is literally synonymous with the very idea of “comics” for a meaningful percentage of the American population, they have utterly dominated pop culture for multiple years here, and the source material of comics is actually usually better realized than the various bits stolen by the adaptations. Plus, on top of that, they have “Star Wars” (and also all of the 20th Century Fox library now) – it is absolutely incomprehensible to this observer that they are not entirely dominating the sales of western comics to adults. And yet, they can only sell three books into the bookmarket at over 10k copies? My considered opinion says to me “Someone isn’t doing their job”.
It’s possible, I suppose, that they’re making it all up in the Direct Market, but since there are no longer any sales charts to establish this, and since I know so many retailers who run fairly specifically Marvel-driven stores who are complaining incessantly about the drops in sales of Marvel periodicals, I’m going to strongly doubt that this is actually the case (at least in a sustainable, non-“Franklin Mint” kind of fashion). It’s too bad: a strong comics market could really really use a strong Marvel that leads the market; instead we are stuck with leadership that doesn’t appear to have any vision besides just following trends… and not even doing that especially well. It makes me sad.
Here is Marvel’s Long Tail. They’re (just) selling the most (gross calculated, not actually real) dollars they’ve ever done, but they’re in the bottom 40% of unit sales throughout their history. And those dollars are coming from things like $125 hardcover omnibuses being sold to under 3k humans – seriously: Marvel #2 & #3 dollar best-sellers both were sub 3k HCs topping those other “Moon Knight” volumes. Making most of your money from OCD collectors that are about the capacity of mid-sized concert hall – customers who are probably at their third publication of exactly the same material – is simply not a sustainable or rational business model, sorry.
| Year | # of listed items | % Change | Total Pieces | % Change | Calculated Retail value | % Change | Av. Sale per title | Av $ per title |
| 2007 | 1230 | — | 1,034,023 | — | $19,947,737 | — | 841 | $16,218 |
| 2008 | 1559 | 26.75% | 1,032,394 | -0.01% | $20,128,825 | 0.01% | 662 | $12,911 |
| 2009 | 2067 | 32.58% | 954,335 | -7.56% | $19,608,696 | -2.58% | 462 | $9,487 |
| 2010 | 2551 | 23.42% | 870,597 | -8.77% | $19,485,662 | -0.06% | 352 | $7,638 |
| 2011 | 2852 | 11.80% | 852,187 | -2.11% | $20,225,728 | 3.80% | 299 | $7,092 |
| 2012 | 3083 | 8.10% | 726,542 | -14.74% | $18,848,013 | -6.81% | 236 | $6,114 |
| 2013 | 3203 | 3.89% | 730,826 | 0.59% | $17,820,299 | -5.45% | 228 | $5,564 |
| 2014 | 3352 | 4.65% | 918,595 | 25.69% | $24,369,961 | 36.75% | 274 | $7,270 |
| 2015* | 1882 | -43.85% | 1,114,414 | 21.32% | $28,021,290 | 14.98% | 592 | $14,889 |
| 2016* | 1841 | -2.18% | 1,277,046 | 14.59% | $31,402,330 | 12.07% | 694 | $17,057 |
| 2017 | 3578 | 94.35% | 1,142,061 | -10.57% | $28,201,535 | -10.19% | 319 | $7,882 |
| 2018 | 3662 | 2.35% | 1,180,202 | 3.34% | $29,651,745 | 5.14% | 322 | $8,097 |
| 2019 | 3692 | 0.82% | 1,064,633 | -9.79% | $26,249,715 | -11.47% | 288 | $7,110 |
| 2020 | 4375 | 18.50% | 785,201 | -26.25% | $20,798,624 | -20.77% | 179 | $4,754 |
| 2021 | 5034 | 15.06% | 1,030,272 | 31.21% | $30,480,039 | 46.55% | 205 | $6,055 |
| 2022 | 5022 | -0.24% | 932,781 | -9.46% | $31,414,866 | 3.07% | 186 | $6,255 |
Marvel just has three books over 10k, despite having over five thousand different titles in stock at bookstores
And Oni Press wraps up the alphabet in this section. They have exactly one book on the Top 750 charts: Maia Kobabe’s amazing Gender Queer, which was the most banned book in 2022. Gotta love it when a plan comes together, because Gender Queer sold a fantastic 27k copies. Thanks blue noses?
Here is the Oni Long Tail
| Year | # of listed items | Percent Change | Total Unit Sold | Percent Change | Calculated Retail value | Percent Change | Av. Sale per title | Av $ per title |
| 2007 | 125 | —— | 11,294 | —— | $141,829 | —– | 90 | $1,135 |
| 2008 | 138 | 10.40% | 21,843 | 93.40% | $320,799 | 126.19% | 158 | $2,325 |
| 2009 | 149 | 7.97% | 51,584 | 136.13% | $713,121 | 122.30% | 346 | $4,786 |
| 2010 | 156 | 4.70% | 446,791 | 866.14% | $5,882,247 | 824.86% | 2864 | $37,707 |
| 2011 | 177 | 13.46% | 162,275 | -63.68% | $2,786,438 | -52.63% | 917 | $15,743 |
| 2012 | 171 | -3.39% | 80,560 | -50.36% | $1,594,016 | -42.79% | 471 | $9,322 |
| 2013 | 195 | 14.04% | 68,140 | -15.42% | $1,401,748 | -12.06% | 349 | $7,188 |
| 2014 | 213 | 9.23% | 61,584 | -9.62% | $1,303,069 | -7.04% | 289 | $6,118 |
| 2015* | 165 | -22.54% | 65,254 | 5.96% | $1,478,997 | 11.35% | 395 | $8,964 |
| 2016* | 191 | 15.76% | 90,222 | 38.26% | $1,992,643 | 34.73% | 472 | $10,433 |
| 2017 | 283 | 48.17% | 117,950 | 30.73% | $2,847,629 | 42.91% | 417 | $10,062 |
| 2018 | 323 | 14.13% | 108,897 | -7.68% | $2,595,362 | -8.86% | 337 | $8,035 |
| 2019 | 378 | 17.03% | 129,934 | 19.32% | $2,786,185 | 7.35% | 344 | $7,371 |
| 2020 | 460 | 21.69% | 125,464 | -3.44% | $2,599,092 | -6.72% | 273 | $5,650 |
| 2021 | 513 | 11.52% | 195,328 | 55.68% | $3,782,328 | 45.52% | 381 | $7,373 |
| 2022 | 507 | -1.17% | 178,019 | -8.86% | $3,516,734 | -7.02% | 351 | $6.937 |
Oni has one book over 20k
With those done, we’ve got just four books left on the 2022 Top 750 that aren’t mentioned above. We’ll do these in sales order.
Papercutz is a slightly strange publisher to me, such that I’ve never built them a Long Tail in the decades of doing this survey. I had thought they were… well maybe not a division of NBM, but at least with common ownership interests, so I never knew quite how to build their potential Tail? But at the end of 2022 Papercutz has been sold to Mad Cave, so maybe you’ll see a Tail for them next year? Either way, volume four of “The Loud House 3-in-1” omnibi sells almost 16k copies.
Webtoon Unscrolled is a new publisher (they formed right at the very end of 2021, and Bobbie Chase is the EIC), but they’ve already placed their first book: 16k copies of True Beauty. This is the embarrassing thing about writing the column the way I do: now that I look at this book, it’s a print version of a Korean webcomic, which means it really should be in the “Manga” section, but since I just caught that now, there’s too much other charts and lists that I’d have to recalculate to do that now. Ungh, next year! My mistake was looking up the pub, rather than the book on my first sorting pass – any “webcomic” material isn’t inherently “Eastern” or “Western” and has to be judged individually. Also? It’s primary BISAC doesn’t indicate manga. Cue a Han Solo “It’s Not My Fault!” GIF.
Our sole Print-On-Demand publisher (in that the column of the database that indicates distribution is “Lightning Source”, which means POD, instead of a traditional bookstore model where print runs are typically set before orders are all in hand) is Top Floor Books, who sell 13k copies of The Fantastic Flatulent Fart Brothers Big Book of Farty Facts. There’s something about a POD book about farts outselling, in the physical bookstore market, almost everything that Marvel, DC, or Image publishes make me laugh, and who doesn’t need to laugh more every day?
And last, but absolutely not least, it’s the effective poster child for the promise of creator-owned Direct Market-birthed self-publishing system: Cartoon Books. This is because Jeff and Vijaya not only have a solid deal from Scholastic for the color version, but they’ve kept their own personal rights to keep publishing the complete black-and-white edition of Bone, which they sell nearly 13k copies into the book market. This is pure profit for the creator, and their Cost Of Goods Sold on a B&W reprint is super low. The creative costs were (mostly) borne by their serialization, so this is just steady steady income for wow, almost twenty years since the last issue that was printed in this book. America! Fuck yeah!
Whew! That’s done!
A few final bits of number-crunching for fun before we go for the year!
First and foremost: for those of you whom have actually seen a NPD BookScan chart, I’m sure you noticed that one of the columns is listed as “publishers”. I’ve never been able to understand why: that column is clearly the distributor column, with the (very very) weird exception of DC Comics. DC (and Dark Horse, and IDW, and others) are distributed by Random House in the bookstore market, not Diamond. Marvel is distributed by Hachette. Boom! and Viz are distributed by Simon, and so on. Image and Dynamite are the primary Diamond publishers in the book market. Now, most analysis that I do I get fairly rigorous about going in and fixing problems, but this is a simple top level search where I’m just going to accept what it tells me without question. So who are the leaders for distribution, over the breadth of the entire NPD BookScan list?
This is by pieces sold, of all 52.6 million books sold in 2022 that NPD BookScan reported. There are one hundred and ninety-two different distributors listed for books this year.
Turns out it looks like this in 2022:
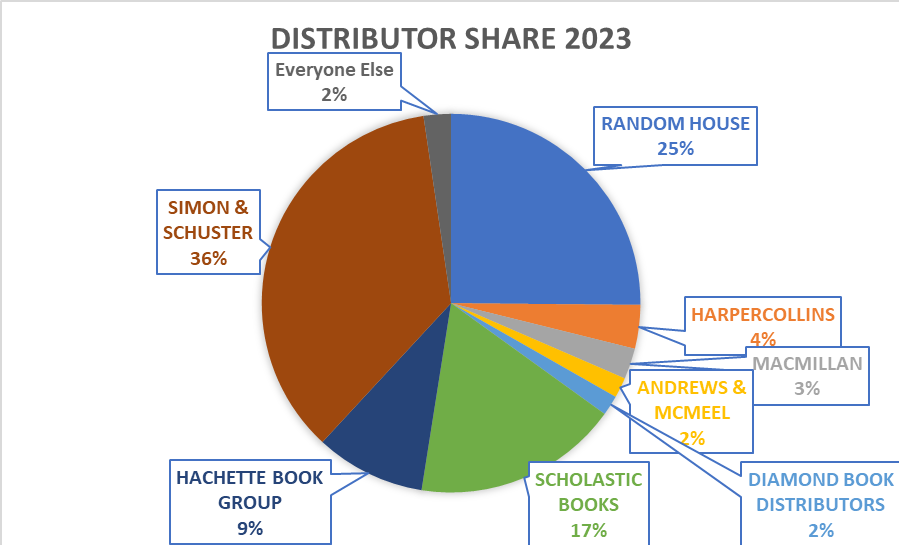
Probably not what you pictured in your head, through the normal Direct Market-driven perceptions and reporting.
Lastly: if we look at the entirety of the 53k-long “Long Tail” NPD BookScan list, how do the publishers (all 1927 of them) stack up in 2022? This is everything, including both “east” and “west” comics, and we’ll sort it by Calculated Retail Value, and rounding everything to the nearest hundred-thousand just for ease of presentation. This is a list of any publisher on a quick sort that generated $1m or more in Calculated Dollar Sales. Please remember, just because I can calculate what the dollars should be, there is zero evidence that these books were actually sold at full retail price. Certainly, the existence of Amazon alone throws that deeply into doubt!
Viz is the biggest publisher in the Book stores, followed distantly by Scholastic, then more distantly by Kodansha, Dark Horse, and Hachette. Those top five publishers together are larger than the bottom 1922 publishers combined!
| #1 | VIZ MEDIA | $233.3 |
| #2 | SCHOLASTIC | $135.0 |
| #3 | KODANSHA | $69.2 |
| #4 | DARK HORSE | $57.8 |
| #5 | HACHETTE | $52.9 |
| #6 | DC COMICS | $43.5 |
| #7 | PENGUIN RANDOM HOUSE | $41.4 |
| #8 | MARVEL | $31.4 |
| #9 | SEVEN SEAS | $30.0 |
| #10 | HARPERCOLLINS | $28.1 |
| #11 | HOLTZBRINCK | $19.8 |
| #12 | ANDREWS MCMEEL PUBLISHING | $17.6 |
| #13 | IMAGE COMICS | $17.1 |
| #14 | IDW | $14.2 |
| #15 | SQUARE ENIX MANGA | $7.5 |
| #16 | ABRAMS | $6.3 |
| #17 | SIMON & SCHUSTER | $4.5 |
| #18 | DAVID C COOK | $4.0 |
| #19 | ONI PRESS | $3.5 |
| #20 | BOOM! STUDIOS | $3.4 |
| #21 | FANTAGRAPHICS BOOKS | $3.4 |
| #22 | DYNAMITE ENTERTAINMENT | $2.5 |
| #23 | DRAWN & QUARTERLY | $2.3 |
| #24 | DISNEY – HYPERION | $2.2 |
| #25 | TITAN COMICS | $1.9 |
| #26 | LOVE X LOVE | $1.6 |
| #27 | PAPERCUTZ | $1.3 |
| #28 | ONE PEACE BOOKS | $1.2 |
| #29 | UDON ENTERTAINMENT | $1.1 |
And that’s pretty much what NPD BookScan in 2022 looks like to these eyes.
How does it look to you?
How Does The Sausage Get Made???
I like methodology, so here is entirely too much detail on what I do, and how I do it each year.
“Direct Market” stores (also known as “your Local Comics Shop”) buy much of their material for resale from Diamond Comics Distributors (though, not, by any means, all of the material your LCS has for sale – many DM stores are also buying from book-market wholesalers, or directly from publishers and have been for years). While many DM stores have Point-of-Sales (POS) systems, because our market typically buys non-returnable what we track in our side of the industry is what sells-in to the store, not what sells-through to the eventual consumer. In a very real way, this means that the DM store owner is the actual customer of the publisher, as opposed to the end consumer.
The bookstore market, however, buys their material semi-returnable, where they can send back some portion of titles that don’t sell (but not, usually, all unsold product). Because of this, sell-through is the data that is tracked and trended. Bookstores that have POS systems are able to report their sales to NPD BookScan, a subsidiary of The NPD Group (they bought it from Nielsen).
NPD BookScan tracks the specific sales to consumers through its client stores. I had several well trained spies who have, for many years, provided me with access to the NPD BookScan reports at the end of each year. However, I am very excited to say that we are now getting the NPD BookScan reports directly from The NPD Group, with no filter or middleman! This is our third year of doing so.
However, getting “official” detail has brought a major change as of last year: NPD Group no longer wants us releasing the actual data, even the pretty tight “Top 750” as has been our historical practice. I am fairly certain that, if you know how to search the internet, you could probably turn up previously published links from 2003 through 2017, but going forward, you will have to trust my abstract of the charts, rather than seeing the charts themselves. So sorry!
For points of comparison, try these links to the earlier pieces.
2021: My Analysis
2020: My Analysis
2019: My Analysis
2018: My Analysis
2017: My Analysis
2016: My Analysis
2015: My Analysis
2014: My Analysis
2013: My Analysis
2012: My Analysis
2011: My Analysis
2010: My Analysis
2009: My Analysis
2008: My Analysis
2007: My Analysis
2006: My Analysis
2005: My Analysis
2004: My Analysis
2003: My Analysis
For some historical context, we have three “eras” of data: 2003-2005 numbers are “what is YTD sold, IF it made the chart in the last week of the year?”
2006-2016: the full “here’s everything that sold throughout the entire year”, but filtered through a leaker – almost certainly accurate, but absolutely missing some bits due to methodology changes and differences, even year-by-year. Important: in 2015 and 2016 I received lists that appeared to be lightly edited, potentially down to “books that are in print at the publisher level only” (obviously, there’s still stock out there on the shelves of stores and in warehouses that is not “in print” per se). Those two years are asterisked to reflect that!
2017-now: “Everything” sold in the calendar year, with no filter. (Though see further notes below!)
Just bear this all in mind if you compare the various “eras” against one another. These are not inherently apples-to-apples comparisons as a result! Moving forward there should be a much deeper consistency of data.
The biggest and most obvious difference when doing straight comparisons will be in the lower ends of the chart. This year, the “worst selling” book in the Top 750 is just about eleven thousand copies (a drop from about twelve thousand copies last year) In ’03-‘05 there would be many items that didn’t have YTD sales in anything like that amount.
Also of major note is that starting in 2007, I have had the “full and entire” NPD BookScan listing, down to books that have only one copy sold YTD. However, I’ve never tried to really analyze that entire list because that’s too much data, even for a data-junkie like myself. I’ve cut the list off at 750 items because that’s what we’ve historically reported. Still, I have the deeper data, and I’ll summarize it as we go along. As long as I continue to get that much data going forward, I should be able to tell you a few things about “The Long Tail”. In 2022, I possess data on 50,056 items! (in 2021 this was 47,631 items) We’ll talk more about this later in some depth, including the methodology of how these are generated.
This is important, however: this is not a list of every book that sold through every book store – the report is limited to those stores that report to NPD BookScan. According to NPD BookScan, more than 7500 venues report to them, but this still leaves many venues that don’t.
Neilsen claimed in 2013 that approximately 85% of retail, physical book sales are tracked through them, though this number appears very much in doubt as an actionable percentage for any specific individual book. A quick internet search can find any number of cases of authors saying that NPD BookScan numbers show half or less of their royalty statements. There’s some really excellent discussion on why and by how much NPD BookScan numbers might be off right here.
NPD BookScan says “Barnes & Noble, Amazon, Costco, General Independents, Hastings, Target, BJ’s, K-Mart, Hudson Group, Meijers, Follett Books, Books-A-Million, CEO Read, Powells, Toys R Us, Shoprite, SuperValu, Sam’s Club and Walmart are among our many data providers.”
What sales do NPD BookScan not track? Among others, this would include libraries, schools, specialty stores (like comic book stores!) and book clubs and fairs. NPD BookScan does not track sales at most independent bookstores. For many books those are very very important sales channels, and thus, NPD BookScan under-reports by some potentially significant degree, and don’t, in any way, represent all physical book sales or even all “book stores” selling comic book material.
There’s also a certain amount of miscategorization going on. As an example, for almost all of the last twenty years the purely-prose novel Bloody Crown of Conan appeared on my list, while other books (see; Dork Diaries in a few paragraphs) might appear one year, and disappear another. I do not know what the actual extent of miscategorization might be and how it would impact any of the general data analysis! There are simply too many potential data points to possibly connect them all together in the time I have to assemble this column.
I’ve done the best I can to try and root out any items “of significance” that should be on the chart that I’m given, but are not – for example, I have to have The Complete Persepolis and Maus manually pulled for me every year because of how BISAC codes work. Because this relies on me catching these titles to get them on to the list this means there’s almost certainly comics material missing that I didn’t catch. If you can think of a book I might have missed, please email me, and I’ll try to track down the sales for it, and update my listings for the future! Even with my multiple safeguards, the datastream is too wide for me to not make mistakes. I make constant mistakes, as you’ll see further down in the body of the column.
Either way, what I’m trying to get across to you is that this really is entirely unreliable data in terms of the absolute and total number of books sold, and is only able to give the broadest possible outline of what’s happening in book stores, based upon the data-set that I’m being given, which is in no way comprehensive. I still think that’s much much better than having no information, so I persevere in writing this each year. Also, now that I am getting directly from the NPD Group, I feel much more confident that I at least know where the potential problems generally are.
Again, I want to stress that I’m doing my primary analysis on the Top 750 items: the reason for this is that is all that I was able to get in the first four years of this analysis, and otherwise the percentage changes I’m discussing will be even more wrong than they would be otherwise. The Top 750 represents more than half of the total of the full list, and has consistently for years – in 2022 the Top 750 was roughly 31 million books sold; the bottom forty-nine thousand-ish represents about 25 million books sold. While there are significant sales below the Top 750, the Top 750 probably represents the majority of items you’d be able to “easily” find on the shelf of a bookstore in America. I’d love to analyze the full “long tail” list, but I’m afraid that this might take these little essays to triple their current size, and keeping your attention just through this seems hard enough to me! Maybe if someone paid me by the word…!
Finally, it is probably worth mentioning that although I’m analyzing primarily units sold, I also have some calculations that are purely my own of dollars that they would have been if they were sold at full retail. NPD BookScan does not report on the price that a book actually sold for, so the extrapolation of dollars that I made could be dramatically overstated. More than “could be”: it probably is… because Amazon sells so many books, often at crazy steep discounts. In no way should you take any “Calculated Retail Value” as TRUE – these are just to provide a series of benchmarks, and to help you see the impact and differences that “cover price” can make in sales.
If it was not obvious, this only counts physical books, and does not include any digital sale of any kind; it does however, include physical books sold through Amazon.
One of the things I really never talk about is how I get this data each year. I certainly don’t have a NPD BookScan account (they’re pretty expensive!), so I have historically dependent on leaks from industry sources. But this means that the methodology with which the data was generated may actually be very different from year to year. The thing is, since I don’t generate these, NPD BookScan methodology is still largely a Black Box to me. For a guy who writes these reports for 20 (!) years, I still have only really a passing knowledge of how things work. I am learning, slowly, though!
Now that the NPD Group is directly providing us data, we can assume that the methodology itself will not change going forward, yay!
A Bunch of Information about BISAC codes and how this report is generated!
Here’s where we learn a little bit about the Book Industry Standards and Communications (or “BISAC”) codes. It turns out that the publishers assign them themselves, and that publishers are allowed to assign up to four different BISAC codes per item. For example: “Diary of a Wimpy Kid” is classified as “Juvenile Fiction: Humorous Stories”; “Juvenile Fiction: Comics & Graphic Novels: General”; and “Juvenile Fiction: Social Issues: General”. But the kicker is that NPD BookScan reports will only spit out for the first BISAC listed for any given book. That is why “Diary of a Wimpy Kid” never ever showed on any of our previous reports, because the “comics” designation of the BISAC is listed second for that series! Conceptually I could also ask for “Juvenile Fiction: Humorous Stories” report, too – but that’s going to have thousands and thousands of prose-only, not-even-slightly-comics items on it, and working to cut those would quintuple the hours I spend on this (no thanks!) This is also why I have to manually ask for titles like “Maus” or “Persepolis” or “Understanding Comics” each and every year – not because they don’t contain the BISAC for comics (“CGN00xxxx” are the primary ones, for the record), but because that BISAC isn’t listed first!
Now, historically, this has really been opaque to me, to the point where I didn’t even really know what BISAC was what, but The NPD Group has been incredibly forthcoming, and I’m learning enough that I almost understand it. First and foremost, we’re now having the report generated using the codes for “Comics & Graphic Novels” (CGN), as well as the “comics” portions of “Juvenile” fiction (JUV) and nonfiction (JNF), and Young Adult Fiction (YAF) and non-fiction (YAN). Please note that the J and Y series of codes extend far past “comics”, but our search is for the narrower section. In addition to that, the NPD Group pulled records for three prominent authors that seldom showed up without intervention: Art Spiegelman, Marjane Satrapi, and Scott McCloud (As well as a small handful of books that I crosschecked against my own best sellers)
So you know, there are more than seventy-five “main” BISACs that we’re pulling in full.
Again, the publishers are the ones who assign the BISACs, and they can assign up to four per book. But reports can only generate (for now) from what the first BISAC code is listed – The NPD Group tells me they’re working on fixing that, but it’s a limitation of the current tools. That’s why they pulled by Author for Art Spiegelman – and look at how MAUS breaks down: the first individual volume has a primary BISAC of HIS022000 (“History: Jewish”), while the complete hardcover is BIO006000 (“Biography: Historical”). But the box set of the two paperbacks is BIO000000 (“Biography: General”), and METAMAUS (the book, with supporting documentation) for some reason is categorized as LIT017000 (“Literary: Comics & Graphic Novels”) which I’m not at all certain how that is different from CGN006000 (“Comics & Graphic Novels: Literary”) – but my point is that you have essentially one book that the publisher itself doesn’t really know what the “primary” BISAC should be.
There’s also more than a few dumb-ass choices, like how JUV008010 (Juvenile Fiction: Comics & GNs/Manga) features a not-even-slightly “manga” HILO by Judd Winick. These kinds of categorization problems pepper the entire database.
Additionally, only (apparently) the publishers can change BISACs, so even if I find errors year after year, it’s really very difficult to convince folks that it matters enough to devote person-hours to fixing up, even if the folks at The NPD Group agree.
If you want to learn more about the theory and practice of BISAC codes, you can go and follow this link. (It’s a trap!)
The main thing to know is that while BISAC is a pretty good system for categorizing books because it is solely in the publisher’s hands it has some pretty extreme limitations when creating reports with it as the sole basis. There is not, however, any other way to generate this data without using those limitations, to the best of my knowledge.
Either way, prior to 2017 numbers, the exact methodology from my leakers was slightly different every year and sometimes we got weird spikes and discrepancies. For example, as far as I can tell, in 2014 and prior we were always getting every book that sold one copy anywhere, then in 2015, and slightly in 2016, we’re getting a lightly edited list that only listed in-print books from some (but not all!) publishers. I put an asterisk on 2015 and 2016 because it was missing several thousand data points… But those very strongly appeared to be datapoints that may not materially affect the actual bottom-line health of dollars and pieces the charts (you’ll see this year, I think). Either way, I really must once again urge you to treat every datapoint presented here as only part of the possible picture!
Hopefully this gave you a good understanding of methodology and such!
Brian Hibbs has owned and operated Comix Experience in San Francisco since 1989, was a founding member of the Board of Directors of ComicsPRO, has sat on the Board of the Comic Book Legal Defense Fund, and has been an Eisner Award judge. Feel free to e-mail him with any comments. You can purchase a collection of the first Tilting at Windmills (originally serialized in Comics Retailer magazine) published by IDW Publishing, as well as find an archive of pre-CBR installments right here.
Sponsored by Battle Quest Comics


You would be shocked to know how long this takes to write….
Awesome work, Brian! Even your asides look like they took forever to put together. It’s valued work, though, so thanks for doing it!
Thank you, Brian! It really is two different comic worlds. Our store has greatly reduced Manga as so many of the “buyers” laid on our store floor, reading a couple of books, getting in the way of our customers, before buying their one book. Just not worth the aggravation, and the 15 stores within 20 minutes of our store. Pretty much agree , let B&N have these buyers. We do fine with the weekly DC/Marvel magazines and DC’s strong perennial TPB/HC backlist. Also the kids stuff works for us, as parents pick these books up for their kids. And Wimpy Kid is a comic book, in fact it was our biggest selling OGN last year.
The Adventures of Ook and Gluk, Kung-Fu Cavemen From The Future was pulled from store shelves by Pilkey back in 2021 due to (in his own words) “harmful racial stereotypes and passively racist imagery.”
Thank you Brian for your yearly reports! Also kinda concerned about Marvel not doing well in the bookstore area but glad to see that DC is doing well even though their movies aren’t great in comparison.
I enjoy seeing the manga stats. For anyone reading, LOVE X LOVE on the list at the end is a TOKYOPOP Imprint. Interesting to see that the BL & GL is their best sellers.
Thank you, Brian. I work in a library, and I know that myself and many of my colleagues find these invaluable!
Thanks for all the work you put into this! Always a good yearly read I guess.
Fantastic work, Brian!
I was wondering if you have any info on how Archie Comics did in 2022. Do the monthly digests appear on the list, or is it just the trades and the (very few) OGNs? What sells best and how many copies?
The Archie Digests are considered periodicals , so no they would not be tabulated. And I am guessing their biggest market is “Supermarkets” , so they are still fully returnable. From what a friend that runs the “News Agency” material for one large chain. They still do very well. Actually very , very well. He still can not figure why DC and Marvel do not do this. In fact he pointed out , this magazine is the biggest selling magazine of any type in their chain , https://www.supermanhomepage.com/the-story-of-superman-magazine-celebrates-85-years-of-superman/ , so far in 2023
@Mark Moore: No, Archie Digests are periodicals, not books, and are not kept in print. BookScan ONLY covers books. The best selling Archie item in 2022 was ARCHIE: 80 YEARS OF CHRISTMAS. It sold just over 1500 copies
Interesting thanks.
I can’t believe you’ve been doing this for 20 years! If I’d given this task to myself I don’t know that I would have lasted five.
How well do Marvel’s omnibuses sell? And DC, I guess, though they put out WAY fewer.
I always look forward to these articles. I wonder… if you include the direct market and make some guesses about school book sales etc, are Viz and Scholastic now the “big 2” of the industry overall? Or do Marvel’s and DC’s direct market sales still put them on top?
At any rate, it seems like we’re in for an interesting and diverse few decades of sequential art as today’s kids grow up and start writing their own stuff.
@Daniel T: Like it says in the article, the two best selling Marvel Omnibi sells around 3k into the book market. The rest sell much worse…. but they become some of the highest amount of (at least) wholesale dollars because of their cover price.
@scott J: you’d have to ask DC or Marvel, since all Direct Market Marvel and DC sales have become completely opaque since they left Diamond. I assume that this means that their sales are worse then ever, since they don’t want anyone to know about them, but that’s pure conjecture.
-B
DC had record dollars in publishing last year. Marvel I do not own enough Disney Stock to see the numbers. Disney may not break them down as WB/Discovery does for stockholders with 1% holdings. And no, stockholders are not allowed to release the report, unless they want to pay, a major penalty and maybe even, stripped.
Assertions without public evidence, however, are not journalistically responsible things to report on. Further, just making more money than last year isn’t actually a meaningful statement unless one can show that is is both sustainable and repeatable. I, for one, don’t think that any publishing plan that appears to depend on Variant Covers to be a smart course of action for a Marvel or DC when the actual number of readers is declining year over year.
-B
Comments are closed.