

By Brian Hibbs
“There are three kinds of lies: Lies, Damned Lies, and Statistics”
It’s time to look at graphic novel sales in 2018. Implausibly, this is the sixteenth annual report of something that is hard to exactly perceive and understand: the size and shape of the sales of graphic novels and trade paperbacks through the book store market, as seen through the prism of BookScan.
To read about our methodology, what Bookscan measures, and other technical details of how these reports have been made, you can go to the end of the piece, Bookstores that have POS systems are able to report their sales to BookScan, a subsidiary of The NPD Group (they bought it from Nielsen).
BookScan tracks the specific sales to consumers through its client stores. I had several well trained spies who have, for many years, provided me with access to the BookScan reports at the end of each year. However, I am very excited to say that we are now getting the BookScan reports directly from The NPD Group, with no filter or middleman! This is our second year of doing so.
However, getting “official” detail has brought a major change this year: NPD Group no longer wants us releasing the complete data in chart form, although we are allowed to quotes numbers. Even the pretty tight “Top 750” as has been our historical practice, will no longer include total sales outside the top 20. I am fairly certain that, if you know how to search the internet, you could probably turn up previously published links from 2003 through 2017, but going forward, you will have to trust my abstract of the charts, rather than seeing the charts themselves. So sorry!
(For points of comparison, try these links to the earlier pieces:
2017: My Analysis
2016: My Analysis
2015: My Analysis
2014: My Analysis
2013: My Analysis
2012: My Analysis
2011: My Analysis
2010: My Analysis
2009: My Analysis
2008: My Analysis
2007: My Analysis
2006: My Analysis
2005: My Analysis
2004: My Analysis
2003: My Analysis)
2018 Overview
The main thing that has to be done in editing the data I am sent is removing all of the things that are not comics. I literally hand-checked thousands of items against Amazon’s “Look Inside” feature” to say “is this a comic or not?” I defined “comics” like this: either a) it has multiple panels sequentially producing a narrative (those don’t have to be on ONE PAGE, so someone like Mo Williams is certainly comics) OR b) a single image that, taken entirely by itself, provides a complete thought. So, “The Far Side” is comics, but, no, “Diary of a Wimpy Kid” is NOT (but very glad to see that number as a comparative)
Using my new working definition, I have decided to cut some items that had previously been kept in: chief among those is Rachel Renee Russell’s “Dork Diaries” – they have words, they have pictures, but they don’t work together in the way I’d think we’d commonly agree is “comics”. I also removed prose-driven books like DK Publishing’s “Marvel Encyclopedia”, which, while nominally about comics or comics culture, is factually an encyclopedic prose book with pictures. Or “Wonder Woman: Warbringer” which is a straight-up prose novel that happens to feature a comics character, or “DC Super Heroes: My First Book of Girl Power” where the Amazon “Look Inside” clearly shows is an illustrated reader for 2nd graders. There is clearly an enormous market for this kind of material – in fact, in many cases a larger market than for the actual comics themselves – it just isn’t the “comics” market, as I would define it.
Here’s the big picture for just the Top 750 in 2018:
| Year | Total Unit | Growth | Calculated Retail Value | Growth |
| 2003 | 5,495,584 | ——- | $66,729,053 | ——– |
| 2004 | 6,071,123 | 10.5% | $67,783,487 | 1.6% |
| 2005 | 7,007,345 | 15.4% | $75,459,669 | 11.3% |
| 2006 | 8,395,195 | 19.8% | $90,411,902 | 19.8% |
| 2007 | 8,584,317 | 2.3% | $95,174,425 | 5.3% |
| 2008 | 8,334,276 | -2.9% | $101,361,173 | 6.5% |
| 2009 | 7,634,453 | -8.4% | $93,216,014 | -8.0% |
| 2010 | 6,414,336 | -15.9% | $85,266,166 | -8.5% |
| 2011 | 5,696,163 | -11.2% | $79,961,951 | -6.2% |
| 2012 | 5,438,329 | -4.53% | $89,918,354 | 12.45% |
| 2013 | 5,654,351 | 3.97% | $96,062,709 | 6.83% |
| 2014 | 6,659,031 | 17.77% | $112,768,709 | 17.39% |
| 2015* | 8,762,983 | 31.60% | $141,226,518 | 25.24% |
| 2016* | 9,967,907 | 13.75% | $159,510,075 | 12.95% |
| 2017 | 10,310,682 | 3.44% | $154,026,517 | -3.44% |
| 2018 | 11,755,903 | 14.02% | $165,885,527 | 7.70% |
 I would categorize this as excellent year-over-year growth in the category, for sure – “comics” have nearly doubled in strength over the last 5-7 years.
I want to remind you that while I asterisk 2015-2016 in terms of the sheer number of data points that I was getting was probably edited, it appears to be that the top 750 itself was fairly rock solid.
The trend for print books in general (not just looking at comics) through bookstores, according to the NPD group and BookScan appears to be a general growth of 1.3% in 2018, while the US Census Bureau According to Bookscan data, comics/graphic novels are outperforming the rest of the market and were up 7.5% in units from 2018 over 2017.
(For what it is worth, overall book [only] sales through Diamond in the Direct Market appear to be down by about 8%, (in dollars, ComicChron isn’t calculating pieces here) so the book market performed significantly better in the book category. Diamond only directly reports the Top 300 best-sellers each month, and those Top 300s in the DM sum up to $73.56m worth of books sold, though obviously there’s a LOT of periodicals on top of that [another $319m]. Deep deep into the micro, my own individual sales in the book category were down about 5.4% in dollars at my main store in 2018.)
As I noted in the intro boilerplate, I primarily write about the top 750 because a) that’s all the data I was initially leaked back in 2003, b) it’s a “manageable” chunk of data, and c) “as above, so below” – the top 750 represents about half of sales. However, since 2007, I’ve received the “entire” database, which now gives us a solid ten years of data to track. Sometimes we refer to this as “the Long Tail”.
Here’s what the sales of all comics sales BookScan tracks in this category looks like – but, seriously, let me remind you that the dataset changes enough each year this is a kind of meaningless set of comparisons! Even putting aside “the asterisk years”, prior to 2013 this didn’t include Walmart, for just one example of the lack of direct comparison.
| Year | # of listed items | Percent Change | Total Unit Sold | Percent Change | Calculated Retail Value | Percent Change | Av. Sale per title | Av $ per title |
| 2007 | 13,181 | —– | 15,386,549 | —– | $183,066,142 | —– | 1167 | $13,888.64 |
| 2008 | 17,571 | 24.98% | 15,541,769 | 1.00% | $199,033,741 | 8.02% | 885 | $11,327.40 |
| 2009 | 19,692 | 12.07% | 14,095,145 | -9.31% | $189,033,736 | -5.02% | 716 | $9,599.52 |
| 2010 | 21,993 | 11.68% | 12,130,232 | -13.94% | $172,435,244 | -8.78% | 552 | $7,840.32 |
| 2011 | 23,945 | 8.88% | 11,692,058 | -3.61% | $175,634,490 | 1.86% | 488 | $7,334.91 |
| 2012 | 23,365 | -2.42% | 9,562,236 | -18.22% | $164,415,366 | -6.39% | 409 | $7,036.82 |
| 2013 | 24,492 | 4.82% | 10,153,628 | 6.18% | $176,419,370 | 7.30% | 415 | $7,325.63 |
| 2014 | 26,976 | 10.14% | 11,820,324 | 16.41% | $207,598,355 | 17.67% | 438 | $7,695.56 |
| 2015* | 22,431 | -16.85% | 15,269,550 | 29.18% | $259,807,532 | 25.15% | 681 | $11,582.52 |
| 2016* | 21,295 | -5.06% | 17,302,891 | 13.32% | $293,583,180 | 13.00% | 813 | $13,786.48 |
| 2017 | 35,338 | 65.95% | 18,385,086 | 6.25% | $302,300,435 | 2.97% | 520 | $8,554.54 |
| 2018 | 38,424 | 8.73% | 19,965,469 | 8.60% | $318,345,707 | 5.31% | 520 | $8,855.07 |
Overall, this is out Topline conclusion for BookScan 2018: Up 9% in total books listed, up 9% in Units Sold, and up 5% in the calculated retail value if all books sold for cover price (they didn’t, not in the “bookstore” market)
Let’s take a look at the Top 20 best-selling graphic novels on the 2018 chart; it looks like this, including sales
| DOG MAN AND CAT KID | PILKEY, DAV | 716,647 |
| DOG MAN: LORD OF THE FLEAS | PILKEY, DAV | 692,576 |
| DOG MAN | PILKEY, DAV | 317,157 |
| DOG MAN UNLEASHED | PILKEY, DAV | 317,093 |
| DOG MAN: A TALE OF TWO KITTIES | PILKEY, DAV | 314,950 |
| DOG MAN: BRAWL OF THE WILD | PILKEY, DAV | 199,755 |
| DRAMA | TELGEMEIER, RAINA | 174,550 |
| SMILE | TELGEMEIER, RAINA | 149,751 |
| SISTERS | TELGEMEIER, RAINA | 132,812 |
| THE BABY-SITTERS CLUB: DAWN AND THE IMPOSSIBLE THREE | MARTIN, ANN M. | 112,054 |
| GHOSTS | TELGEMEIER, RAINA | 108,797 |
| KRISTY’S BIG DAY | MARTIN, ANN M. | 108,164 |
| KRISTY’S GREAT IDEA: FULL-COLOR EDITION (THE BABY-SITTERS CLUB GRAPHIX #1) | MARTIN, ANN M. | 101,250 |
| THE ADVENTURE ZONE: HERE THERE BE GERBLINS | MCELROY, CLINT | 94,434 |
| POPULARMMOS PRESENTS: A HOLE NEW WORLD | POPULARMMOS | 93,332 |
| POSITIVELY IZZY | LIBENSON, TERRI | 90,587 |
| SUPERNOVA | KIBUISHI, KAZU | 87,628 |
| BIG NATE: SILENT BUT DEADLY | PEIRCE, LINCOLN | 84,005 |
| PHOEBE AND HER UNICORN (PHOEBE AND HER UNICORN SERIES BOOK 1) | SIMPSON, DANA | 82,225 |
| THE DRAGONET PROPHECY | SUTHERLAND, TUI T. | 80,681 |
Nineteen of the twenty are aimed at younger readers – only “The Adventure Zone” breaks through the kids-orientation. The first Manga book in the charts isn’t until #25 (“My Hero Academia v1”) and the first Superhero comic comes in at #29 (“The Infinity Gauntlet”)
Clearly, Dav Pilkey and his “Dog Man” series of books are the current Rulers of comic sales in the bookstores. What’s critical to remember about this is that Scholastic is also presumably selling a metric shedload of these books through the Scholastic Book Fairs, to elementary and middle school libraries, and any number of other places that don’t report to BookScan. This here is just the tip of the iceberg.
So strong is Pilkey’s hold on the current charts that he takes the first Six spots on the charts. The #1 best-seller (“Dog Man and Cat Kid”) sells almost 717k copies. No, that’s not a misprint – almost three quarters of a million copies are sold through BookScan reporters.
At #2 is “Lord of the Fleas” (693k), #3 is v1 just titled “Dog Man” (317k), #4 is “Unleashed” (317k), #5 is “A Tale of Two Kitties” (315k), and #6 is “Brawl of the Wild” with just under 200k copies sold. Any one of those, in any other year, would be an insanely high number by itself – add them all together and you have 2.6 million copies of one single series sold in one single year.
Let’s underline just how insane this is: these six volumes together represent thirteen percent of all comics sold through BookScan.
 If Pilkey is the current King of comics sales, then the Queen can’t be anyone other than Raina Telgemeier, because her books take up the next swath, including #7, “Drama” (175k), #8 with “Smile” (150k), #9 with “Sisters” (133k), #11 with Ghosts (109k), and #13 with v1 of “The Baby-sitter’s Club” adaptations for 101k.
The only thing that breaks these two author’s hold on the top 10 is also a “Baby-Sitter’s Club” adaptation, this time from Gale Galligan where v5 (“Dawn and the Impossible Three”) is #10 with 113k sold. Galligan is also spot #12 with “Kristy’s Big Day”, which comes in at 108k.
This also means that publisher Scholastic has completely locked up the first thirteen spots of the charts – an unprecedented achievement in all of the time we’ve tracked these things.
Coming in at #14 is the first book aimed at adults “The Adventure Zone: Here There Be Gerblins” by the McEllroy’s, featuring a new adventure spinning out of their extremely popular D&D-based podcast. They rack up 94k copies sold of the book.
Then the next five slots get back to nothing but kid’s comics — #15 is something I previously knew nothing about: a Minecraft-based comic (but illustrated, not screencapped) “PopularMMOs Presents: A Hole New World” which sells 93k copies.
#16 is “Positively Izzy” by Terri Libenson (91k), #17 is the eight volume of Kazu Kibuishi’s “Amulet:, “Supernova” (88k), #18 is Lincoln Peirce’s “Big Nate” in “Silent But Deadly” (84k), #19 is v1 of Dana Simpson’s “Pheobe and Her Unicorn” (82k), and #20 is the first volume of the “Wings of Fire” adaptation: “The Dragonet Prophecy” (81k)
If I were you, I would consider the fact that not one of these books was created “for” the traditional Direct Market audience, and that the DM (as represented by Diamond at least) does a mediocre job stocking or selling any of these books – in fact, of the top 500 DM best-sellers in 2018, only two of the BookScan top 20 even appear at all – “The Adventure Zone” at #144 (4k copies) and “Amulet v8” way down at #309 (2800 copies). And there is at least one (“PopularMMOs Presents: A Hole New World”) that has never been carried by Diamond at all.
How about if we sort things by author? Here are people who sold more than 100k copies in the Top 750:

These eighteen people represent fifty-eight percent of sales in the Top 750!
What you can take from this is that only a small number of creators drive the majority of the business in comics (and books in general, I think); and conversely, this probably means that the numerical majority comics aren’t actually significantly profitable any given year.
Let’s switch our attention to looking how publishers performed.
As a way to make the publisher breakdowns more readable, I split the chart into “eastern” (Manga) and “western” comics, because I think there are a few clear market distinctions between those categories. So, without further ado:
2018 Manga
Overall sales are up a bit for the Manga category in 2018 – about 8% in pieces within the Top 750, and just over 1% in calculated dollars.
Here’s a year-to-year comparison chart for the Top 750:
| Year | # of placing titles | Unit sales | Calculated Retail Value |
| 2003 | 447 | 3,361,966 | $34,368,409 |
| 2004 | 518 | 4,603,558 | $45,069,684 |
| 2005 | 594 | 5,691,425 | $53,922,514 |
| 2006 | 575 | 6,705,624 | $61,097,050 |
| 2007 | 575 | 6,837,355 | $61,927,238 |
| 2008 | 514 | 5,624,101 | $53,033,579 |
| 2009 | 451 | 4,414,705 | $41,068,604 |
| 2010 | 436 | 3,117,019 | $30,212,561 |
| 2011 | 392 | 2,627,570 | $27,017,081 |
| 2012 | 367 | 1,908,186 | $21,324,368 |
| 2013 | 315 | 1,665,487 | $21,256,777 |
| 2014 | 271 | 1,748,185 | $22,601,720 |
| 2015* | 279 | 2,033,534 | $26,191,474 |
| 2016* | 311 | 2,629,366 | $35,915,488 |
| 2017 | 284 | 2,427,380 | $35,433,489 |
| 2018 | 299 | 2,641,158 | $35,955,537 |
All three indicators are up for the category in 2018, but things are still far from their heights ten years ago. In part this is likely driven by the near-exclusive domination of series in the manga world – when there’s not a strong anime driving sales, manga tankobon series start to perform more like periodicals than books (albeit over a much wider horizon); rather than building a strong core backlist that sells forever, year-in-and-year out, manga tends instead to ebb and flow with culture and fashion.
Being “hit driven” in that manner makes things a bit more volatile in the manga space, and a single hit can have an outsized impact on sales. This year’s “It” manga was clearly “My Hero Academia”, with v1 being the year’s best-selling volume of manga, hitting just under 61k. Compare that to 2017’s winner, “Tokyo Ghost” – in 2017 the first volume of that only sold a bit over 34k, a pretty large difference. “My Hero Academia” has seven volumes that exceeded 30k in 2018 – the only series to cross that particular “band”, and every volume of the series (including the spinoff “My Hero Academia: Vigilantes”) places within the top 750; with none doing under approximately 12k in unit sales.
In fact, the success of “My Hero Academia” means that roughly one-in-five manga books sold in 2018, within the Top 750, was a volume of this series.
One other thing that the nature of multi-book series means that there tends to be less diversity overall in what’s being promoted – of the 299 different “manga” books, I only counted only eighty-one distinct “series” this year. This is down from eighty-four in 2017.
Manga, as a category, has a “long tail”, where we’re looking at all sales for the year, and not just within the Top 750 best-sellers:
| Year | # of listed items | Percent Change | Total Unit Sold | Percent Change | Calculated Retail Value | Percent Change | Av. Sale per title | Av $ per title |
| 2007 | 6231 | —— | 11,323,487 | —— | $108,770,537 | —– | 1817 | $17,456 |
| 2008 | 7842 | 20.54% | 10,173,091 | -11.31% | $100,800,283 | -7.91% | 1297 | $12,854 |
| 2009 | 8756 | 11.66% | 8,148,490 | -19.90% | $81,770,442 | -18.78% | 931 | $9,339 |
| 2010 | 8764 | —— | 6,239,725 | -23.42% | $67,092,668 | -17.95% | 712 | $7,655 |
| 2011 | 8991 | 2.59% | 5,690,327 | -8.80% | $62,810,728 | -6.38% | 633 | $6,986 |
| 2012 | 6332 | -29.57% | 3,510,057 | -38.32% | $40,943,613 | -34.81% | 554 | $6,466 |
| 2013 | 7024 | 10.93% | 3,516,208 | 0.01% | $44,651,823 | 9.06% | 501 | $6,357 |
| 2014 | 7452 | 6.09% | 3,914,385 | 11.32% | $51,557,925 | 15.47% | 525 | $6,919 |
| 2015* | 4412 | -40.79% | 4,580,434 | 17.02% | $62,253,624 | 20.75% | 1038 | $14,110 |
| 2016* | 4968 | 12.60% | 5,821,892 | 27.10% | $81,314,479 | 30.62% | 1172 | $16,368 |
| 2017 | 10,248 | 106.8% | 5,865,412 | 0.75% | $85,581,224 | 5.25% | 572 | $8,351 |
| 2018 | 10,839 | 5.77% | 6,100,260 | 4.00% | $87,421,299 | 2.15% | 563 | $8,065 |
I want to make sure that you’ve read all of the methodology to understand what you’re seeing in this chart, and the ones below. It’s really clear that my ’15 and ’16 data was incomplete now! It appears to be on the lower end of the charts – the “onesie, twosie” sellers – which leads me to conclude that my giver did some level of “currently in print?” pass those years. Thankfully, that’s no longer a problem.
Without “My Hero Academia” turning into a broad hit in 2018, the bottom line “long tail” numbers for the category would likely have gone negative.
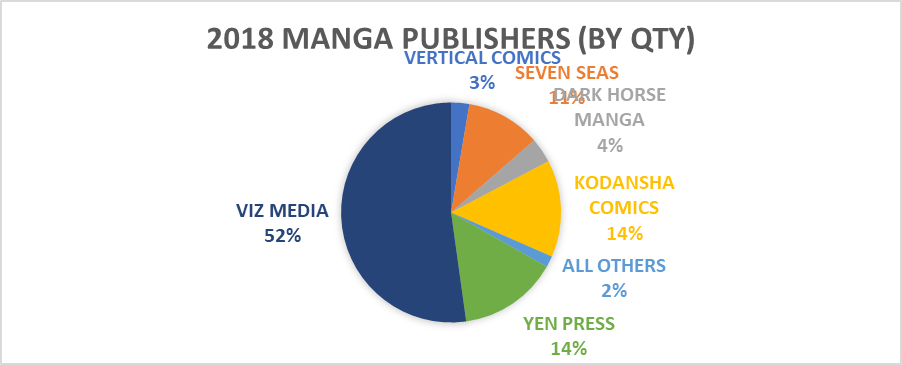 When you start breaking down the manga portion of the chart by publisher, there’s really not any contest at all: there’s a hundred-pound gorilla, and a bunch of smaller houses struggling in their shadow. This chart represents all 10,839 books that are “manga” in BookScan in 2018
Within the Top 750, the picture is very similar: The #1 publisher is Viz who takes 179 of the 299 manga spots in the Top 750, once again keeping them as the overwhelmingly dominant manga player with nearly sixty percent of the placing titles! Within the Top 750, Viz charted about 1,891,034 pieces, for almost $25 million of calculated retail dollars – this is another year of strong growth for Viz, up roughly 21% from the previous year in pieces placed.
Viz controls the manga charts as they have for a very long time now. It is nearly impossible envisioning anyone really challenging them substantially for that role because they are closing on being four times larger than their nearest competitor in their segment (!) Just to give you a sense of scale here, while every manga competitor places at least one book selling over 10k, not one of them sells over 15k. Meanwhile, Viz has thirty-nine releases that sold over 15k.
As noted, Viz’s #1 Best-seller is “My Hero Academia” – v1 sells about 61k, v2 is at 42k, and it has five more volumes that place over 30k, and seven more after that which beat 20k. All sixteen volumes make the Top 750, as do both volumes of the spinoff series “My Hero Academia: Vigilantes”. Nothing sells under 12k, and even that one only had a bare two months of release. Eight of Viz’s Top 10 are “MHA”, as are fourteen of the Top 20. It’s a success, selling nearly a half-million books combined this year! This is dramatically up from about 134k combined in 2017.
Viz’s second best-selling series is “Legend of Zelda: Twilight Princess v3” coming a bit under 29k. The other three volumes of the sub-series all sell something pretty close to 17k, while nine “Zelda” books place in the Top 750 altogether, totaling a bit more than 125k pieces.
Viz’s third best-seller (coming in at #10 for overall manga sales) is “Tokyo Ghoul” at a bit under 28k. This is down from 34k in 2017 when it was the #1 manga of the year (and it did 54k in 2016). If you include the spin-off series of “Tokyo Ghoul: RE”, all twenty-three different volumes of the series place within this year’s Top 750, summing to over 261k in unit sales (down from 272k in 2017)
Fourth for Viz (#13 in overall manga sales) is RWBY, with a hair under 25k. Four volumes of this series place in the Top 750, summing to a bit over 64k
At fifth for Viz is “Splatoon” (nearly 21k for v1, #15 best-selling manga overall). Five volumes chart for almost 60k in combined sales.
At sixth is “Dragon Ball Super v2”, also selling close to 21k (#17 best-selling manga overall) – between the three different series, “Dragon Ball” places eleven volumes in the Top 750, totally a bit over 100k.
And “bringing up the rear” (as the #20 manga overall) is “One Punch Man”, with v13 racking up 20k sold. There are fourteen volumes of “One Punch Man” in the Top 750, selling a combined 141k copies.
Also worth mentioning for Viz is the success of the Junji Ito books – “Uzumaki” comes in at #26 with 18k copies sold, while “Shiver” does about 17k at #32. Other books selling over 10k include “Death Note” (v1 of the “black edition” does nearly 17k), “Assassination Classroom” (v1 does almost 15k), Naruto (v1 of the 3-in-1 edition does about 14k), “Fullmetal Alchemist” (v1, also of the 3-in-1 editon, does about 13k), as well as “Super Mario Adventures” (just under 13k), and, of course, “Pokemon” with 12k of $55 (!) boxed set of “Red & Blue”
Let’s take a look at the “long tail” of Viz?
| Year | # of listed items | Percent Change | Total Unit Sold | Percent Change | Calculated Retail Value | Percent Change | Av. Sale per title | Av $ per title |
| 2007 | 2018 | —— | 6,249,324 | —— | $55,123,347 | —– | 3097 | $27,315.83 |
| 2008 | 2447 | 21.26% | 5,536,286 | -11.41% | $50,311,791 | -8.97% | 2263 | $20,560.60 |
| 2009 | 2793 | 14.14% | 4,819,407 | -12.95% | $44,310,790 | -11.93% | 1726 | $15,864.94 |
| 2010 | 3088 | 10.56% | 3,576,671 | -25.79% | $35,041,305 | -20.92% | 1158 | $11,347.57 |
| 2011 | 3393 | 9.88% | 3,276,297 | -8.40% | $32,766,960 | -6.49% | 966 | $9,657.22 |
| 2012 | 3518 | 3.68% | 2,099,560 | -35.92% | $22,433,721 | -31.54% | 597 | $6,376.84 |
| 2013 | 3636 | 3.35% | 1,853,211 | -11.73% | $21,586,923 | -3.77% | 510 | $5,937.00 |
| 2014 | 3765 | 3.55% | 1,855,161 | 0.11% | $22,732,074 | 5.30% | 493 | $6,037.74 |
| 2015* | 2264 | -39.87% | 2,150,656 | 15.93% | $28,134,971 | 23.77% | 950 | $12,427.11 |
| 2016* | 2405 | 6.23% | 2,811,978 | 30.75% | $38,854,681 | 38.10% | 1169 | $16,155.79 |
| 2017 | 4443 | 84.74% | 2,958,351 | 5.21% | $41,594,729 | 7.80% | 666 | $9,361.86 |
| 2018 | 4637 | 4.37% | 3,184,274 | 7.64% | $44,423,434 | 6.80% | 687 | $9,580.21 |
Their long tail is outpacing the front of the market, which is a perfectly fine place to be. Viz in 2018 has one book over 60k, another over 40k, five more over 30k, thirteen more over 20k, and thirty-eight more over 10k. I’d call that a healthy midlist.
In second place among manga publishers, we have Kodansha Comics, which places forty-four titles within the top 750, with 284k in sales, and $3.6 million in calculated retail dollars (compared to 348k and $5.4m in 2017, and 469k and $5.6m in 2016). Kodansha’s performance in the Top 750 accelerates their decline of the last few years.
Kodansha’s licenses formerly were both the original backbone of Tokyopop, as well as being the majority of Del Rey Manga. Kodansha pulled Tpop’s license in March of ’09 and Del Rey in October of ’10. You may want to look at those publisher’s listings below to get a better historical overview.
Kodansha’s current best-seller is “Fairy Tail”, where v1 is at just under 15k (this was 17k last year). As there are an astounding sixty-four volumes of this series in print, but only five of those are in the Top 750, this continues to be a clear example of the “Hammock Principle” in practice. Briefly stated, books in a series generally sell in a sales pattern that looks like a hammock if you chart it out: the first few volumes and the last few volumes sell the best, with the ends running down into the middle volumes which have the lowest sales, like the sagging part of a hammock. The problem with this, as both stores that don’t have infinite rack space, as well as publishers that need a certain volume and velocity to keep things in print, that sagging middle becomes unsustainable for most series over time, and stores start to only carry the first and last few volumes – See also, “The Walking Dead” in a bit.
Coming in at #2 for Kodansha is v1 of the smaller inexpensive version of “Sailor Moon” – it sells almost 13k copies. The bigger, thicker editions also charts, with v1 there doing a bit under 7k
At #3 & 4 is “Attack on Titan”, where v 1 drops to under 12k in 2018 – this volume did around 19k in 2017, 26k in 2016 and 34k in 2015. “Attack” is clearly a weakening brand, with just ten of the twenty-six volumes from the main series placing into the Top 750 – twenty-three of them placed in 2017.
And for #5, and their last book to chart over 10k copies, is “Wotakoi: Love is Hard for Otaku”
These Long Tail figures are just for Kodansha-published titles, and they reflect that Kodansha, itself, first started publishing in 2010:
| Year | # of listed items | Percent Change | Total Unit Sold | Percent Change | Calculated Retail Value | Percent Change | Av. Sale per title | Av $ per title |
| 2010 | 9 | —— | 13,291 | —— | $322,717 | —— | 1477 | $35,857.44 |
| 2011 | 108 | 1200.00% | 197,021 | 1482.36% | $2,537,221 | 786.21% | 1825 | $23,492.79 |
| 2012 | 246 | 127.78% | 324,827 | 64.87% | $4,026,770 | 58.71% | 1320 | $16,368.98 |
| 2013 | 320 | 30.08% | 501,554 | 54.41% | $6,299,487 | 56.44% | 1567 | $19,685.90 |
| 2014 | 442 | 38.13% | 821,298 | 63.75% | $10,481,008 | 66.38% | 1858 | $23,712.69 |
| 2015* | 455 | 2.94% | 855,347 | 4.15% | $10,938,531 | 4.37% | 1880 | $24,040.73 |
| 2016* | 587 | 29.01% | 981,386 | 14.74% | $12,596,281 | 15.16% | 1672 | $21,458.74 |
| 2017 | 895 | 52.47% | 917,596 | -6.50% | $13,616,224 | 8.10% | 1025 | $15,213.66 |
| 2018 | 1060 | 18.44% | 870,940 | -5.08% | $12,612,501 | -7.37% | 822 | $11,898.59 |
In 2018, Kodansha has just five titles that sell over 10k.
The #3 manga publisher as represented by the BookScan Top 750 is Seven Seas, which places 32 titles for almost 199k copies sold combined, and a bit over $3 million in calculated retail value. This is a strong rise over 2017 when they had 20 titles, for 162k and $2.5 million in sales.
Seven Seas’ main success is “The Ancient Magus’ Bride”, with v1 selling nearly 12k copies, and v8 hitting 11k (the “hammock”, remember?) – all nine volumes in the series chart, for a bit over 62k combined.
Also just a bit under 10k is “My Lesbian Experience With Loneliness”, a book my stores have done extremely well with, usually turning a copy every other week.
Seven Seas’ Long Tail shows them with a very strong growth this year.
| Year | # of listed items | Percent Change | Total Unit Sold | Percent Change | Calculated Retail Value | Percent Change | Av. Sale per title | Av $ per title |
| 2007 | 54 | —— | 50,641 | —— | $558,450 | —– | 938 | $10,341.67 |
| 2008 | 76 | 41.74% | 80,112 | 58.20% | $833,667 | 49.28% | 1,054 | $10,969.30 |
| 2009 | 97 | 27.63% | 74,967 | -6.42% | $807,666 | -3.12% | 773 | $8.326.45 |
| 2010 | 93 | -4.12% | 75,764 | 1.06% | $875,612 | 8.41% | 815 | $9,415.18 |
| 2011 | 118 | 26.88% | 116,360 | 53.58% | $1,426,618 | 62.93% | 986 | $12,089.98 |
| 2012 | 151 | 27.97% | 124,262 | 6.79% | $1,684,994 | 18.11% | 823 | $11,158.90 |
| 2013 | 223 | 47.68% | 204,419 | 64.51% | $2,942,608 | 74.64% | 917 | $13,195.55 |
| 2014 | 300 | 34.53% | 284,484 | 39.17% | $3,979,338 | 35.23% | 948 | $13,264.46 |
| 2015* | 304 | 1.34% | 374,715 | 31.72% | $5,177,568 | 30.11% | 1233 | $17,031.47 |
| 2016* | 417 | 37.17% | 491,947 | 31.29% | $6,960,634 | 34.44% | 1180 | $16,692.17 |
| 2017 | 554 | 32.85% | 478,336 | -2.77% | $6,801,527 | -2.29% | 863 | $12,277.12 |
| 2018 | 906 | 63.54% | 667,556 | 39.56% | $9,511,591 | 39.84% | 737 | $10,498.45 |
Seven Seas has just two titles that sell over 10k.
The fourth largest publisher of manga in 2017, on the Top 750 of BookScan is Yen Press, which once again places 27 titles in the Top 750, for about 159k copies sold (down from 165k copies sold last year), and nearly $2.4 million of calculated retail gross (down from $2.6 million retail gross last year). Yen is a division of Hachette (more on them later).
Yen’s sole significant seller is “Black Butler”, where v1 brings in just a hair under 11k in the bookstore market. They sell nothing else over 10k.
In the Long Tail Yen is down for the second year in a row.
| Year | # of listed items | Percent Change | Total Unit Sold | Percent Change | Calculated Retail Value | Percent Change | Av. Sale per title | Av $ per title |
| 2007 | 10 | —— | 12,896 | —— | $147,449 | —– | 1,290 | $14,744.90 |
| 2008 | 90 | 800.00% | 110,126 | 753.95% | $1,237,860 | 739.52% | 1,224 | $13,754.00 |
| 2009 | 211 | 134.44% | 330,962 | 200.53% | $3,697,113 | 198.67% | 1,569 | $17,521.86 |
| 2010 | 344 | 63.03% | 560,983 | 69.50% | $6,650,871 | 79.89% | 1,680 | $19,333.93 |
| 2011 | 460 | 33.72% | 764,125 | 36.21% | $9,953,966 | 49.66% | 1,661 | $21,639.06 |
| 2012 | 548 | 19.13% | 647,948 | -15.20% | $8,735,264 | -12.24% | 1,182 | $15,940.26 |
| 2013 | 654 | 19.34% | 692,380 | 6.86% | $9,715,421 | 11.22% | 1,059 | $14,855.38 |
| 2014 | 776 | 18.65% | 682,135 | -1.48% | $9,985,502 | 2.78% | 776 | $12,867.92 |
| 2015* | 649 | -16.37% | 917,620 | 34.52% | $13,248,445 | 32.68% | 1414 | $20,413.63 |
| 2016* | 793 | 22.19% | 1,072,008 | 16.82% | $15,520,207 | 17.15% | 1352 | $19,571.51 |
| 2017 | 1403 | 76.92% | 928,962 | -13.34% | $13,866,675 | -10.65% | 662 | $9,883.59 |
| 2018 | 1737 | 23.81% | 890,228 | -4.17% | $13,051,751 | -5.88% | 513 | $7,513.96 |
Yen Press has only one title selling over 10k copies in 2018
Staying as the #5 manga publisher is Dark Horse, with only thirteen placing titles in the Top 750, for almost 80k copies sold and $1.2m in calculated retail value (that’s down from last year)
The best-selling DH title continues to be “Berserk” v1, scoring just under 14k copies sold.
Looking at the Long Tail, this is what Dark Horse’s (manga only!) recent performance looks like – it’s down, but after three strong years of growth, it’s probably fine. There is much more on Dark Horse down below in the “Western Publishers” section.
| Year | # of listed items | Percent Change | Total Unit Sold | Percent Change | Calculated Retail Value | Percent Change | Av. Sale per title | Av $ per title |
| 2007 | 341 | —— | 249,943 | —— | $3,329,464 | —– | 733 | $14,744.90 |
| 2008 | 420 | 23.17% | 248,981 | -0.38% | $3,176,870 | -4.58% | 593 | $7,563.98 |
| 2009 | 455 | 8.33% | 226,497 | -9.03% | $2,915,693 | -8.22% | 498 | $6,408.12 |
| 2010 | 473 | 3.96% | 194,494 | -14.13% | $2,633,077 | -9.69% | 411 | $5,566.76 |
| 2011 | 497 | 5.07% | 189,329 | -2.66% | $2,602,230 | -1.17% | 381 | $5,235.86 |
| 2012 | 493 | -0.80% | 112,373 | -40.65% | $1,631,038 | -37.32% | 228 | $3,308.39 |
| 2013 | 521 | 5.68% | 103,538 | -7.86% | $1,678,563 | 2.91% | 199 | $3,221.81 |
| 2014 | 559 | 7.29% | 100,894 | -2.60% | $1,617,251 | -3.65% | 180 | $2,893.11 |
| 2015* | 303 | -45.80% | 135,444 | 34.24% | $2,238,167 | 38.39% | 447 | $7,386.69 |
| 2016* | 225 | -25.74% | 174,298 | 28.69% | $2,291,355 | 2.38% | 775 | $10,183.80 |
| 2017 | 527 | 234.22% | 238,089 | 36.60% | $3,795,506 | 65.64% | 452 | $7,202.10 |
| 2018 | 531 | 0.76% | 224,010 | -5.91% | $3,579,135 | -5.70% | 422 | $6,740.37 |
Dark Horse Manga has one book over 10k.
The sixth largest publisher of manga as measured by the BookScan, and the final one to appear in the Top 750, is Vertical. They place just four books into the Top 750, 28k copies, for $600k – that’s a big soften from the previous year.
Their best-seller is “The Complete Chi’s Sweet Home” with v1 selling just over 11k.
The Long Tail also declines
| Year | # of listed items | Percent Change | Total Unit Sold | Percent Change | Calculated Retail Value | Percent Change | Av. Sale per title | Av $ per title |
| 2007 | 25 | —— | 23,444 | —— | $417,914 | —— | 938 | $16,716.56 |
| 2008 | 34 | 36.00% | 21,003 | -10.41% | $343,109 | -8.21% | 617 | $10,091.44 |
| 2009 | 39 | 14.71% | 19,434 | -7.47% | $325,437 | -5.15% | 498 | $8,344.54 |
| 2010 | 62 | 58.97% | 33,097 | 70.30% | $494,098 | 51.83% | 534 | $7,969.32 |
| 2011 | 84 | 35.48% | 49,062 | 48.24% | $699,253 | 41.52% | 584 | $8,324.44 |
| 2012 | 118 | 40.48% | 45,026 | -8.23% | $671,086 | -4.03% | 382 | $5,687.17 |
| 2013 | 159 | 34.75% | 61,906 | 37.49% | $1,128,252 | 68.12% | 389 | $7,095.92 |
| 2014 | 187 | 17.61% | 83,312 | 34.58% | $1,491,984 | 32.24% | 446 | $7,978.53 |
| 2015* | 162 | -13.37% | 110,172 | 32.24% | $1,956,167 | 31.11% | 680 | $12,075.10 |
| 2016* | 185 | 14.20% | 172,792 | 56.84% | $2,931,568 | 49.86% | 934 | $15,846.31 |
| 2017 | 269 | 45.41% | 181,216 | 4.88% | $3,178,964 | 8.44% | 674 | $11,817.71 |
| 2018 | 339 | 26.02% | 162,840 | -10.14% | $2,784,106 | -12.42% | 480 | $8,212.70 |
Vertical has a single book over 10k
There’s only one other Manga title that places over 10k copies this year, this is from Ten Speed Press: “The Life Changing Manga of Tidying Up”, which sells just a hair over that 10k sold.
There is nothing else in the Top 750 that isn’t from one of the above publishers – it’s looking more like a closed system every year.
2018 Western Publishers
When I say “Western” here, I mean publishers/work from Europe and America, as opposed to Asia, not publishers of the genre of “western” comics!
I’d like to continue to remind you that back in 2008 there was some sort of behind-the-scenes recategorization in what got sent to me – I now know this is probably a change in BISAC codes! – and most of the “cartoon-strip humor” books like “Calvin & Hobbes” and “The Far Side” suddenly disappeared, so there’s kind of a not-strictly apples thing going on with the pre-2008 numbers here. Do keep that in mind when making comparisons both in the Top 750 chart, as well as the Long Tail.
BookScan itself does not try to control how data gets initially logged (or changed), leaving that all to publishers. I think that I understand this reasoning: the publisher is the customer, and they should have some level of control over how they are represented, but as a person who tries to decipher the data each year, I know that I would prefer some sort of internally-consistent (and externally-petionable!) method of categorizing titles that doesn’t seem to change in some fashion from year-to-year – Books will appear and disappear, almost seemingly willy-nilly, and it makes showing you anything even resembling consistent data staggeringly difficult. All of this is a function of how publishers assign BISACs and in what order – see the preamble above!
Another observation I have is that BookScan tracks (theoretically at least, since again, publishers set their own BISACs) Adult reading distinctly from YA and Kids. I don’t. Part of this is that I’m a bookseller, and I’m rather agnostic about who specifically buys books as a result. But I have to be certain to make this point as clearly as I can: the market for who is buying comics is changing, and it is changing for the wider and the better. The eight year old who is inhaling Dav Pilkey in 2018 is going to be the comics-literate adult of 2030 (or whatever), which is going to change what comics readers in the ‘30s will want or expect from comics. The kids reading comics in 1965 totally imagined what the 1980’s comics scene could and would be, which is why we’re where we are today, but the shape of the Western industry in the future is absolutely what today’s children read and see.
Ignore this at your peril.
OK, enough editorializing, let’s look at the market!
Here’s the Top 750 over time:
| Year | # of placing titles | Unit sales | Calculated Retail price |
| 2003 | 304 | 2,133,618 | $32,360,644 |
| 2004 | 233 | 1,467,535 | $22,713,802 |
| 2005 | 142 | 1,315,920 | $21,537,155 |
| 2006 | 174 | 1,689,571 | $29,314,852 |
| 2007 | 175 | 1,746,962 | $33,247,187 |
| 2008 | 236 | 2,710,175 | $48,327,594 |
| 2009 | 299 | 3,219,748 | $52,147,410 |
| 2010 | 314 | 3,297,317 | $54,515,605 |
| 2011 | 358 | 3,068,593 | $77,254,870 |
| 2012 | 383 | 3,530,143 | $68,593,986 |
| 2013 | 435 | 3,988,864 | $74,805,932 |
| 2014 | 479 | 4,910,846 | $90,166,989 |
| 2015* | 471 | 6,729,449 | $115,035,044 |
| 2016* | 439 | 7,338,541 | $123,594,588 |
| 2017 | 466 | 7,846,357 | $117,761,519 |
| 2018 | 451 | 9,114,745 | $129,929,990 |
Up 16% in pieces, up 10% in calculated retail dollars, the highest totals in this tranche that we have ever seen – it’s a very good year for Western comics, as reported to BookScan in 2018!
If we were to look at the entirety of BookScan’s reported numbers for the total 27,853 “Western” comics, things look generally like this – there are 1236 publishers listed in the 2018 chart, but only 13 of them manage to capture more than 1% of the market
This is not quite as lopsided as the Manga chart…. But it is getting there a little?
Let’s start with a look at the Long Tail for Western publishers collectively:
| Year | # of listed items | % Change | Total Pieces | % Change | Calculated Retail Value | % Change | Av. Sale per title | Av $ per title |
| 2007 | 6950 | — | 3,029,039 | — | $74,595,605 | — | 436 | $10,733.18 |
| 2008 | 9728 | 39.97% | 5,368,678 | 77.24% | $98,233,459 | 31.69% | 552 | $10,098.01 |
| 2009 | 10,936 | 12.30% | 5,946,595 | 10.76% | $107,263,294 | 9.19% | 544 | $9,808.27 |
| 2010 | 13,229 | 20.97% | 5,890,507 | -0.01% | $105,342,577 | -0.02% | 445 | $7,963.00 |
| 2011 | 14,954 | 13.04% | 6,001,731 | 1.89% | $112,823,763 | 7.10% | 401 | $7,544.72 |
| 2012 | 17,031 | 13.89% | 6,052,179 | 0.84% | $123,471,753 | 9.44% | 355 | $7,249.82 |
| 2013 | 17,468 | 2.57% | 6,637,420 | 9.67% | $131,767,547 | 6.72% | 380 | $7,543.37 |
| 2014 | 19,524 | 11.77% | 7,905,939 | 19.11% | $156,040,431 | 18.21% | 405 | $7,992.24 |
| 2015* | 18,019 | -7.71% | 10,689,116 | 34.44% | $197,553,909 | 26.60% | 593 | $10,963.64 |
| 2016* | 16,328 | -9.38% | 11,516,867 | 7.74% | $212,698,759 | 7.67% | 705 | $13,026.63 |
| 2017 | 25,183 | 54.23% | 12,544,715 | 8.92% | $217,360,776 | 2.19% | 498 | $8,631.25 |
| 2018 | 27,583 | 9.53% | 13,865,209 | 10.53% | $230,924,408 | 6.24% | 503 | $8,371.98 |
Fantastic collective performance, and one that really points out the errors in the ’15-’16 data – as noted above, I now believe that the leaked data those years was only for “in print” books. Comics are pretty clearly a growing medium, by like a million copies a year (!) Compare that first year of long-tail to the current one: more than 400% growth in pieces, wow!
The challenge for the market is for how we grow and adapt to the changes in taste that are becoming clear: “traditional” genres and sellers are starting to suffer in the face of a new widening of the market. From 20,000 feet this seems pretty healthy, even though it seems clear that every participant isn’t going to be able to thrive. We’ll cover that in the weeds, below!
Next, we’ll survey each of the publishers, and their best-selling titles, ranking them by the number of pieces they sold this year with the Top 750 of BookScan. We’ll also look at the “long tail” for each entry discussing the entirety of BookScan.
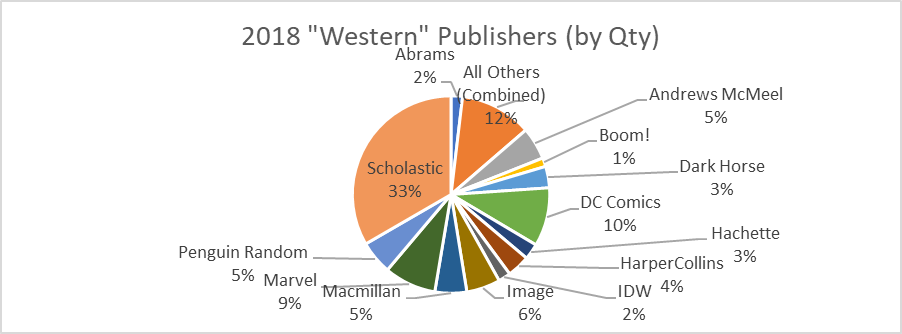
It is now the fourth year in the row that our #1 Western publisher in the Top 750 is Scholastic. This is no longer an amusing anomaly: this is the new reality. Look at the overall market, and pause and wonder at that dominating 33% market share of pieces sold. Consider for a moment that Scholastic has done this with only two hundred and twenty four books, total! Consider for a second moment that Scholastic only started “doing” comics in 2005.
Just limiting ourselves to the Top 750, Scholastic surges forward in sales this year by selling an absolutely staggering 4.5 million copies, from 58 placing books This is an unbelievable 67% growth from last year (2.7 million copies), which was up 42% from 2016 (1.9 million). In calculated retail dollars, we’re looking at almost $53 million dollars in sales.
This is even more incredible when you start to think that these are sales to book stores (and Amazon) only – none of these numbers (as far as I know) include the direct-to-families sales that happen via the incredibly successful Scholastic Book Fairs. Nor does this count any sales that are being done to elementary and middle school libraries, numbers that likely exceed retail sales. Possibly by a multiple.
Also consider that the next largest publisher sold a combined 661k copies, less than a sixth of their volume.
Scholastic has several imprints – besides the Graphix imprint, they also publish Arthur A. Levine and Blue Sky.
In alphabetical order by imprint:
Arthur A. Levine places one book into the Top 750 just as they have for years, and it’s the same book: just a bit over 9k copies of “The Arrival” by Shaun Tan.
Blue Sky is also just one book in the Top 750 – Dav Pilkey’s “Ook & Gluk, Kung-Fu Cavemen” shifting 27k copies, much of that on the sidestream of the success “Dog Man”.
The Graphix imprint has 43 placing titles, for just nearly 4.3m in sales, and is where the big hits live: the aforementioned “Dog Man” and all of Raina Telgemeier’s books (“Sisters”, “Smile”, “Drama”, and the first four “Baby Sitter’s Club” adaptations), all of which are discussed up top. “Dog Man” alone shifts nearly 2.7 million books, to recap. Telgemeier sells “only” 916k.
The post-Telgemeier “Baby Sitter’s Club” steamrolls without her – the two Gale Galligan-adapted books sell more than 220k copies.
Graphix also does fantastic with Kazu Kibuishi’s “Amulet” – volume 8, “Supernova” sells nearly 88k copies. All eight volumes of the series chart, as well as various permutations of box sets – which, can I tell you, are giant dollar generators for Scholastic: I calculate the box set of #1-7 alone generated more potential retail dollars than the release of v8. Altogether, nearly 302k copies of Amulet books are sold within the Top 750.
The first book of the adaptation of “Wings of Fire”, “The Dragonet Prophecy” flies in with almost 81k sold
They don’t quite make Scholastic’s Top 20, but Jennifer Holm’s “Sunny” books do excellent as well: selling a combined 66k copies between the two books. There’s also a notable launch of Jarrett Krosoczka’s “Hey Kiddo” at just over 21k, as well as Kristen Gudsnuk’s “Making Friends” at almost 17k
Jeff Smith’s “Bone”, which largely launched Graphix, places four of the nine volumes into the Top 750 this year. V1, “Out From Boneville”, sells almost 13k copies this year.
Scholastic also publishes as “Scholastic”, straight up, and they place 13 more titles that way. The big hit is more Dav Pilkey, as “The Adventures of Super Diaper Baby” roars back with some 41k copies sold, while Jeffrey Brown’s “Jedi Academy” books continue to score: the first volume of that perennial series sold about 22k copies this year
The Long Tail for Scholastic looks like this – more insane growth:
| Year | # of listed items | Percent Change | Total Unit Sold | Percent Change | Calculated Retail price | Percent Change | Av. Sale per title | Av $ per title |
| 2007 | 28 | —— | 203,900 | —— | $2,018,694 | —– | 7282 | $72,096.21 |
| 2008 | 39 | 39.29% | 346,134 | 69.76% | $3,498,012 | 73.28% | 8875 | $89,692.62 |
| 2009 | 52 | 33.33% | 432,070 | 24.83% | $4,654,686 | 33.07% | 8309 | $89,513.19 |
| 2010 | 60 | 15.38% | 361,086 | -16.43% | $4,084,718 | -12.25% | 6018 | $68,078.63 |
| 2011 | 72 | 20.00% | 419,010 | 16.04% | $4,708,860 | 15.28% | 5819 | $65,400.83 |
| 2012 | 76 | 5.56% | 325,088 | -22.42% | $3,955,249 | -16.00% | 4277 | $52,042.75 |
| 2013 | 91 | 19.74% | 437,590 | 34.61% | $5,365,921 | 35.67% | 4809 | $58,966.16 |
| 2014 | 97 | 6.59% | 846,277 | 93.39% | $10,204,175 | 90.17% | 8725 | $105,197.68 |
| 2015* | 140 | 44.33% | 1,449,296 | 71.26% | $17,170,714 | 68.27% | 10,352 | $122,647.96 |
| 2016* | 131 | -6.43% | 1,940,760 | 33.91% | $23,919,704 | 39.31% | 14,815 | $182,593.16 |
| 2017 | 166 | 26.72% | 2,823,345 | 45.55% | $33,884,541 | 41.66% | 17,008 | $204,123.74 |
| 2018 | 224 | 34.94% | 4,623,212 | 63.75% | $54,645,209 | 61.27% | 20,639 | $243,951.83 |
Scholastic has one book over 700k, one more over 600k, another three over 300k, eight more over 100k, six more over 50k, thirteen more over 20k, and another ten over 10k. Whew! Any other publisher would be satisfied with half of that.
Scholastic seems more and more like an unstoppable juggernaut to me: the vast majority of their portfolio is extremely likely to go on to “perennial seller” status. Can you even imagine what might happen if they decided to do two streams of revenue and serialized first?
In what I can only categorize as the first of several “complete upsets”, the #2 publisher is now Andrews McMeel. Andrews is a publisher that sometimes has frustrated me by how they’ve been represented by BookScan – as I noted, it used to be that “humor” books like “Far Side” and “Calvin & Hobbes” used to rule the BookScan charts. Until, one day, poof! Almost of those books disappeared entirely from the dataset I was given, throwing off a whole lot of my comparables. And, for the most part, comic strip reprints have stayed out of these charts for half a decade. But, they’ve started creeping back into the listings for the last few years. I’m actually fine with comic strips and comic books co-existing in the same places – at least they’re both comics – but the inconsistency just drives me nucking futz.
I found 34 titles from Andrews in the Top 750 in 2018, for 661k copies and $10.5 million in sales, but clearly that number would scale up to some large degree if it listed all of the strip collections they publish. What’s interesting about Andrews McMeel is that, for the most part, their “graphic novels” are reformatted/repackaged newspaper strips. In other words, this is basically the other paid-for way one can serialize work: through syndicated newspaper pages
Lincoln Pierce and “Big Nate” is the big star player for Andrews McMeel – there are fifteen different “Big Nate” volumes in the Top 750, summing up to almost 340k copies combined. The best seller (“Silent But Deadly” sells around 84k copies)
The other big winner is Dana Simpson’s “Pheobe and Her Unicorn” which does nearly as well, with v1 selling just over 82k copies, and placing all eight volumes into the Top 750, summing to 206k total sold.
There’s also a smattering of “traditional” strips here: I can see the $100 “Complete Calvin & Hobbes” here (26k copies, which would make that the #6 dollar book in the entire chart) as well as the same for $100 “The Complete Far Side” (11k copies). There’s also 16k copies of “Herding Cats” from Sarah Andersen’s “Sarah’s Scribbles” and almost 15k of a Trump-focused “Doonesbury” volume. But I’m still missing most of the rest of Watterson, Larsen, and Trudeau.
Andrews McMeel’s Long Tail chart is just about the most useless one of all because they publish a whole lot of comics (humor strips, like “Calvin & Hobbes”) where the BISAC changed to something we’re having a hard time properly getting – almost certainly they’re doing several times better than this chart would suggest because of those books. Further, things appear and disappear in a way I’ve never been able to make sense of – it might be them changing BISACs after the fact. Most of my comparatives are terrible and counterproductive here, and I really apologize for the weakness of my data in this specific instance.
| Year | # of listed items | Percent Change | Total Unit Sold | Percent Change | Calculated Retail Value | Percent Change | Av. Sale per title | Av $ per title |
| 2007 | 22 | —— | 29,835 | —— | $461,238 | —– | 1,356 | $20,965.36 |
| 2008 | 20 | -9.09% | 25,115 | -15.82% | $388,965 | -15.67% | 1,256 | $19,448.25 |
| 2009 | 21 | 5.00% | 26,205 | 4.34% | $401,982 | 3.35% | 1,248 | $19,142.00 |
| 2010 | 19 | -9.52% | 47,181 | 80.05% | $544,852 | 35.54% | 2,483 | $28,676.42 |
| 2011 | 17 | -10.53% | 116,850 | 147.66% | $1,222,171 | 124.31% | 6,874 | $71,892.41 |
| 2012 | 31 | 82.53% | 225,546 | 93.02% | $2,737,935 | 124.02% | 7,276 | $88,320.48 |
| 2013 | 43 | 38.71% | 343,681 | 52.38% | $3,747,799 | 36.88% | 7,993 | $87,158.12 |
| 2014 | 59 | 37.21% | 373,713 | 8.74% | $4,387,252 | 17.06% | 6,334 | $74,360.21 |
| 2015* | 76 | 28.81% | 502,061 | 34.34% | $5,950,368 | 35.63% | 6,606 | $78,294.32 |
| 2016* | 85 | 11.84% | 472,145 | -5.96% | $5,147,673 | -13.49% | 5,555 | $60,560.86 |
| 2017 | 140 | 64.71% | 520,554 | 10.25% | $5,644,031 | 9.64% | 3,718 | $40,314.51 |
| 2018 | 273 | 95.00% | 735,184 | 41.23% | $11,862,349 | 210.18% | 2,693 | $43,451.83 |
Andrews McMeel has three books over 50k, four more over 20k, and seventeen others over 10k.
Moving up to #3 is the first of the so-called “Big Five” traditional book publishers: Penguin Random House. They land thirty-eight titles, selling 548k copies for nearly $8m in gross sales.
Like a lot of the “big five” book publishers, these companies have lots and lots of imprints built up over decades of publishing books. Penguin Random House, as best as I can tell, has thirteen (sheesh!) distinct imprints that appear in the Top 750 list for 2018 – Alfred A. Knopf, Ballantine, Clarkson N. Potter, Crown, Del Rey, Dial, Pantheon, Random House Books For Younger Readers, Ten Speed, Triangle, Tundra, Viking, and Yearling
They’re also, in the long tail: (deep breath!) Ace, Bantam, Berkley, Broadway Books, Doubleday, Dutton, Emblem, Golden, Gotham Books, G.P. Putnam & Sons, Grossett & Dunlap, Hudson Street, InkLit, McClelland & Stewart, Montena, New American Library, Penguin, Philomel, Plume, Price Stern Sloan, Puffin, Putnam, Razorbill, Riverhead, Schocken, Schwartz & Wade, Three Rivers, Villard, and Watson-Guptill. (whew!) However, they are not (Brian writes down here so he remembers this research next year) the PRH-distributed-only Campfire, Frog In Well, Library of America, Overlook Press, Powerhouse, Quirk, Shambhala, Universe, or Verso
Looking at those imprints in alphabetical order:
Alfred A. Knopf Books For Younger Readers places two books into the Top 750, starting with “The Cardboard Kingdom” by Chad Sell, which sells 12k. There’s also the first volume of Jarrett J. Krosocza’s “Lunch Lady” series at a bit over 8k.
Ballantine places eight titles in the Top 750: Seven different “Garfield” volumes ranging from 4100-7200 copies each, as well Bryan Lee O’Malley’s “Seconds”, which sells just under 5k copies in its fifth year of release.
Clarkson N Potter does a huge 41k with Mari Andrews’ “Am I There Yet? The Loop-de-loop Zigzagging Journey to Adulthood”
Crown Books for Younger Readers has a volume of Jeffrey Brown’s “Lucy & Andy Neanderthal” (“Bad to the Bones”) which does 4500 copies.
Del Rey publishes the Dave Wenzel adaptation of “The Hobbit” for about 7k copies.
Dial places two books by Victoria Jamieson: “Roller Girl”, at almost 47k, and “All’s Faire in Middle School” with 37k in its second frame.
Pantheon is their “literary” comics wing, and has some of PRH’s best-sellers – but this year, hrm, I seem to be missing most editions of “Maus” and “Persepolis”? Why did I not notice this until I was halfway through writing? Ugh. Typically there are nine or so Pantheon books in the Top 750, but I only have two now: 23k copies of art spiegelman’s “Complete Maus” in HC (but not the two softcovers that almost always sell much better), and just over 10k of the adaptation of “Anne Frank’s Diary” by Ari Folman.
Random House Books For Younger Readers
Ten Speed Press brings us a single title, a comics biography of Alexander Hamilton, with just over 4k sold. (plus they have that single volume of Manga of the adaptation of “The Life-Changing Manga of Tidying Up”, listed in the manga section.)
Triangle Square also places a single title: 5200 copies of “Sex is a Funny Word: A Book about Bodies, Feelings, and You”
Tundra has PRH’s best-selling titles with Ben Clanton’s “Narwahl: Unicorn of the sea” series, another juvie-aimed title. V3 launches at 52k, while the softcover of v1 does almost 44k. All together in all formats, it places 186k copies between six editions.
Viking comes along with “Caveboy Dave: More Scrawny Than Brawny” with just over 7k.
And finally, Yearling is (for some reason), the new home of the softcovers of Jeffrey Brown’s “Lucy & Andy”, with two volumes adding up to about 9600 copies.
Penguin Random House formed out of a merger in 2013 – prior to that they were separate publishers Penguin and Random House. Here’s what the Long-Tail for the combined Penguin Random House looked like in 2017:
| Year | # of listed items | % Change | Total Pieces | % Change | Calculated Retail Value | % Change | Av. Sale per title | Av $ per title |
| 2013 | 282 | ——- | 447,174 | ——- | $7,259,364 | ——- | 1,586 | $25,742.43 |
| 2014 | 252 | -10.64% | 428,634 | -4.15% | $7,415,712 | 2.15% | 1,701 | $29,427.43 |
| 2015* | 450 | 78.57% | 513,611 | 19.83% | $8,517,761 | 14.49% | 1,141 | $18,928.36 |
| 2016* | 293 | -34.88% | 435,877 | -15.13% | $7,150,087 | -16.06% | 1,488 | $24,403.03 |
| 2017 | 409 | 39.59% | 664,858 | 52.53% | $10,136,224 | 41.76% | 1,626 | $24,782.94 |
| 2018 | 613 | 49.88% | 760,314 | 14.36% | $11,136,058 | 9.86% | 1,240 | $18.166.49 |
However, I’m not willing to pull an “We’ve always been at war with Eastasia” moment, so let’s look at the individual pieces of the past. This is what Penguin Putnam (Ace, Berkley Books, Dial, Dutton, Gotham Books, Grossett & Dunlap, Hudson Street, InkLit, New American Library, Penguin, Philomel, Plume, Price Stern Sloan, Puffin, Putnam, Razorbill, Riverhead and Viking) used to look like alone)
| Year | # of listed items | % Change | Total Pieces | % Change | Calculated Retail Value | % Change | Av. Sale per title | Av $ per title |
| 2007 | 18 | —— | 13,545 | —— | $178,260 | —— | 753 | $9,903.33 |
| 2008 | 28 | 55.56% | 28,606 | 111.19% | $310,856 | 74.38% | 1022 | $11,102.00 |
| 2009 | 39 | 39.29% | 40,288 | 40.84% | $444,928 | 43.13% | 1033 | $11,408.41 |
| 2010 | 45 | 15.38% | 50,628 | 25.67% | $623,650 | 40.17% | 1125 | $13,858.89 |
| 2011 | 53 | 17.78% | 123,749 | 144.43% | $1,576,161 | 152.73% | 2335 | $29,738.89 |
| 2012 | 60 | 13.21% | 121,769 | -1.60% | $1,499,660 | -4.85% | 2029 | $24,994.33 |
This is what Random House (Alfred A. Knopf, Ballantine, Bantam, Broadway, Crown, Del Rey, Doubleday, Pantheon, Random House, Schocken, and Three Rivers) looked like alone:
| Year | # of listed items | % Change | Total Pieces | % Change | Calculated Retail value | % Change | Av. Sale per title | Av $ per title |
| 2007 | 74 | — | 216,580 | — | $2,890,347 | — | 2,927 | $39,058.74 |
| 2008 | 77 | 5.47% | 383,105 | 76.89% | $5,698,922 | 97.17% | 4,975 | $74,011.97 |
| 2009 | 109 | 41.56% | 405,598 | 5.87% | $5,398,890 | -5.26% | 3,721 | $49,531,10 |
| 2010 | 132 | 21.10% | 389,410 | -3.99% | $5,831,814 | 8.02% | 2,950 | $44,180.41 |
| 2011 | 144 | 9.09% | 397,143 | 1.99% | $6,356,212 | 8.99% | 2,760 | $44,140.36 |
| 2012 | 185 | 28.47% | 375,254 | -5.51% | $7,124,794 | 12.09% | 2,028 | $38,512.40 |
Penguin Random House has one title over 50k, eight additional books over 20k, and another six books over 10k.
Surging forward to #4 (they were at #9 last year) is Holtzbrinck, which owns Macmillan, is considered one of the “big five”, and is also one of those publishers with lots and lots (and lots) of imprints: Farrar Straus Giroux, Feiwel & Friends, FirstSecond, Hill + Wang, and Square Fish are the only five to make the Top 750, but there are others down into the Long Tail as well – I have also identified Henry Holt, Metropolitan, Picador, Roaring Brook, Rodale Press, St. Martins Griffin, Times books, and Tor. Holtzbrinck also distributes several other publishers they don’t own (including Bloomsbury, Drawn & Quarterly, Papercutz, and Seven Seas) Holtzbrinck-owned companies placed 33 titles in the Top 750, for about 506k and about $7.9m combined.
By imprint, we start alphabetically with Farrar Straus Giroux which has three placers in the Top 750: “All Summer Long” by Hope Larson (just over 19k), Emily Carroll’s adaptation of “Speak” (about 12k), and the hardcover version of the “Wrinkle in Time” adaptation (about 6k)
Feiwel & Friends brings two volumes of “Wires and Nerve”, with v2 moving 12k, and v1 about 5500 copies.
FirstSecond is their strongest imprint, with 24 books placing into the Top 750, and where they score their biggest hit with the McEllroy’s “The Adventure Zone”, which blows out a huge 94k copies sold in its debut year. They also do terrific with “Real Friends” by Shannon Hale (70k), Vera Brosgol’s “Be Prepared” (38k), and Jen Wang’s “The Prince and the Dressmaker” (about 21k)
Square Fish’s deal is cheaper repackaging from other imprints (I don’t personally get this business model) and has four placing titles. The softcover of Hope Larson’s adaptation of “A Wrinkle In Time” sells a giant 52k, while Gene Yang’s “American Born Chinese” does almost 35k
Here’s Holtzbrinck’s Long Tail (again, I might have missed an imprint somewhere – trying to tease them all out is a difficult task from their Byzantine org chart). Another great year of growth for them.
| Year | # of listed items | Percent Change | Total Unit Sold | Percent Change | Calculated Retail value | Percent Change | Av. Sale per title | Av $ per title |
| 2007 | 39 | —— | 31,452 | —— | $559,681 | —– | 806 | $14,350.79 |
| 2008 | 66 | 69.23% | 63,473 | 101.81% | $1,132,767 | 102.40% | 962 | $17,163.14 |
| 2009 | 88 | 33.34% | 84,090 | 32.48% | $1,438,044 | 26.95% | 956 | $16,341.41 |
| 2010 | 108 | 22.73% | 68,599 | -18.42% | $1,085,311 | -24.53% | 635 | $10,049.18 |
| 2011 | 139 | 28.70% | 114,243 | 66.54% | $1,794,084 | 65.31% | 822 | $12,907.08 |
| 2012 | 165 | 18.71% | 126,745 | 10.94% | $2,077,143 | 15.78% | 768 | $12,588.75 |
| 2013 | 187 | 13.33% | 142,375 | 12.33% | $2,395,569 | 15.33% | 761 | $12,810.53 |
| 2014 | 222 | 18.72% | 190,682 | 33.93% | $3,096,858 | 23.27% | 859 | $13,949.81 |
| 2015* | 104 | -53.15% | 99,223 | -47.96% | $1,804,001 | -41.75% | 954 | $17,346.16 |
| 2016* | 272 | 161.54% | 272,668 | 174.80% | $4,240,075 | 135.04% | 1,002 | $15,588.51 |
| 2017 | 336 | 23.53% | 437,258 | 60.36% | $6,616,130 | 56.04% | 1,301 | $19,690.86 |
| 2018 | 427 | 27.08% | 723,096 | 65.37% | $11,701,046 | 76.86% | 1,693 | $27,402.92 |
Holtzbrinck has three books over 50k, three more over 20k, and five others over 10k.
Moving up to #5 largest publisher with Western comics in BookScan Top 750 in 2018 is another of the “big five”: HarperCollins. Harper places twenty books into the Top 750 for a total of 448k copies sold, and $6.5 million. There’s a lot of imprints with the word “Harper” in the title in the Long Tail (Harper, Harper Paperbacks, Harper Teen, Harper Festival, Harper Teen, and so on), and Harper is also Amistad and Blazer & Bray (in the Top 750), and IT books, William Morrow, and Zondervan (out of the Top 750)
Amistad has a single book: 4700 copies of “Monster: A Graphic Novel” by Walter Dean Myers.
At Balzer & Bray it is all about Terri Libenson, and “Positively Izzy” (a staggering 91k) and “Invisible Emmie” (77k). There’s also a box set of the two which moves over 8k copies.
At the various Harper-named imprints, their biggest hit is from “Minecraft-inspired YouTube star PopularMMOs” with “PopularMMOs Presents A Hole New World” which sells a staggering 93k. The second best-seller is a similar YouTube-based comic from “DanTDM”, with “DanTDM: Trayaurus and the Enchanted Crystal” (29k in softcover, and 16k in hardcover) They also do well with nearly 23k copies sold of “Everyone’s a Aliebn When UR a Aliebn Too”
Harper also does great with “Warriors: Graystripe’s Adventure” (almost 15k), Noelle Stevenson’s “Nimona” (14k), a volume of Lincoln Pierce’s “Big Nate” – “Triple Play” sells just under 13k. They also sell almost 12k copies of the adaptation of “To Kill A Mockingbird”
Nothing else is over 10k, so here is the Long Tail:
| Year | # of listed items | Percent Change | Total Unit Sold | Percent Change | Calculated Retail value | Percent Change | Av. Sale per title | Av $ per title |
| 2007 | 18 | —— | 36,940 | —— | $600,540 | —– | 2052 | $33,363.33 |
| 2008 | 36 | 100.00% | 48,264 | 30.66% | $863,808 | 43.84% | 1341 | $23,994.67 |
| 2009 | 42 | 16.67% | 81,774 | 69.43% | $1,308,891 | 15.53% | 1947 | $31,164.07 |
| 2010 | 41 | -2.38% | 64,429 | -21.21% | $719,328 | -45.04% | 1571 | $17,544.59 |
| 2011 | 50 | 21.95% | 75,394 | 17.02% | $1,083,609 | 50.64% | 1508 | $21,672.18 |
| 2012 | 80 | 60.00% | 159,573 | 111.65% | $2,113,744 | 95.07% | 1995 | $26,421.80 |
| 2013 | 68 | -15.00% | 197,595 | 23.83% | $2,667,933 | 26.22% | 2906 | $39,234.31 |
| 2014 | 115 | 69.12% | 158,193 | -19.94% | $2,398,836 | -10.09% | 1376 | $21,042.42 |
| 2015* | 109 | -5.22% | 188,181 | 18.96% | $2,646,378 | 10.32% | 1726 | $24,278.70 |
| 2016* | 108 | -0.09% | 261,183 | 38.79% | $4,473,589 | 69.05% | 2418 | $41,422.12 |
| 2017 | 107 | -0.09% | 357,972 | 37.06% | $5,530,994 | 23.64% | 3346 | $51,691.53 |
| 2018 | 148 | 38.32% | 517,800 | 44.65% | $7,506,751 | 35.72% | 3499 | $50,721.29 |
Harper has three books over 50k, two books over 20k, and another five more over 10k
Image Comics in now our #6 Western publisher via the BookScan reporters; Image has 42 titles placing within the Top 750 in 2018, that sell 402k copies and just a notch over $11m in calculated retail value. That’s a huge drop from last year’s 909k, and almost $7.6m.
Because Image is a primarily Direct Market retailer, we’ve always built a special year-by-year chart for them in the Top 750 (Hey! I have my biases!), and this is what Image’s performance has looked like for the last sixteen years:
| Year | # of placing titles | Unit sales | Calculated Retail Value |
| 2003 | 1 | 2,328 | $30,148 |
| 2004 | 1 | 402 | $5,206 |
| 2005 | 3 | 8,699 | $100,236 |
| 2006 | 1 | 5,311 | $113,465 |
| 2007 | 4 | 28,349 | $344,026 |
| 2008 | 9 | 55,033 | $830,574 |
| 2009 | 11 | 78,874 | $1,210,094 |
| 2010 | 22 | 289,044 | $6,479,930 |
| 2011 | 27 | 367,265 | $8,670,917 |
| 2012 | 33 | 701,050 | $20,389,762 |
| 2013 | 38 | 651,390 | $19,371,269 |
| 2014 | 47 | 691,804 | $17,554,492 |
| 2015 | 71 | 878,262 | $22,587,672 |
| 2016 | 72 | 908,655 | $22,917,758 |
| 2017 | 52 | 556,196 | $11,092,960 |
| 2018 | 42 | 402,584 | $7,611,777 |
And, yeah, doesn’t look good at all. In fact, its kind of a rout after years of flying high with volume down 56% from height, and dollars down almost 2/3. Ow.
Image’s success is currently lead by Brian K Vaughan and Fiona Staples’ “Saga”, where v8, the 2018 release with twelve full months of sales, racks up almost 45k copies. This is about the same as v7 did in 2017, so the book is clearly staying strong. V9 (released just in October) sells about 29k. Possibly troubling is that v1 “only” sells 17k (down from 20k in 2017), and that the “sag” of the “hammock” (discussed in the manga section) means that v3-6 have all dropped substantially under 10k for the first time. And I don’t think anyone knows what is going to happen in 2019 and beyond while “Saga” is on a (at least?) one-year hiatus, but at least in 2018 “Saga” seems to be hanging in there. Image just needs a few more books that can hit those bigger peaks. Altogether, in all formats, “Saga” sells about 161k copies into the bookstores.
A large portion of Image’s chart retreat, of course, is from the sinking sales of “The Walking Dead”. Two years ago, “TWD” in the Top 750 placed 37 titles selling more than a half-million copies for $17.5 million calculated dollars, while this year only 13 “TWD” books make the Top 750, and sell only 115k copies for $3.1m in calculated retail dollars. That’s an extremely sharp drop in velocity. Most of those calculated dollars come from the “Compendium” (the package with 48 issues for $60) – v1 barely tops 9700 copies in 2018, when it sold 19k in 2017 and a staggering 71k in 2016. This was all “free” money (being the fourth time getting paid for the same work), but its still got to hurt a little. 2018’s best-selling individual volume of “TWD” was v29 (released in July ‘18) – it sells about 26k copies. For comparison v27 sold 36k in 2017 (released in March ‘17) – not exactly apples to apples, but it looks like the frontlist portion of “TWD” is starting to slow down too (it was 43k in 2016, for what it is worth)
If you look at the entire “long tail” for 2018, then there are 78 books in various formats (HC, SC, en espanol, covers, whatever) branded as “TWD”. They sell 166k copies for $4.6m calculated dollars at full retail in 2018 – in 2017, that was 266k and $7.1m, so not all of the Long Tail pain below is “TWD” this year.
Image’s #6 best-selling title is the first volume of Majorie Liu and Sana Takada’s “Monstress”, coming in at a bit over 16k. This is a large drop from 24k in the previous year.
“Paper Girls” by BKV and Cliff Chiang” is #7 in the book stores – that’s 12k on v1. They also sell nearly 11k of v7.
Nothing else from Image sells over 10k this year – “Snotgirl” v1 shifts 7400 copies is as close as they come.
Only one other new Image volume manages to pull in sales over 10k this year: the first volume of Bryan Lee O’Malley and Leslie Hung’s “Snotgirl”, which almost pulls in 11k, along with another 4k or so from a Barnes & Noble exclusive cover. Series that were selling over 10k last year included the first volumes of “Descender”, “Bitch Planet” and “Rat Queens”, but the best-selling of these (“Bitch Planet”) dropped to around 8k this year in the bookstores, and the others are even lower. Image needs to seriously develop a few more new hits.
Here’s what Image’s Long Tail looks like: just like from the top, it’s a brutal cut this year. These are not happy numbers, for a second year in the row.
| Year | # of listed items | Percent Change | Total Unit Sold | Percent Change | Calculated Retail Value | Percent Change | Av. Sale per title | Av $ per title |
| 2007 | 438 | —— | 116,015 | —— | $2,313,477 | —– | 265 | $5,281.91 |
| 2008 | 515 | 17.58% | 121,001 | 4.30% | $2,445,765 | 5.72% | 235 | $4,749.06 |
| 2009 | 571 | 10.87% | 156,466 | 29.31% | $3,207,033 | 31.13% | 274 | $5,616.52 |
| 2010 | 642 | 12.43% | 359,238 | 229.59% | $8,152,806 | 254.22% | 560 | $12,699.07 |
| 2011 | 749 | 16.66% | 466,637 | 29.90% | $11,041,187 | 35.43% | 623 | $14,741.24 |
| 2012 | 868 | 15.89% | 794,419 | 70.24% | $22,797,279 | 106.47% | 915 | $26,264.15 |
| 2013 | 994 | 14.52% | 776,507 | -2.25% | $22,085,860 | -3.12% | 781 | $22,219.18 |
| 2014 | 1006 | 1.21% | 830,735 | 6.98% | $20,309,973 | -8.04% | 826 | $20,188.84 |
| 2015* | 842 | -16.30% | 1,070,299 | 28.84% | $26,175,438 | 28.88% | 1271 | $31,087.22 |
| 2016* | 876 | 4.04% | 1,187,316 | 10.93% | $28,267,847 | 7.99% | 1355 | $32,269.23 |
| 2017 | 1531 | 174.77% | 938,991 | -20.91 | $18,564,975 | -34.32% | 613 | $12,126.05 |
| 2018 | 1706 | 11.43% | 769,180 | -18.08 | $14,923,335 | -19.62% | 451 | $8,747.56 |
Image has three titles over 20K, and another eight over 10k.
Coming in as #7 Western publisher within the Top 750 in 2018 is Marvel Comics, which places 44 titles for about 363k copies and $7.9m of calculated retail. This is a small drop in pieces, and a small rise in dollars.
Here is how Marvel looks in the Top 750:
| Year | # of placing titles | Unit sales | Calculated Retail value |
| 2003 | 73 | 455,553 | $8,428,962 |
| 2004 | 50 | 227,985 | $3,756,764 |
| 2005 | 26 | 153,317 | $2,459,027 |
| 2006 | 33 | 294,852 | $5,702,307 |
| 2007 | 37 | 376,918 | $7,599,057 |
| 2008 | 38 | 303,639 | $6,446,359 |
| 2009 | 34 | 226,541 | $5,019,216 |
| 2010 | 33 | 206,273 | $4,979,323 |
| 2011 | 27 | 128,364 | $3,303,496 |
| 2012 | 32 | 141,145 | $3,872,683 |
| 2013 | 39 | 187,598 | $4,229,242 |
| 2014 | 53 | 342,706 | $8,341,787 |
| 2015* | 63 | 478,076 | $10,611,981 |
| 2016* | 60 | 555,715 | $12,088,278 |
| 2017 | 50 | 378,689 | $7,840,198 |
| 2018 | 44 | 363,360 | $7,885,015 |
I mean, dollars are up, so can’t really call this anything bad, but, man when they are generating a billion dollars per movie now in ticket revenue, you’d think some of it would bleed over into sales of the source material – and it did help on the top (as you’ll soon see), but the midlist is languishing which is where you want to some life.
Ultimately, I think the problem is that Marvel’s backlist is kind of scattershot. Very few titles are truly perennial, and the branding and packaging is all over the map. New backlist releases are designed for maximizing revenue, rather than audience size, where price-per-page is very similar to the serialization cost. New backlist releases also have poor “hand”, feeling very thin compared to other books on the shelves. Its hard to follow which sequence individual books come in, and they’re not exactly committed to aggressively reprinting either. I honestly think that Marvel backlist should be selling significantly better than it does – it’s very nearly the crown jewels of comics these days.
On the other hand, they passed DC this year, so you have to give them that.
However, they do for sure have at least one hit this year: “Infinity Gauntlet” moved nearly 54k copies in 2018 – that’s up hugely from 16k in 2017.
Also doing extremely well is the first volume of Ta-Nehisi Coates’ “Black Panther: A Nation Under Our Feet” – 36k copies, which is a rise on 2017’s 28k, but with the billion-dollar Oscar-winning commercial this seriously should have pushed much further. V2 sells 13k, while v3 drops to 9400.
Marvel’s third best-selling comic is “Infinity War”, drafting off of #1. It pulls in a solid 16k.
Coming in at #5, and almost the only Marvel book in the Top 750 that has absolutely no movies advertising it, is “Ms Marvel v1: No Normal”. Sure, people aren’t looking for diversity. It sells 13k.
Slightly below at #6 (by like 125 copies!) is “Deadpool Kills the Marvel Universe”, while #7 & 8 are the most recent “Darth Vader” comic – 11k for v1, and 9400 for v2.
Finally, Marvel’s #10 book is “Civil War” at about 8700 copies. I feel like this should sell twice that, right?
No other Marvel comics top 10k in the bookstore market.
Here is Marvel’s Long Tail.
| Year | # of listed items | % Change | Total Pieces | % Change | Calculated Retail value | % Change | Av. Sale per title | Av $ per title |
| 2007 | 1230 | — | 1,034,023 | — | $19,947,737 | — | 841 | $16,218 |
| 2008 | 1559 | 26.75% | 1,032,394 | -0.001% | $20,128,825 | 0.01% | 662 | $12,911 |
| 2009 | 2067 | 32.58% | 954,335 | -7.56% | $19,608,696 | -2.58% | 462 | $9,487 |
| 2010 | 2551 | 23.42% | 870,597 | -8.77% | $19,485,662 | -0.06% | 352 | $7,638 |
| 2011 | 2852 | 11.80% | 852,187 | -2.11% | $20,225,728 | 3.80% | 299 | $7,092 |
| 2012 | 3083 | 8.10% | 726,542 | -14.74% | $18,848,013 | -6.81% | 236 | $6,114 |
| 2013 | 3203 | 3.89% | 730,826 | 0.59% | $17,820,299 | -5.45% | 228 | $5,564 |
| 2014 | 3352 | 4.65% | 918,595 | 25.69% | $24,369,961 | 36.75% | 274 | $7,270 |
| 2015* | 1882 | -43.85% | 1,114,414 | 21.32% | $28,021,290 | 14.98% | 592 | $14,889 |
| 2016* | 1841 | -2.18% | 1,277,046 | 14.59% | $31,402,330 | 12.07% | 694 | $17,057 |
| 2017 | 3578 | 94.35% | 1,142,061 | -10.57% | $28,201,535 | -10.19% | 319 | $7,882 |
| 2018 | 3662 | 2.35% | 1,180,202 | 3.34% | $29,651,745 | 5.14% | 322 | $8,097 |
Marvel has one book over 50k, one over 20k, and another five that are over 10k.
Our #8 publisher in the Top 750 is DC Entertainment.
This is, frankly, shocking to me. For the first decade-plus I have been doing these charts, DC’s attention to backlist had naturally rendered them the #1 publisher…. With a bullet! And even when, the last few years, they lost the #1 spot to Scholastic, they were still majorly, significantly always at least #2.
In 2018 they placed just 47 titles in the Top 750, for just over 360k units, and just under $7.8 million in calculated retail price. DC has four charting imprints: DC Black Label, DC, DC Zoom and Vertigo. Deep in the long tail we can still track Mad, Wildstorm, Paradox, Minx and CMX.
Here’s a year-to-year comparison chart of the Top 750:
| Year | # of placing titles | Unit sales | Calculated Retail price |
| 2003 | 74 | 336,569 | $6,151,258 |
| 2004 | 39 | 179,440 | $3,135,983 |
| 2005 | 42 | 298,484 | $5,440,001 |
| 2006 | 59 | 551,160 | $10,246,082 |
| 2007 | 58 | 487,467 | $9,953,976 |
| 2008 | 71 | 1,015,864 | $19,805,098 |
| 2009 | 93 | 1,223,733 | $24,061,834 |
| 2010 | 96 | 648,403 | $12,523,128 |
| 2011 | 107 | 660,706 | $13,083,378 |
| 2012 | 104 | 688,870 | $14,811,979 |
| 2013 | 130 | 767,686 | $15,620,981 |
| 2014 | 131 | 931,239 | $19,207,755 |
| 2015* | 119 | 1,074,304 | $21,701,088 |
| 2016* | 117 | 1,234,047 | $23,203,071 |
| 2017 | 101 | 827,544 | $15,234,525 |
| 2018 | 47 | 360,414 | $7,810,753 |
2018 is pretty ugly in the book stores for DC – they haven’t had this tragic of a performance since 2005. And I’m still trying to wrap my head around it from 20,000 feet.
Now, there’s no doubt that the rebranding from “New 52” to “Rebirth” simply did not work in the mid-term – it does not appear that the “civilian” audience understood why continuity was being “reset” again so quickly. And while the “Rebirth” GN numbers were OK to start, they very very quickly bombed out. Here’s an example: the first “Rebirth” “Harley Quinn” launched at 13k in 2017. In 2018, it sold just 1818 copies. Kind of shockingly, v1 of the “New 52” “Harley” outsold it at 1894 copies. You can see this over and over again down the line: “Rebirth” “Batman” v1 sold 24k in 2017, and just over 5600 copies in 2018. “Nightwing” v1 sold 12k in 2017, down to 3k in 2018. In fact, not a single “Rebirth” branded book passes 10k in 2018, and it completely slaughtered the sales of the “New 52” editions as well.
I sort of get all of that, and how the mechanics of that can work… but what I don’t really grasp is why the strong backlist, the stuff that has sold month-in, month-out for (in many cases now, decades), suddenly fell off the cliff, as you’ll see.
To help with your trivia contests sometime in the future, “What is the first ‘Black Label’ book?” Well, it is “Batman: White Knight”. It sells about 18k copies in the bookstores. My larger question is “what is ‘Black Label’ actually going to be?” is still unanswered, though. I think DC has sent extremely mixed messages. This is DC’s #3 best-selling book over all, by the way.
There’s also a single DC Zoom book in the Top 750 this year: “DC Super Hero Girls: Date With Disaster” – it sells just over 8k copies. I can’t explain what makes this one, which is actually v5, sell so much better than the other volumes – the next one listed is out of the top 750, and sells under half at around 3600 copies – the same thing is true in my comic shop, this is the one that sells best. So odd.
There are six books branded as Vertigo. “Sandman” v1 does the best with 11k sold (it is DC’s #7 best-selling book), and “Preacher” v1 does next best at about 5600 copies, way down from 11k the previous year.
The remaining 39 books are branded as DC Comics. The best-selling of these is “Watchmen” for 27k, but that’s down from 31k last year. Why?
#2 is the paperback of “Dark Nights: Metal” just over 19k (while companion book “Dark Knights Rising” [#6] brings in almost 12k, and “Dark Days: The Road to Metal” [#9] does about 9500 copies)
At #4 for DC is “Batman: The Killing Joke”, which moves almost 17k copies. That sounds good… but it sold 36k the year before, and 131k the year before that. Again: why the plunge?
#5 is “V For Vendetta” at 14k (18k the year before)
#8 is “Batman: Year One” at just under 10k – it’s dropped from about 11k; #10 is v4 of the “Rebirth” “Batman” (“The War of Jokes & Riddles”), and fallen out of the Top 10 at #11 is Frank Miller’s “Batman: The Dark Knight Returns” with under 9k sold – dropped from over 11k.
I don’t know, these are pretty depressing numbers. The layoffs make a lot more sense now.
Here’s DC’s Long Tail – this was not, even slightly, a good year for DC, and they are, year-over-year, pretty much worst performing major publisher in 2018, despite having one of the widest backlists.
| Year | # of listed items | % Change | Total Pieces | % Change | Calculated Retail Value | % Change | Av. Sale per title | Av $ per title |
| 2007 | 1644 | — | 1,181,218 | — | $22,033,212 | — | 719 | $13,402 |
| 2008 | 2057 | 25.12% | 1,719,330 | 45.56% | $33,609,704 | 52.54% | 836 | $16,339 |
| 2009 | 2264 | 10.06% | 1,902,181 | 10.64% | $37,816,864 | 12.52% | 840 | $16,704 |
| 2010 | 2442 | 7.86% | 1,320,262 | -30.59% | $25,982,910 | -31.29% | 541 | $10,640 |
| 2011 | 2423 | -0.07% | 1,323,630 | 0.26% | $27,130,811 | 4.42% | 546 | $11,197 |
| 2012 | 2452 | 1.20% | 1,206,198 | -8.87% | $26,729,997 | -1.48% | 492 | $10,901 |
| 2013 | 2551 | 4.04% | 1,369,850 | 13.57% | $29,881,153 | 11.79% | 537 | $11,714 |
| 2014 | 2746 | 7.64% | 1,638,901 | 19.64% | $35,388,570 | 18.43% | 597 | $12,887 |
| 2015* | 1690 | -38.46% | 1,997,577 | 21.89% | $43,031,546 | 21.60% | 1182 | $25,462 |
| 2016* | 1214 | -28.17% | 2,262,888 | 13.82% | $47,963,215 | 11.46% | 1864 | $39,508 |
| 2017 | 3152 | 259.64% | 1,948,037 | -13.91% | $42,921,514 | -10.51% | 618 | $13,617 |
| 2018 | 3364 | 6.73% | 1,333,836 | -31.53% | $31,844,186 | -25.81% | 397 | $9,466 |
DC now just has one books over 20k, and just seven more that come in over 10k.
For the first time in the top 10, at #9, is another of the “Big Five”: Hachette, which includes the imprints of Black Dog & Leventhal, JY, Little, Brown, Running Press, and Yen in the Top 750, as well as Grand Central and Nation Books, in the Long Tail. In the Top 750 they place seventeen books, selling 249k copies and $2.7m. Yen also has a lot of manga up above in the previous section. If you added them together, it would be about 408k, and $5.1m
JY is their strongest imprint, being home to Svetlana Chmakova’s “Awkward” (57k), “Brave” (44k), and “Crush” (39k)
Little, Brown places six books into the Top 750, “Catstronauts: Mission Moon: is their best-seller at nearly 16k, and the later volumes all follow. They also sell 3447 copies of the first 3-in-one edition of Herge’s “Tintin”, which continues to be disturbingly low for one of the classic masters of the medium, if you ask me.
None of their other imprints manage to score any titles at 10k or over.
Here’s the Long Tail of just the Western books for Hachette. It’s going to jump a bit because we now add Perseus publishers (which they purchased in 2016) Basic Books, Public Affairs, and Running Press:
| Year | # of listed items | Percent Change | Total Unit Sold | Percent Change | Calculated Retail value | Percent Change | Av. Sale per title | Av $ per title |
| 2007 | 15 | —— | 39,181 | —— | $689,383 | —— | 2,612 | $45,958.87 |
| 2008 | 18 | 20.00% | 37,519 | -4.24% | $596,609 | -13.46% | 2,084 | $33,144.94 |
| 2009 | 18 | —— | 40,172 | 7.07% | $642,935 | 7.76% | 2,232 | $35,718.61 |
| 2010 | 19 | 5.56% | 160,992 | 300.76% | $3,097,996 | 381.85% | 8,473 | $163,052.42 |
| 2011 | 24 | 26.32% | 88,131 | -45.26 | $1,273,500 | -58.89% | 3,672 | $53,063.01 |
| 2012 | 28 | 16.67% | 110,897 | 25.83% | $1,565,744 | 22.95% | 3,961 | $55,919.43 |
| 2013 | 24 | -14.29% | 39,093 | -65.75% | $584,783 | -62.65% | 1,629 | $24,365.96 |
| 2014 | 32 | 33.33% | 38,853 | -0.61% | $593,667 | 1.52% | 1,214 | $18,552.10 |
| 2015* | 30 | -0.63% | 61,539 | 58.39% | $830,047 | 39.82% | 2,051 | $27,668.23 |
| 2016* | 56 | 86.67% | 81,648 | 32.68% | $1,654,511 | 99.33% | 1,458 | $29,544.84 |
| 2017 | 78 | 39.29% | 220,591 | 170.17% | $2,998,501 | 81.23% | 2,828 | $38,442.32 |
| 2018 | 203 | 260.26% | 363,575 | 64.82% | $4,541,954 | 51.47% | 1,791 | $22,374.15 |
And if you add the Manga from Yen, the combined total looks like this:
| Year | # of listed items | Percent Change | Total Unit Sold | Percent Change | Calculated Retail value | Percent Change | Av. Sale per title | Av $ per title |
| 2007 | 25 | —— | 52,077 | —— | $836,832 | —– | 2,083 | $33,473.28 |
| 2008 | 108 | 332.00% | 147,645 | 183.51% | $1,834,469 | 119.22% | 1,367 | $16,985.82 |
| 2009 | 229 | 112.04% | 371,134 | 151.37% | $4,340,048 | 132.78% | 1,621 | $18,952.17 |
| 2010 | 363 | 58.52% | 721,975 | 94.53% | $9,748,867 | 124.63% | 1,999 | $26,856.38 |
| 2011 | 484 | 33.33% | 852,256 | 18.05% | $11,227,466 | 15.17% | 1,761 | $23,197.24 |
| 2012 | 576 | 19.01% | 758,845 | -10.96% | $10,301,009 | -8.25% | 1,317 | $17,883.70 |
| 2013 | 678 | 17.71% | 731,473 | -3.61% | $10,300,204 | —– | 1,079 | $15,192.04 |
| 2014 | 808 | 19.17% | 720,988 | -1.43% | $10,579,169 | 2.71% | 892 | $13,093.03 |
| 2015* | 742 | -8.17% | 994,407 | 37.92% | $14,304,955 | 35.22% | 1,340 | $19,278.92 |
| 2016* | 849 | 14.42% | 1,153,656 | 16.01% | $17,174,718 | 20.06% | 1,359 | $20,229.35 |
| 2017 | 1481 | 74.44% | 1,199,553 | 3.98% | $16,865,176 | -1.80% | 810 | $11,387.69 |
| 2018 | 1940 | 30.99% | 1,253,803 | 4.52% | $17,593,705 | 4.32% | 646 | $9,068.92 |
Hachette has one title over 50k, two more over 20k, and two others over 10k, on the Western charts.
Thankfully breaking back into the Western Top 10 is Dark Horse Comics at #10. They place 26 titles into the Top 750 for 223k, and $3.5 in calculated retail value.
It is another fairly hard year for Dark Horse as they’ve lost access to several of the best licenses they had (Star Wars, Conan, Whedonverse), but they’re having a hard time pushing creator-owned material and make it work. Rock and hard place.
Dark Horse best licensed property in 2018 becomes “Legend of Korra” as v2 of “Turf Wars” sells almost 18k. V3, which was released in September, sells 11k, and v1 is a bit under 8k.
They do nearly as well with the first release from “Overwatch”, about 500 copies behind, though because of rounding, I call it “just over 17k”.
One of Karen Berger’s books is Dark Horse’s 3rd best-sellers in bookstores: “Anthony Bourdain’s Hungry Ghosts” with just over 14k. RIP, man.
Dark Horse’s previous #1 license, “Plants Vs. Zombies”, is their #4 and 5 (and 7, 9 and 10 for that matter!) – 12k for v9, v10, 11k for v1. Everything else is under 10k.
Here’s what Dark Horse’s Western performance looks like in the Long Tail. They keep losing all of their best toys, but they’re getting solid performance with no losses!:
| Year | # of listed items | Percent Change | Total Unit Sold | Percent Change | Calculated Retail value | Percent Change | Av. Sale per title | Av $ per title |
| 2007 | 597 | —— | 413,022 | —— | $7,607,264 | —– | 692 | $14,744.90 |
| 2008 | 734 | 22.95% | 552,815 | 33.85% | $9,329,828 | 22.64% | 753 | $12,710.94 |
| 2009 | 798 | 8.72% | 455,924 | -17.53% | $7,757,240 | -16.86% | 571 | $9,720.85 |
| 2010 | 955 | 19.67% | 445,248 | -2.34% | $7,852,063 | 1.22% | 466 | $8,222.06 |
| 2011 | 1025 | 7.33% | 389,514 | -12.52% | $7,102,710 | -9.54% | 380 | $6,929.47 |
| 2012 | 1133 | 10.54% | 377,322 | -3.13% | $6,907,772 | -2.74% | 333 | $6,096.89 |
| 2013 | 1238 | 9.27% | 383,391 | 1.61% | $7,391,831 | 7.01% | 310 | $5,970.78 |
| 2014 | 1420 | 14.70% | 421,708 | 9.99% | $8,982,411 | 21.52% | 297 | $6,325.64 |
| 2015* | 947 | -33.31% | 376,231 | -10.78% | $8,120,937 | –9.59% | 397 | $8,575.44 |
| 2016* | 877 | -7.39% | 461,297 | 22.61% | $9,076,526 | 11.77% | 526 | $10,349.52 |
| 2017 | 1598 | 82.21% | 478,658 | 3.76% | $9,256,795 | 1.99% | 300 | $5,792.74 |
| 2018 | 1615 | 1.06% | 485,919 | 1.52% | $9,410,362 | 1.66% | 301 | $5,826.85 |
Despite the weakening frontlist, in the Long Tail Western Dark Horse has its best year ever. Again!
Dark Horse’s Manga offerings are up in that section. Dark Horse is one of the rare publishers that does a significant business in both Eastern and Western comics, and I’m sure they’d prefer all of their numbers to be represented together. In which case, their Long Tail actually looks like this:
| Year | # of listed items | Percent Change | Total Unit Sold | Percent Change | Calculated Retail value | Percent Change | Av. Sale per title | Av $ per title |
| 2007 | 938 | —— | 662,965 | —— | $10,936,728 | —– | 707 | $11,659.62 |
| 2008 | 1075 | 14.61% | 801,796 | 20.94% | $12,506,698 | 14.36% | 746 | $11,634.14 |
| 2009 | 1253 | 16.56% | 682,421 | -14.89% | $10,672,933 | -14.66% | 545 | $8,517.90 |
| 2010 | 1428 | 13.97% | 639,742 | -6.25% | $10,485,140 | -1.76% | 448 | $7,342.54 |
| 2011 | 1522 | 6.58% | 578,843 | -9.52% | $9,704,940 | -7.44% | 380 | $6,376.44 |
| 2012 | 1626 | 6.83% | 489,695 | -15.40% | $8,538,810 | -12.02% | 301 | $5,251.42 |
| 2013 | 1759 | 8.18% | 486,929 | -0.56% | $9,070,394 | 6.23% | 277 | $5,156.56 |
| 2014 | 1979 | 12.51% | 522,602 | 7.33% | $10,599,661 | 16.86% | 264 | $5,356.07 |
| 2015* | 1250 | -36.84% | 511,675 | -2.09% | $10,359,104 | -2.27% | 409 | $8,287.28 |
| 2016* | 1102 | -11.84% | 635,595 | 24.22% | $11,367,881 | 9.74% | 577 | $10,315.68 |
| 2017 | 2125 | 92.83% | 716,747 | 12.77% | $20,624,676 | 81.43% | 337 | $9,705.73 |
| 2018 | 2146 | 0.99% | 709,929 | -0.09% | $12,989,497 | -37.02% | 331 | $6,052.89 |
Dark Horse has one title over 20k on the Western charts, and seven more over 10k.
That is it for the top ten publishers, but there’s a few more publishers it’s worth singling out for attention because they have a historical value, they’re significant for either the book or comics markets, they are growing, or there is otherwise something of note about them!
Since this is a report on bookstore sales, let’s start with the last of the mainstream book world’s “Big Five”: Simon & Schuster. They only have three placing titles in the Top 750, none of which hit 10k.
Much of this is my decision this year to not count illustrated novels as “comics”, which loses Rachel Renee Russell and “Dork Diaries” and others.
Simon has several imprints, including Aladdin, Atria, Atheneum, Free Press, Margaret K. Elderberry, Gallery 13, Pocket, Scribner, and Touchstone. Their best-selling comic this year is from Simon proper, and is “Fake Blood”, at about 6300 copies.
Here is Simon & Schuster’s Long Tail, which includes the imprints that I’m aware of.
| Year | # of listed items | % Change | Total Pieces | % Change | Calculated Retail Value | % Change | Av. Sale per title | Av $ per title |
| 2007 | 12 | — | 8,317 | — | $158,014 | — | 693 | $13,167.83 |
| 2008 | 26 | 116.67% | 14,917 | 79.36% | $211,798 | 34.04% | 574 | $8,146.08 |
| 2009 | 41 | 57.69% | 109,558 | 634.45% | $1,430,544 | 575.43% | 2,672 | $34,891.32 |
| 2010 | 46 | 12.20% | 214,828 | 96.09% | $2,660,094 | 85.95% | 4,670 | $57,828.13 |
| 2011 | 62 | 34.78% | 187,531 | -12.71% | $2,383,491 | -10.40% | 3,025 | $38,443.40 |
| 2012 | 63 | 1.61% | 165,831 | -11.57% | $2,844,453 | 19.34% | 2,632 | $45,150.05 |
| 2013 | 67 | 6.35% | 258,931 | 56.14% | $4,165,350 | 46.44% | 3,865 | $62,169.40 |
| 2014 | 71 | 5.97% | 383,878 | 48.25% | $6,520,821 | 26.55% | 5,407 | $91,842.54 |
| 2015* | 75 | 5.63% | 910,341 | 237.14% | $13,386,461 | 205.29% | 12,138 | $178,486.15 |
| 2016* | 75 | —— | 618,922 | -32.01% | $9,477,798 | -29.20% | 8,252 | $126,370.64 |
| 2017 | 89 | 18.67% | 449,243 | -27.42% | $6,788,432 | -28.38% | 5,048 | $76,274.52 |
| 2018 | 88 | -1.12% | 38,804 | -91.36% | $739,664 | -89.10% | 441 | $8,405.27 |
Almost all of the 2018 drop is my dropping Rachel Renee Russell as “comics”, so this is on me, not them!
Simon & Schuster has no books over 10k this year.
If I kept counting past the Top Ten publishers, Henry N. Abrams would have come in at #11 – they place 17 titles, for 210k pieces and $2.9m in calculated retail sales.
They publish as Abrams Comicarts, Henry N. Abrams, as well as Amulet Books. They’re not considered one of the book world “Big Five”, but they’re not a traditional Direct Market publisher either.
Their best-selling book is “El Deafo” which does fantastic at 50k. The next best seller is the eighth volume of “Nathan Hale’s Hazardous Tales” – just over 23k copies of “Lafayette!” All eight chart, and six of them sell over 10k.
Here is your long-tail; solid performance:
| Year | # of listed items | Percent Change | Total Unit Sold | Percent Change | Calculated Retail value | Percent Change | Av. Sale per title | Av $ per title |
| 2008 | 3 | —— | 10,031 | —— | $148,675 | —— | 3,344 | $49,558.33 |
| 2009 | 25 | 733.33% | 24,116 | 140.41% | $640,635 | 330.90% | 965 | $25,625.40 |
| 2010 | 41 | 64.00% | 48,240 | 100.03% | $1,109,444 | 73.18% | 1,177 | $27,059.61 |
| 2011 | 49 | 19.51% | 31,846 | -33.98% | $731,054 | -34.11% | 650 | $14,919.47 |
| 2012 | 62 | 26.53% | 37,522 | 17.82% | $756,650 | 3.50% | 605 | $12,204.03 |
| 2013 | 70 | 12.90% | 72,538 | 93.32% | $3,278,063 | 333.23% | 1,036 | $46,829.47 |
| 2014 | 88 | 25.71% | 74,083 | 2.13% | $2,324,820 | -29.10% | 842 | $26,418.41 |
| 2015* | 92 | 4.55% | 145,633 | 96.58% | $1,898,267 | -18.35% | 1,583 | $20,633.34 |
| 2016* | 112 | 21.74% | 177,127 | 21.63% | $2,326,956 | 22.58% | 1,581 | $20,776,39 |
| 2017 | 124 | 10.71% | 248,580 | 40.34% | $3,449,807 | 48.25% | 2,005 | $27,821.02 |
| 2018 | 138 | 11.29% | 258,334 | 3.92% | $3,776,138 | 9.46% | 1,872 | $27,363.32 |
Henry N. Abrams has one book over 50k, two over 20k, and four more over 10k.
While not one of the “Big Five”, there are several other publishers that I would consider both “significant” as well as bookmarket-first who did well in the Top 750. In straight alphabetical: Bloomsbury (3 titles), Candlewick (3), Houghton Mifflin Harcourt (2), and Hyperion/Disney Press (8), Joe Books (3), and Skyhorse (8)
The first up is Bloomsbury, which marks its very first appearance here in building a long-tail. They place 3 books into the Top 750, for a total of almost 21k. Roz Chast’s two memoirs (“Can’t We Talk About Something More Pleasant” and “Going Into Town”) both sell over 10k copies – with 100 copies of each other!
First time long-tail:
| Year | # of listed items | Percent Change | Total Unit Sold | Percent Change | Calculated Retail value | Percent Change | Av. Sale per title | Av $ per title |
| 2007 | 1 | — | 2,409 | — | $28,788 | — | 2409 | $28,788.00 |
| 2008 | 4 | 300.00% | 8,878 | 268.53% | $142,561 | 395.21% | 2220 | |
| 2009 | 8 | 200.00% | 30,663 | 245.38% | $643,517 | 351.40% | 3833 | |
| 2010 | 9 | 12.50% | 26,132 | -14.78% | $524,642 | -18.47% | 2904 | |
| 2011 | 10 | 11.11% | 17,663 | -32.41% | $343,201 | -34.58% | 1766 | |
| 2012 | 12 | 20.00% | 10,749 | -39.14% | $207,938 | -39.41% | 896 | |
| 2013 | 12 | — | 8,034 | -25.26% | $155,776 | -25.09% | 670 | |
| 2014 | 15 | 25.00% | 81,758 | 917.65% | $2,211,181 | 1319.46% | 5451 | |
| 2015* | 20 | 33.33% | 56,006 | -31.50% | $1,480,162 | -33.06% | 2800 | |
| 2016* | 23 | 15.00% | 14,990 | -73.24% | $303,296 | -79.51% | 652 | |
| 2017 | 21 | -8.70% | 31,709 | 111.53% | $839,044 | 176.64% | 1510 | |
| 2018 | 26 | 12.81% | 35,256 | 11.19% | $806,512 | -3.87% | 1356 |
Bloomsbury has two titles over 10k.
Also here for the first time is Candlewick. They also place three titles, for just over 50k. The best selling is “Flora & Ulysses” which is mostly prose, but does have a significant enough comics section in it to be on “this side” of the line for the category. It sells 29k copies. They also move about 15k copies of “Timmy Failure: Mistakes Were Made”
Here’s a Long Tail:
| Year | # of listed items | Percent Change | Total Unit Sold | Percent Change | Calculated Retail value | Percent Change | Av. Sale per title | Av $ per title |
| 2008 | 6 | — | 5,034 | — | $56,024 | — | 839 | $9,337.33 |
| 2009 | 18 | 200.00% | 9,688 | 92.45% | $103,287 | 84.36% | 538 | $5,738.17 |
| 2010 | 24 | 33.33% | 14,857 | 53.35% | $202,687 | 96.24% | 619 | $8,445.29 |
| 2011 | 29 | 20.83% | 19,158 | 28.95% | $286,615 | 41.41% | 661 | $9,883.28 |
| 2012 | 30 | 3.45% | 15,884 | -17.09% | $221,438 | -22.74% | 529 | $7,381.27 |
| 2013 | 31 | 3.33% | 18,710 | 17.79% | $282,320 | 27.49% | 604 | $9,107.10 |
| 2014 | 28 | -9.68% | 19,780 | 5.72% | $301,845 | 6.92% | 706 | $10,780.18 |
| 2015* | 48 | 71.43% | 57,018 | 188.26% | $652,681 | 116.23% | 1188 | $13,597.52 |
| 2016* | 39 | -18.75% | 28,318 | -50.33% | $436,806 | -33.08% | 726 | $11,200.15 |
| 2017 | 41 | 5.13% | 46,024 | 62.53% | $503,622 | 15.30% | 1123 | $12,283.46 |
| 2018 | 51 | 24.39% | 66,313 | 44.08% | $622,460 | 23.60% | 1300 | $12,205.10 |
Candlewick has one book over 20k and one over 10k.
Houghton Mifflin Harcourt publishes comics both as HMH and Mariner. They place two titles into the Top 750 that total about 27k
The best-seller is Alison Bechdel’s “Fun Home” which does 22k. They also place about 4200 copies of Bechdel’s “Are You My Mother?” into the Top 750.
The Long Tail:
| Year | # of listed items | Percent Change | Total Unit Sold | Percent Change | Calculated Retail value | Percent Change | Av. Sale per title | Av $ per title |
| 2007 | 4 | —— | 20,474 | —— | $434,495 | —— | 5119 | $108,623.75 |
| 2008 | 6 | 50.00% | 14,183 | -30.73% | $307,019 | -29.34% | 2363 | $51,169.83 |
| 2009 | 14 | 233.33% | 24,568 | 73.22% | $436,328 | 42.12% | 1755 | $31,166.29 |
| 2010 | 17 | 21.43% | 29,163 | 18.70% | $532,539 | 22.05% | 1715 | $31,325.82 |
| 2011 | 18 | 5.88% | 24,239 | -16.88% | $450,536 | -15.40% | 1347 | $25,029.78 |
| 2012 | 21 | 16.67% | 23,562 | -2.79% | $402,575 | -10.65% | 1122 | $1,9170.24 |
| 2013 | 29 | 38.10% | 44,558 | 89.11% | $687,920 | 70.88% | 1536 | $23,721.38 |
| 2014 | 27 | -6.90% | 32,751 | -26.50% | $552,884 | -19.63% | 1213 | $20,477.19 |
| 2015* | 33 | 22.22% | 78,357 | 239.25% | $1,214,786 | 219.72% | 2374 | $36,811.70 |
| 2016* | 38 | 15.15% | 60,359 | -22.97% | $943,188 | 22.36% | 1588 | $24,820.74 |
| 2017 | 27 | -28.95% | 42,963 | -28.82% | $710,481 | -24.67% | 1591 | $26,314.11 |
| 2018 | 60 | 222.22% | 41,596 | -3.18% | $701,891 | -1.21% | 693 | $11,698.18 |
Houghton Mifflin Harcourt has just the one book over 20k.
Hyperion/Disney Press is, like Marvel, also owned by Disney. Technically, that probably means I should fold them together, but I resist, how I resist (largely because they are distributed separately). Hyperion has eight placing titles, doing 104k. The best-selling title is 54k copies of “Gravity Falls: Lost Legends”, but they also shift 16k copies of the adaptation of “Percy Jackson: The Lightning Thief”
| Year | # of listed items | Percent Change | Total Unit Sold | Percent Change | Calculated Retail value | Percent Change | Av. Sale per title | Av $ per title |
| 2007 | 10 | —– | 39,121 | —– | $336,771 | —– | 3912 | $33,677.10 |
| 2008 | 19 | 90.00% | 41,005 | 4.82% | $409,051 | 21.46% | 2158 | $21,529.00 |
| 2009 | 24 | 26.32% | 23,301 | -43.18% | $234,078 | -42.78% | 971 | $9,753.25 |
| 2010 | 26 | 8.33% | 30,860 | 32.44% | $314,067 | 34.17% | 1187 | $12,079.50 |
| 2011 | 29 | 11.54% | 46,553 | 50.85% | $392,652 | 25.02% | 1605 | $13,539.72 |
| 2012 | 31 | 6.90% | 33,105 | -28.89% | $376,735 | -4.05% | 1068 | $12,152.74 |
| 2013 | 33 | 6.45% | 102,537 | 209.73% | $1,298,672 | 244.72% | 3107 | $39,353.70 |
| 2014 | 38 | 15.15% | 77,045 | -24.86% | $1,015,188 | -21.83% | 2028 | $26,715.49 |
| 2015* | 57 | 50.00% | 63,290 | -17.85% | $831,477 | -18.10% | 1110 | $14,587.32 |
| 2016* | 36 | -36.84% | 61,730 | -2.46% | $926,504 | 11.43% | 1715 | $25,736.22 |
| 2017 | 41 | 13.89% | 99,589 | 61.33% | $1,592,970 | 71.93% | 2429 | $38,852.93 |
| 2018 | 54 | 31.71% | 132,623 | 33.17% | $2,228,412 | 39.89% | 2456 | $41,266.89 |
Hyperion has one book over 50k, and another over 10k.
Joe Books mostly just do screen-cap fumetti (Or as they call them, “cinestory”). Their best-seller in 2018 is the first volume of “Gravity Falls”, at 6700 copies. Three titles total place, for all of 17k copies. However, at press time I just found out that Joe Books has just ceased operations, so this may well be the last time we see them on these charts. I’d built the long-tail already, so here it is.
| Year | # of listed items | Percent Change | Total Unit Sold | Percent Change | Calculated Retail value | Percent Change | Av. Sale per title | Av $ per title |
| 2014 | 1 | — | 22,740 | — | $340,873 | — | 22,740 | $340,873.00 |
| 2015* | 13 | 1200.00% | 66,375 | 291.88% | $1,047,511 | 307.30% | 5,106 | $80,577,77 |
| 2016* | 43 | 230.77% | 139,487 | 110.15% | $1,661,338 | 58.60% | 3,244 | $38,635.77 |
| 2017 | 99 | 130.23% | 135,130 | -3.12% | $1,610,875 | -3.04% | 1,365 | $16,271.46 |
| 2018 | 117 | 18.18% | 73,134 | -45.88% | $873,304 | -45.79% | 625 | $7,464.14 |
Joe Books has two titles over 20k, and three more over 10k.
Skyhorse (placing eight books for just over 71k total) is here on the strength of screencap fumetti comics taken from “Minecraft” published in their Sky Pony imprint. All of these comics are “unofficial”, however, as they’re not licensing the Minecraft brand or engine to do so. The best-seller, “Saving Xenos” is their sixth “unofficial” Minecraft GN, and does almost 13k copies, and they have two others which also top 10k. I don’t really have anything else to say about them, though!
Here’s their long tail, such as it is:
| Year | # of listed items | Percent Change | Total Unit Sold | Percent Change | Calculated Retail value | Percent Change | Av. Sale per title | Av $ per title |
| 2012 | 2 | — | 180 | — | $2,331 | — | 90 | $1,165.50 |
| 2013 | 4 | 100.00% | 1,227 | 681.67% | $15,897 | 681.98% | 307 | $3,974.25 |
| 2014 | 4 | — | 458 | -62.67% | $6,191 | -61.06 | 115 | $1,547.75 |
| 2015* | 5 | 25.00% | 14,011 | 3059.17% | $168,332 | 2718.98% | 2,802 | $33,666.40 |
| 2016* | 6 | 20.00% | 51,833 | 369.95% | $622,000 | 369.51% | 8,639 | $103,666.67 |
| 2017 | 26 | 433.33% | 81,366 | 56.98% | $1,144,071 | 83.93% | 3,129 | $44,002.73 |
| 2018 | 35 | 34.62% | 87,021 | 6.95% | $1,326,292 | 15.93% | 2,486 | $37,894.06 |
Skyhorse has three books over 10k.
Outside of those bookstore-native publishers, we’ve got several Direct Market-native publishers who placed more than three titles into the Top 750. Those would be: IDW (7), Oni (7), Boom (5), Archie (3), Drawn & Quarterly (3), Fantagraphics (3), and Nobrow (3)
IDW Publishing places seven books for a total of 84k sold. Representative John Lewis’s “March” trilogy, his memoir about the civil rights struggle of the 1960s, is absolutely their biggest hit. Volume 1 sells 35k, v2 sells 13k, and v3 sells just under 10k, while the boxed set of the whole trilogy shifts 11k through BookScan reporters. I will never ever understand why, for a historical-driven series like this there’s such a wide spread between v1 and v3.
They have no other books over 10k this year.
IDW moved their bookstore distribution over to Penguin Random House (and away from Diamond Books) in 2017, joining DC and Dark Horse. This doesn’t seem to have helped them, judging by their long tail – double digit decline this year. Here is IDW’s Long Tail:
| Year | # of listed items | Percent Change | Total Unit Sold | Percent Change | Calculated Retail value | Percent Change | Av. Sale per title | Av $ per title |
| 2007 | 233 | —— | 102,118 | —— | $2,090,647 | —– | 438 | $8,972.73 |
| 2008 | 335 | 43.78% | 146,125 | 43.09% | $2,766,505 | 32.33% | 436 | $8,258.22 |
| 2009 | 477 | 42.39% | 215,907 | 47.76% | $4,346,836 | 57.12% | 453 | $9,112.86 |
| 2010 | 623 | 30.61% | 161,578 | -25.16% | $3,653,680 | -15.95% | 259 | $5,864.65 |
| 2011 | 785 | 26.00% | 206,136 | 27.58% | $4,884,606 | 33.69% | 263 | $6,222,43 |
| 2012 | 937 | 19.36% | 162,599 | -21.12% | $4,329,973 | -11.35% | 174 | $4,621.10 |
| 2013 | 1059 | 13.02% | 180,694 | 11.13% | $4,443,372 | 2.62% | 171 | $4,195.82 |
| 2014 | 1134 | 7.08% | 228,895 | 26.68% | $5,309,992 | 19.50% | 200 | $4,641.40 |
| 2015* | 959 | -15.43% | 310,512 | 35.66% | $6,478,023 | 22.00% | 324 | $6,754.98 |
| 2016* | 978 | 1.98% | 343,197 | 10.53% | $8,194,098 | 26.49% | 351 | $8,378.42 |
| 2017 | 1639 | 67.59% | 346,368 | 0.92% | $8,278,617 | 1.03% | 211 | $5,051.02 |
| 2018 | 1811 | 10.05% | 279,435 | -19.32% | $6,525,696 | -21.17% | 154 | $3,603.37 |
IDW has one book over 20k, and two more over 10k.
Oni Press is our next publisher, with seven placing books for about 38k total. “Rick and Morty” is their biggest hit, with v1 selling a bit over 6600 copies
Here’s Oni’s Long Tail
| Year | # of listed items | Percent Change | Total Unit Sold | Percent Change | Calculated Retail value | Percent Change | Av. Sale per title | Av $ per title |
| 2007 | 125 | —— | 11,294 | —— | $141,829 | —– | 90 | $1,134.63 |
| 2008 | 138 | 10.40% | 21,843 | 93.40% | $320,799 | 126.19% | 158 | $2,324.63 |
| 2009 | 149 | 7.97% | 51,584 | 136.13% | $713,121 | 122.30% | 346 | $4,786.05 |
| 2010 | 156 | 4.70% | 446,791 | 866.14% | $5,882,247 | 824.86% | 2864 | $37,706.71 |
| 2011 | 177 | 13.46% | 162,275 | -63.68% | $2,786,438 | -52.63% | 917 | $15,742.59 |
| 2012 | 171 | -3.39% | 80,560 | -50.36% | $1,594,016 | -42.79% | 471 | $9,321.73 |
| 2013 | 195 | 14.04% | 68,140 | -15.42% | $1,401,748 | -12.06% | 349 | $7,188.45 |
| 2014 | 213 | 9.23% | 61,584 | -9.62% | $1,303,069 | -7.04% | 289 | $6,117.70 |
| 2015* | 165 | -22.54% | 65,254 | 5.96% | $1,478,997 | 11.35% | 395 | $8,963.62 |
| 2016* | 191 | 15.76% | 90,222 | 38.26% | $1,992,643 | 34.73% | 472 | $10,432.69 |
| 2017 | 283 | 48.17% | 117,950 | 30.73% | $2,847,629 | 42.91% | 417 | $10,062.29 |
| 2018 | 323 | 14.13% | 108,897 | -7.68% | $2,595,362 | -8.86% | 337 | $8,035.18 |
Oni has no books over 10k.
Boom! Sells five titles into the Top 750, for almost 27k, using the imprints Archaia, Boom, Boom Box, Boom Town, and Kaboom. Four of the five of those placing titles are “Lumberjanes”, with v1 the strongest at 9200 copies.
The Long tail:
| Year | # of listed items | Percent Change | Total Unit Sold | Percent Change | Calculated Retail value | Percent Change | Av. Sale per title | Av $ per title |
| 2007 | 21 | —– | 10,462 | —– | $246,984 | —— | 498 | $11,761.14 |
| 2008 | 44 | 109.52% | 10,943 | 4.60% | $394,361 | 59.67% | 249 | $8,962.75 |
| 2009 | 93 | 111.36% | 25,378 | 131.91% | $485,485 | 23.11% | 273 | $5,220.27 |
| 2010 | 202 | 117.20% | 64,770 | 155.22% | $1,140,019 | 134.82% | 321 | $5,643.66 |
| 2011 | 253 | 25.25% | 75,472 | 16.52% | $1,435,514 | 25.92% | 298 | $5,673.97 |
| 2012 | 307 | 21.34% | 59,758 | -20.82% | $1,160,894 | -19.13% | 195 | $3,781.41 |
| 2013 | 347 | 13.03% | 86,637 | 44.98% | $1,650,374 | 42.16% | 250 | $4,756.12 |
| 2014 | 388 | 11.82% | 108,504 | 25.24% | $1,894,658 | 14.80% | 280 | $4,883.14 |
| 2015* | 295 | -23.97% | 126,029 | 16.15% | $2,159,071 | 13.96% | 427 | $7,318.88 |
| 2016* | 309 | 4.75% | 134,386 | 6.63% | $2,313,502 | 7.15% | 435 | $7,487.06 |
| 2017 | 633 | 104.85% | 171,133 | 27.34% | $2,983,775 | 28.97% | 270 | $4,713.70 |
| 2018 | 768 | 21.33% | 198,773 | 16.15% | $3,659,046 | 22.63% | 259 | $4,764.38 |
Boom! just has no books over 10k.
Archie Comics places three books in the Top 750, selling 17k copies. It is probably not a surprise that the best seller is “The Chilling Adventures of Sabrina”, which sells about 9500 copies
Here’s Archie’s Long Tail:
| Year | # of listed items | Percent Change | Total Unit Sold | Percent Change | Calculated Retail value | Percent Change | Av. Sale per title | Av $ per title |
| 2007 | 18 | —— | 12,443 | —— | $103,998 | —– | 691 | $5,777.67 |
| 2008 | 26 | 44.44% | 25,046 | 101.29% | $220,207 | 111.74% | 963 | $8,469.50 |
| 2009 | 33 | 26.92% | 26,998 | 7.79% | $246,557 | 11.97% | 818 | $7,471.42 |
| 2010 | 43 | 30.30% | 24,828 | -8.04% | $227,014 | -7.93% | 577 | $5,279.40 |
| 2011 | 62 | 44.19% | 51,551 | 107.63% | $528,353 | 132.74% | 831 | $8,521.82 |
| 2012 | 85 | 37.10% | 66,988 | 29.95% | $797,165 | 50.88% | 788 | $9,378.41 |
| 2013 | 110 | 29.41% | 79,978 | 19.39% | $974,889 | 22.29% | 727 | $8,862.63 |
| 2014 | 148 | 34.55% | 92,953 | 16.22% | $1,170,486 | 20.06% | 628 | $7,908.69 |
| 2015* | 165 | 11.49% | 75,222 | -19.08% | $892,756 | -23.73% | 456 | $5,410.64 |
| 2016* | 163 | -1.21% | 56,241 | -25.23% | $730,252 | -18.20% | 345 | $4,480.07 |
| 2017 | 156 | -4.29% | 72,574 | 29.04% | $1,102,457 | 50.97% | 465 | $7,067.03 |
| 2018 | 199 | 27.56% | 72,014 | -0.08% | $1,105,711 | 0.03% | 362 | $5,556.34 |
Archie has no books over 10k
Drawn & Quarterly places three books into the Top 750, for about 21k copies. Their best-seller is 12k of “Sabrina” – no not the Netflix show, the Man Booker award finalist by Nick Drnaso. First time a comic has ever been up for that prestigious award!
| Year | # of listed items | Percent Change | Total Unit Sold | Percent Change | Calculated Retail value | Percent Change | Av. Sale per title | Av $ per title |
| 2007 | 62 | — | 24,689 | — | $500,764 | — | 398 | $8,076.84 |
| 2008 | 82 | 32.26% | 42,038 | 70.27% | $912,774 | 82.28% | 513 | $11,131.39 |
| 2009 | 107 | 30.49% | 42,957 | 2.19% | $920,014 | 0.79% | 401 | $8,598.26 |
| 2010 | 126 | 17.76% | 44,737 | 4.14% | $1,009,387 | 9.71% | 355 | $8,011.01 |
| 2011 | 145 | 15.08% | 62,286 | 39.23% | $1,399,793 | 38.68% | 430 | $9,653.74 |
| 2012 | 155 | 6.90% | 43,098 | -30.81% | $926,233 | -33.83% | 278 | $5,975.70 |
| 2013 | 189 | 21.94% | 41,887 | -2.81% | $893,905 | 3.49% | 222 | $4,729.66 |
| 2014 | 205 | 8.47% | 46,030 | 9.90% | $1,032,032 | 15.45% | 225 | $5,034.30 |
| 2015* | 219 | 6.83% | 73,471 | 59.62% | $1,680,878 | 62.87% | 335 | $7,675.24 |
| 2016* | 233 | 6.39% | 57,326 | -21.97% | $1,266,170 | -24.67% | 246 | $5,434.21 |
| 2017 | 247 | 6.01% | 68,087 | 18.77% | $1,548,813 | 22.32% | 276 | $6,270.50 |
| 2018 | 285 | 15.38% | 79,765 | 17.15% | $2,055,019 | 32.68% | 280 | $7,210.59 |
Drawn & Quarterly has one book over 10k.
Here’s something slightly surprising: this is the first time Fantagraphics has placed enough books into the Top 750 to get a write up – they place three books for about 22k total, with the most successful title being the amazing “My Favorite Thing is Monsters” by Emil Ferris with 13k copies sold.
For the first time ever, here’s Fantagraphics’ long tail!
| Year | # of listed items | Percent Change | Total Unit Sold | Percent Change | Calculated Retail value | Percent Change | Av. Sale per title | Av $ per title |
| 2007 | 201 | — | 35,903 | — | $640,565 | — | 179 | $3,186.89 |
| 2008 | 239 | 18.91% | 43,675 | 21.65% | $1,126,587 | 75.87% | 183 | $4,713.75 |
| 2009 | 263 | 10.04% | 46,562 | 6.61% | $1,149,082 | 2.00% | 177 | $4,369.13 |
| 2010 | 304 | 15.59% | 50,332 | 8.10% | $1,156,205 | 0.62% | 166 | $3,803.31 |
| 2011 | 339 | 11.51% | 57,278 | 13.80% | $1,327,308 | 14.80% | 169 | $3,915.36 |
| 2012 | 387 | 14.16% | 47,476 | -17.11% | $1,094,131 | -17.57% | 123 | $2,827.21 |
| 2013 | 422 | 9.04% | 52,278 | 10.11% | $1,266,936 | 15.79% | 124 | $3,002.22 |
| 2014 | 440 | 4.27% | 53,215 | 1.79% | $1,685,171 | 33.01% | 121 | $3,829.93 |
| 2015* | 394 | -10.45% | 58,938 | 10.75% | $1,835,796 | 8.94% | 150 | $4,659.38 |
| 2016* | 421 | 6.85% | 67,241 | 14.09% | $1,975,421 | 7.61% | 160 | $4,692.21 |
| 2017 | 509 | 20.90% | 81,076 | 20.58% | $2,599,552 | 31.59% | 159 | $5,107.17 |
| 2018 | 617 | 21.22% | 95,600 | 17.91% | $2,843,762 | 9.39% | 155 | $4,609.01 |
Fantagraphics has one book over 10k
Also the first time we’re building a long-tail, here’s Nobrow (which only started in 2011, can you believe?) – they have three books placing for just under 20k total. They are all volumes of “Hilda”, drafting on the Netflix animated adaptation, with “Hilda and the Troll” selling just over 10k.
Here’s the Nobrow long-tail:
| Year | # of listed items | Percent Change | Total Unit Sold | Percent Change | Calculated Retail value | Percent Change | Av. Sale per title | Av $ per title |
| 2011 | 6 | — | 31 | — | $485 | — | 5 | $80.83 |
| 2012 | 28 | 366.67% | 3,062 | 9777.42% | $60,537 | 12381.86% | 109 | $2,162.04 |
| 2013 | 36 | 12.57% | 4,536 | 48.14% | $93,703 | 54.78% | 126 | $2,602.86 |
| 2014 | 45 | 25.00% | 9,612 | 111.90% | $222,681 | 137.65% | 214 | $4,948.47 |
| 2015* | 47 | 4.44% | 13,095 | 36.24% | $269,445 | 21.00% | 279 | $5,732.88 |
| 2016* | 51 | 8.51% | 14,867 | 13.53% | $255,229 | -5.28% | 292 | $5,004.49 |
| 2017 | 69 | 35.29% | 21,997 | 47.96% | $380,323 | 49.01% | 319 | $5,511.93 |
| 2018 | 76 | 10.14% | 43,249 | 96.61% | $617,854 | 62.25% | 569 | $8,129.66 |
Nobrow has the one book over 10k.
No publisher that has not been mentioned placed more than three titles within the Top 750, which leaves me with fourteen more books from twelve different publishers.
Only two of the remaining placing books sell over 10k copies. First is The Fantastic Flatulent Fart Brothers Big Book of Farty Facts which sells, gosh, 16k copies. It is published by Top Floor Books. Also over 10k is the wonderful Sheets by Brenna Thummler, and published by Lion Forge.
After that, none of the remaining books sell 10k, so they don’t get individual write ups (I’m tired! This is over 20k words already!)
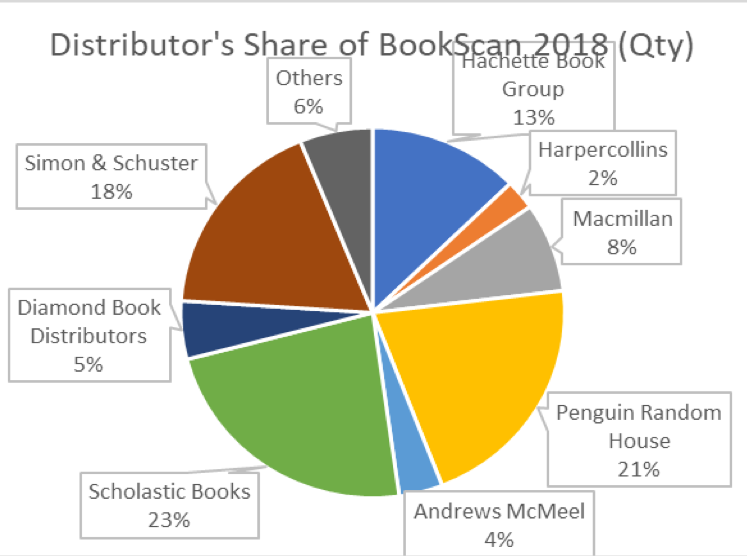
A few final bits of number-crunching for fun before we go for the year!
First and foremost: I’m sure you noticed that one of the columns on the BookScan chart is listed as “publishers”. I’ve never been able to understand why: that column is clearly the distributor column, with the (very very) weird exception of DC Comics. DC (and Dark Horse, and IDW, and others) are distributed by Random House in the bookstore market, not Diamond. Marvel is distributed by Hachette. Boom! is distributed by Simon, and so on. Now most analysis that I do I get fairly rigorous about going in and fixing problems, but this is a simple search. So who are the leaders for distribution?
Turns out it looks like this in 2018:
Not what you pictured in your head, was it? This chart is one of the reasons why it is hard to call Diamond a true “monopoly”, despite their presumptive domination in the Direct Market.
Lastly: if we look at the entirety of the 38k-long “Long Tail” BookScan list, how do the publishers stack up in 2018? This is everything, including both “east” and “west” comics, and we’ll sort it by Calculated Retail Value, and rounding everything to the nearest hundred-thousand just for ease of presentation – Scholastic is strongly the biggest publisher in the Book stores, followed by Viz, then DC. Marvel is now within striking distance of that #3 spot. This is a pretty radical change from previous years.
#1 Scholastic Books $54.6
#2 Viz $44.4
#3 DC Comics $31.8
#4 Marvel $29.7
#5 Hachette $17.6
#6 Image $15.0
#7 Dark Horse $13.0
#8 Kodansha $12.6
#9 Andrews McMeel $11.9
#10 Macmillan $11.7
Or, if you’d prefer a visual chart?
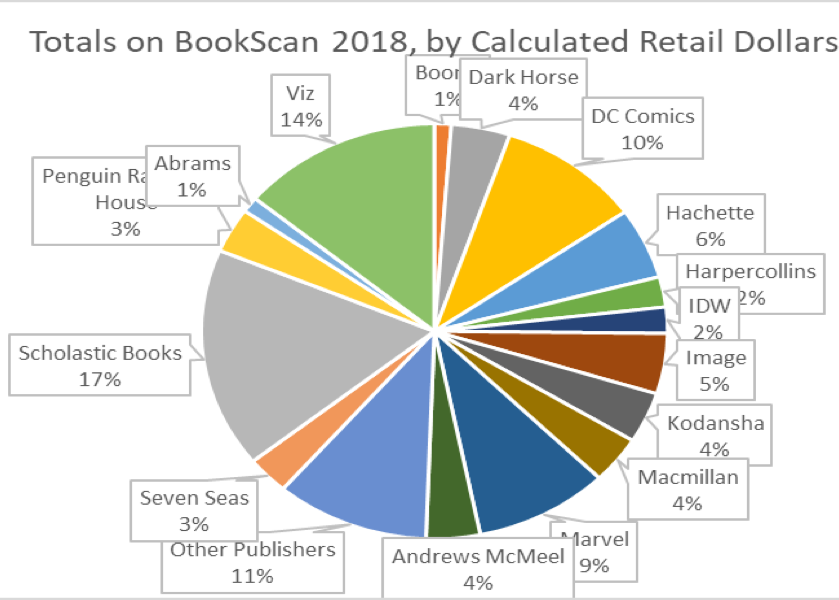 And that’s pretty much what BookScan in 2018 looks like to these eyes.
How does it look to you?
Methodology:
“Direct Market” stores (also known as “your Local Comics Shop”) buy much of their material for resale from Diamond Comics Distributors (though, not, by any means, all of the material your LCS has for sale – many DM stores are also buying from book-market wholesalers, or directly from publishers and have been for years). While many DM stores have Point-of-Sales (POS) systems, because our market buys non-returnable what we track in our side of the industry is what sells-in to the store, not what sells-through to the eventual consumer. In a very real way, this means that the DM store owner is the actual customer of the publisher, as opposed to the end consumer.
The bookstore market, however, buys their material semi-returnable, where they can send back some portion of titles that don’t sell (but not, usually, all unsold product). Because of this, sell-through is the data that is tracked and trended. Bookstores that have POS systems are able to report their sales to BookScan, a subsidiary of The NPD Group (they bought it from Nielsen).
BookScan tracks the specific sales to consumers through its client stores. I had several well trained spies who have, for many years, provided me with access to the BookScan reports at the end of each year. However, I am very excited to say that we are now getting the BookScan reports directly from The NPD Group, with no filter or middleman! This is our second year of doing so.
However, getting “official” detail has brought a major change this year: NPD Group no longer wants us releasing the actual data, even the pretty tight “Top 750” as has been our historical practice. I am fairly certain that, if you know how to search the internet, you could probably turn up previously published links from 2003 through 2017, but going forward, you will have to trust my abstract of the charts, rather than seeing the charts themselves. So sorry!
For some historical context, we have three “eras” of data: 2003-2005 numbers are “what is YTD sold, IF it made the chart in the last week of the year?”
2006-2016: the full “here’s everything that sold throughout the entire year”, but filtered through a leaker – almost certainly accurate, but absolutely missing some bits due to methodology changes and differences, even year-by-year. Important: in 2015 and 2016 I received lists that appeared to be lightly edited, potentially down to “books that are in print at the publisher level only” (obviously, there’s still stock out there on the shelves of stores and in warehouses that is not “in print” per se). Those two years are asterisked to reflect that!
2017-now: “Everything” sold in the calendar year, with no filter. (Though see further notes below!)
Just bear this all in mind if you compare the various “eras” against one another. These are not inherently apples-to-apples comparisons as a result! This year’s percentages are likely to be wacky compared to 2016, but moving forward there should be a much deeper consistency of data.
The biggest and most obvious difference when doing straight comparisons will be in the lower ends of the chart. This year, the “worst selling” book in the Top 750 is just about 3800 copies (about flat from the same 4k in 2016 and 2017, and up from about 3600 copies in 2015 and 2900 copies in 2014) In ’03-‘05 there would be many items that didn’t have YTD sales in anything like that amount.
Also of major note is that starting in 2007, I have had the “full and entire” BookScan listing, down to books that have only one copy sold YTD. However, I’ve never tried to really analyze that entire list because that’s too much data, even for a data-junkie like myself. I’ve cut the list off at 750 items because that’s what we’ve historically reported. Still, I have the deeper data, and I’ll summarize it as we go along. As long as I continue to get that much data going forward, I should be able to tell you a few things about “The Long Tail”. In 2018, I possess data on over 38,422 items! We’ll talk more about this later in some depth, including the methodology of how these are generated.
This is important, however: this is not a list of every book that sold through every book store – the report is limited to those stores that report to BookScan. According to BookScan, more than 16,000 retail locations report to them, but this still leaves many venues that don’t.
Nielsen claimed in 2013 that approximately 85% of retail, physical book sales are tracked through them, though this number appears very much in doubt as an actionable percentage for any specific individual book. A quick internet search can find any number of cases of authors saying that BookScan numbers show half or less of their royalty statements. There’s some really excellent discussion on why and by how much BookScan numbers might be off right here.
BookScan says “Barnes & Noble, Amazon, Costco, General Independents, Hastings, Target, BJ’s, K-Mart, Hudson Group, Meijers, Follett Books, Books-A-Million, CEO Read, Powells, Toys R Us, Shoprite, SuperValu, Sam’s Club and Walmart are among our many data providers.”
What sales do BookScan not track? Among others, this would include libraries, schools, specialty stores (like comic book stores!) and book clubs and fairs. BookScan does report sales from the indie bookstores of the American Booksellers Association—data represents sales from roughly 1,200 locations. For many books those are very very important sales channels, and thus, BookScan under-reports by some potentially significant degree, and don’t, in any way, represent all physical book sales or even all “book stores” selling comic book material.
There’s also a certain amount of miscategorization going on. As an example, for the last sixteen years the purely-prose novel Bloody Crown of Conan appears on my list, while other books (see; Dork Diaries in a few paragraphs) might appear one year, and disappear another. I do not know what the actual extent of miscategorization might be and how it would impact any of the general data analysis! There are simply too many potential data points to possibly connect them all together in the time I have to assemble this column.
I’ve done the best I can to try and root out any items “of significance” that should be on the chart that I’m given, but are not – for example, I have to have The Complete Persepolis and Maus manually pulled for me every year because of how BISAC codes work. Because this relies on me catching these titles to get them on to the list this means there’s almost certainly comics material missing that I didn’t catch. If you can think of a book I might have missed, please email me, and I’ll try to track down the sales for it, and update my listings for the future! Even with my multiple safeguards, the datastream is too wide for me to not make mistakes. I make constant mistakes, as you’ll see further down in the body of the column.
Either way, what I’m trying to get across to you is that this really is entirely unreliable data in terms of the absolute and total number of books sold, and is only able to give the broadest possible outline of what’s happening in book stores, based upon the data-set that I’m being given, which is in no way comprehensive. I still think that’s much much better than having no information, so I persevere in writing this each year. Also, now that I am getting directly from the NPD Group, I feel much more confident that I at least know where the potential problems generally are.
Again, I want to stress that I’m doing my primary analysis on the Top 750 items: the reason for this is that is all that I was able to get in the first four years of this analysis, and otherwise the percentage changes I’m discussing will be even more wrong than they would be otherwise. The Top 750 represents more than half of the total of the full list, and has consistently for years – in 2018 the Top 750 was roughly 11.8 million books sold; the bottom thirty-eight thousand-ish represents just about 8.2 million books sold. While there are significant sales below the Top 750, the Top 750 probably represents the majority of items you’d be able to “easily” find on the shelf of a bookstore in America. I’d love to analyze the full “long tail” list, but I’m afraid that this might take these little essays to triple their current size, and keeping your attention just through this seems hard enough to me! Maybe if someone paid me by the word…
Finally, it is probably worth mentioning that although I’m analyzing primarily units sold, I also have some calculations that are purely my own of dollars that they would have been if they were sold at full retail. BookScan does not report on the price that a book actually sold for, so the extrapolation of dollars that I made could be dramatically overstated. More than “could be”: it probably is… because Amazon sells so many books, often at crazy steep discounts. In no way should you take any “Calculated Retail Value” as TRUE – these are just to provide a series of benchmarks, and to help you see the impact and differences that “cover price” can make in sales.
If it was not obvious, this only counts physical books, and does not include any digital sale of any kind; it does however, include all physical books sold through Amazon.
One of the things I really never talk about is how I get this data each year. I certainly don’t have a BookScan account (they’re pretty expensive!), so I have historically dependent on leaks from industry sources. But this means that the methodology with which the data was generated may actually be very different from year to year. The thing is, since I don’t generate these, BookScan methodology is still largely a Black Box to me. For a guy who writes these reports for 16 (!) years, I still have only really a passing knowledge of how things work. I am learning, slowly, though!
Now that the NPD Group is directly providing us data, we can assume that the methodology itself will not change going forward. I got a lot more data this year than is usual (one of the reasons this is so much later than usual!), with nearly 47k data points which took some substantial cleaning to get down to the 38k we’re actually using.
A Bunch of Information about BISAC codes and how this report is generated!
Here’s where we learn a little bit about the Book Industry Standards and Communications (or “BISAC”) codes. It turns out that the publishers assign them themselves, and that publishers are allowed to assign up to four different BISAC codes per item. For example: “Diary of a Wimpy Kid” is classified as “Juvenile Fiction: Humorous Stories”; “Juvenile Fiction: Comics & Graphic Novels: General”; and “Juvenile Fiction: Social Issues: General”. But the kicker is that BookScan reports will only spit out for the first BISAC listed for any given book. That is why “Diary of a Wimpy Kid” never ever showed on any of our previous reports, because the “comics” designation of the BISAC is listed second for that series! Conceptually I could also ask for “Juvenile Fiction: Humorous Stories” report, too – but that’s going to have thousands and thousands of prose-only, not-even-slightly-comics items on it, and working to cut those would quintuple the hours I spend on this (no thanks!) This is also why I have to manually ask for titles like “Maus” or “Persepolis” or “Understanding Comics” each and every year – not because they don’t contain the BISAC for comics (“CGN00xxxx” are the primary ones, for the record), but because that BISAC isn’t listed first!
Now, historically, this has really been opaque to me, to the point where I didn’t even really know what BISAC was what, but The NPD Group has been incredibly forthcoming in 2017, and I’m learning enough that I almost understand it. First and foremost, we’re now having the report generated using the codes for “Comics & Graphic Novels” (CGN), as well as the “comics” portions of “Juvenile” fiction (JUV) and nonfiction (JNF), and Young Adult Fiction (YAF) and non-fiction (YAN). Please note that the J and Y series of codes extend far past “comics”, but our search is for the narrower section. In addition to that, the NPD Group pulled records for three prominent authors that seldom showed up without intervention: Art Spiegelman, Marjane Satrapi, and Scott McCloud (As well as a small handful of books that I crosschecked against my own best sellers)
So you know, there are more than seventy-five “main” BISACs that we’re pulling in full.
Again, the publishers are the ones who assign the BISACs, and they can assign up to four per book. But reports can only generate (for now) from what the first BISAC code is listed – The NPD Group tells me they’re working on fixing that, but it’s a limitation of the current tools. That’s why they pulled by Author for Art Spiegelman – and look at how MAUS breaks down: the first individual volume has a primary BISAC of HIS022000 (“History: Jewish”), while the complete hardcover is BIO006000 (“Biography: Historical”). But the box set of the two paperbacks is BIO000000 (“Biography: General”), and METAMAUS (the book, with supporting documentation) for some reason is categorized as LIT017000 (“Literary: Comics & Graphic Novels”) which I’m not at all certain how that is different from CGN006000 (“Comics & Graphic Novels: Literary”) – but my point is that you have essentially one book that the publisher itself doesn’t really know what the “primary” BISAC should be.
There’s also more than a few dumb-ass choices, like the best-selling book in JUV008010 (Juvenile Fiction: Comics & GNs/Manga) being the not-even-slightly “manga” HILO by Judd Winick. These kinds of categorization problems pepper the entire database.
Additionally, only (apparently) the publishers can change BISACs, so even if I find errors year after year (god damn that BLOODY CROWN OF CONAN!!!), it’s very very difficult to convince folks that it matters enough to devote man-hours to fixing up, even if the folks at The NPD Group agree.
If you want to learn more about the theory and practice of BISAC codes, you can go and follow this link. (It’s a trap!)
The main thing to know is that while BISAC is a pretty good system for categorizing books because it is solely in the publisher’s hands it has some pretty extreme limitations when creating reports with it as the sole basis. There is not, however, any other way to generate this data without using those limitations, to the best of my knowledge.
Either way, prior to 2017 numbers, the exact methodology from my leakers is slightly different every year and sometimes we got weird spikes and discrepancies. For example, as far as I can tell, in 2014 and prior we were always getting every book that sold one copy anywhere, then in 2015, and slightly in 2016, we’re getting a lightly edited list that only listed in-print books from some (but not all!) publishers. I put an asterisk on 2015 and 2016 because it was missing several thousand data points… But those very strongly appeared to be datapoints that may not materially affect the actual bottom-line health of dollars and pieces the charts (you’ll see this year, I think). Either way, I really must once again urge you to treat every datapoint presented here as only part of the possible picture!
Anyway, we received a list this year that had the primary AND secondary BISACs on them, which helped a lot, but still didn’t capture everything. And, heckfire, I forgot to handcheck for some of the problematic ones before starting writing the report this year. This is mostly because I had about 20% of these that had to get stripped out – audiobooks and things without prices and print-on-demand coloring books and such. I think I’ve got a system set for next year to eliminate most of this work, but we’re still figuring our way through it all in 2018. Well, you’ll see….
OK, that’s the boilerplate and background out of the way, let’s start looking at the data.
Brian Hibbs has owned and operated Comix Experience in San Francisco since 1989, was a founding member of the Board of Directors of ComicsPRO, has sat on the Board of the Comic Book Legal Defense Fund, and has been an Eisner Award judge. Feel free to e-mail him with any comments. You can purchase two collections of the first Tilting at Windmills (originally serialized in Comics Retailer magazine) published by IDW Publishing, as well as find an archive of pre-CBR installments right here. Brian is also available to consult for your publishing or retailing program.


Nice analysis on the overall bookstore market, but it really loses its effectiveness and usefulness without the Top 750 actual numbers. Especially since you point out that the two markets are diverging. Really hard to compare the entire market for any publisher or book you don’t mention.
Just fantastic! So much information and data to look at. It’s fascinating from an agnostic standpoint to look at it all while trying to keep biases out as a fan.
The data itself is Bookscan’s bread-and-butter, Tim, so this was coming sooner or later. Happy we had as much as we did as long as we did.
Clarifying the Diamond part a bit: Diamond started reporting the Top 500 GNs each month in December 2017, so we had them for all of 2018. Next year we’ll be able to do a 500-to-500 comparison.
Just the 300s in 2018 were worth $73.56 million as noted; just that part was down 17%. But all of Diamond’s GN sales were only off 8%, and that reflects that half or so of Diamond’s GN sales are outside the Top 300, and that the long tail performed somewhat better.
Thanks again, Brian, for your hard work!
Quick point of note, but first – great work as always! Way to go Scholastic for marketing to and finding a kid’s market for comics! Now the point of note – your Western comics pie chart is just wrong. It might be last year’s chart? Anyway, as a primarily DC/Marvel/Image reader myself, I think the answer to your tanking sales in that area has a lot to do with stupid decisions in 2016-2017 from the Big Two and a lack of inventiveness at Image during that time. Rebirth, while invigorating to single issues sales, doesn’t make for a good trade branding for long rem book sales. And it’s all about a continuity that doesn’t make sense to the casual reader. Taking Batman for example – you go from action oriented stories in the New 52 with arc names like “Death of the Family” and “Superheavy” to Tom King’s esoteric thoughtful stories with arc titles like “I Am Gotham” and “I Am Suicide.” It’s just not a good transition. People want Batman doing awesome stuff in grippingly titled books, with covers that look awesome. New 52 had that. Or take Superman – the first 2 or 3 trades are all nonsense about combining continuity as much as anything else. Sure, that’s what casual readers want… And in the end, none of it has paid off yet, so I can see why readers would drop off. Marvel spent a lot of time rebooting, canceling, and retooling every character in the last 2 years. Finally they’re on track with some consistency again. Hopefully they keep their best stuff in print more, but they’re always looking to boost initial sales with scarcity and high prices. And Image went from an inventive period to the current one of many very generic action/sci-fi series that cancel quickly. The big name prolific writers are all chasing movie deals and can’t be bothered to write ongoing series.
I’m hopeful though that young readers will lead the way for the industry. It’s encouraging to see the attempts by DC and Marvel to start reaching this audience again. It’s what made comics the medium they are in the first place.
Within the Western comics data, I’d be interested in a long tail “traditional publisher” (i.e. Scholastic, PRH, AMM, etc) vs. “comics publisher” comparison. I added up the retail dollars of ones you showed (coming to ~$113M traditional vs. ~$105M comics) and there’s about $13M unaccounted for, and I’m wondering who’s really outselling who here. I’m especially curious about the historical data–again, just from what I was able to add up, comics published by traditional publishers have grown 13.5x since 2007, while comics publishers have only about doubled their bookstore sales in the same time period.
As in last year’s post, I think you sometimes write “Tokyo Ghost” (which is another comic, by Remender/Murphy) when you mean “Tokyo Ghoul” (the manga).
Thank you as always for gathering the data, analyzing it, and writing this thorough report!!! The Beat doesn’t pay you enough for what this yearly article contributes to fans wanting to know some of the sales numbers for their favorite series but not having the extra or enough money for a Bookscan or ICV2 acct!!!
I do not believe the Western Pie is incorrect: it is for the “entirety” of BookScan, not just the Top 750. That’s why DC is at 10% in the big chart — they have hundreds of series that sell small numbers of copies, but sum up to a significant volume when combined; but they are now only #8 within the Top 750 because their hits have collapsed significantly.
-B
Thanks for the clarification on the charts, Brian! I couldn’t figure out how you had the data broken down there. I was wondering how Andrews McMeel was #2 given the chart data above it.
Note #1: Image has made a strong effort in selling to libraries. (DC as well, with the new Ink and Zoom imprints.) You don’t see that data, of course, My local library (and employer) stocks most of the ongoing Image series (anything with 5+ volumes) and even ordered the “I Hate Fairyland” hardcover omnibus!
Note #2: While DC tried to recreate the magic of “Crisis” with the New 52, they forgot one thing: original graphic novels. Aside from “Year One” (a dismal failure with volumes that should come out annually, not every three years, even though the titles sell well), and a few Batman collections like Court of Owls, there was no backlist created during that five year run.
Rebirth has changed that, what with the DCU limited series (Mister Miracle, Batman: White Knight), original graphic novels from Zoom and Ink, plus the black label, and a half-hearted attempt to save Vertigo. We’ll see…
Note 3:
LIT017000 LITERARY CRITICISM / Comics & Graphic Novels
CGN006000 COMICS & GRAPHIC NOVELS / Literary
The first is analysis, the second is presentation. Non-fiction, Fiction. Enlightenment, Enjoyment.
Wait, how much did Snotgirl sell?
Also of note, Dog Man: Lord of the Fleas had an initial print run of 3 million copies and Dog Man: Brawl of the Wild had a print run of 5 million copies. I believe this does include sales in some other countries that Bookscan doesn’t track (UK? Australia?) but there are a lot of books selling through other markets. (As a comparison point, the New York Public Library has 237 copies of Dog Man: Lord of the Fleas.)
” Image has made a strong effort in selling to libraries” Sales to libraries don’t represent number of readers interested in the material. Libraries just represent buyers of a last resort for graphic novels. As such, the librarians determine what kinds of comics are made.
Let’s see what kinds of content libraries support.
bit.ly/ 2No9WVD
Jeez, and I thought superhero comics were too grimdark these days.
Why so serious, recommended books?
I’m not sure but critically acclaimed writer Jeremy Whitley provides some clues,”I went to school for English and creative writing and they were kind of anti-genre fiction at my school. So I had to write really serious stories about sad ”
bit.ly/ 2Vy6HKl
Jeremy’s writing has not progressed beyond his college years. He still sees fanciful fiction as a place to address very serious issues. He doesn’t need to because schools and academia, the main market for graphic novels, eat this kind of stuff up.
Most graphic novels sit on the shelf and are not “Constantly checked out” But certain ones wind up on “summer reading lists” and win awards that may convince a teacher to recommend them so there’s that.
I wish we new how many were actually sold to comic book readers.
Left off the k
@Darren K. Price:
What, from this column? Erm, LITERALLY 100%. BookScan is solely reporting sales to CONSUMERS, through mainstream bookstores and Amazon. It says that there, pretty damn clearly: “The bookstore market, however, buys their material semi-returnable, where they can send back some portion of titles that don’t sell (but not, usually, all unsold product). Because of this, sell-through is the data that is tracked and trended. ”
I told Heidi that moving all of the boilerplate to the end was going to confuse people!
-B
Also, for Matthew Murray: that’s a typo and cut-and-paste artifact, obviously. SNOTGIRL v1 is 7402 copies in 2018.
-B
Brian,
This analysis is always such a treat every year, thank you. You are doing the lords work. You da real MVP!
Something has gone drastically wrong at DC this year no doubt about that.
I’m trying to eyeball it, I’m focusing on “# of listed items” and “calculated retail value”. Their best year in retail value was 2016 when they also had their lowest ever number of listed items (1,214). That suggests to me a clarity of consideration set – consumers were not overwhelmed by choices, consumers had a limited number of key titles to choose from, all of which were ‘good’.
From 2016 to 2018 DC experienced a 34% drop in retail value – which corresponds to their largest ever number of listed items (3364) in 2018.
Basically, my eyeball read is consumers are overwhelmed by too many choices so they’re opting not to buy anything at all.
PS – Rebranding a bunch of old perennial sellers as ‘Black Label’ when no one (including both consumers and DC executives!) have any idea what ‘Black Label’ means, was also a pretty poor move.
PS2 – I’ve bought all the DC Super Hero Girls books, they are charming. And it’s a total mystery why the date with disaster one sells best. I can detect no differences other than James Gordon being featured on the cover. Is he really that much of a draw?
@TheMonstrousReprobate: that metric is, sadly, weak for 2016 (and 2015!) — that’s why those years are asterisked. If you read the boilerplate (I know it’s so long!) you’ll see that those years I got an “edited” version of the data that removed all of the nominative “out of print” books (I THINK!) from at least Marvel & DC…. but you know just because a publisher don’t have it doesn’t mean a bookseller might not have it in stock! short version is “# of titles” is especially poor in ’15 and ’16 and so your theory based on that off data is also likely off in that specific (But not in general: I think clarity of HOW a line of backlist is presented is as key as anything else!)
Thanks Brian!
Yes, product clarity is key. I”m still baffled as to why the New52 Batman (and All_Star) isn’t trade dressed as “Batman by Scott Snyder. And why the Rebirth Batman isn’t trade dressed as “Batman by Tom King”
@ Brian Hibbs
I absolutely should have paid more attention. However, I would like to know the number of actual monthly floppies that make it into a readers hands; not sold to retailers. That is an inaccurate number, based upon my unscientific observations at my local comic shops here in DFW. Bookstores don’t sell floppies, and bookstore sales were the focus of your well researched, data laden article. My apologies, and I look forward to your next installment.
So, what I would say, Darren is that stores have to be profitable to survive, and that depending on the specifics of your business that that requires somewhere between an 80 and 90% sell through to even slightly be possible.
Now, there are certainly some businesses that work on other models than straight sell-through, some play collectible games, for example, which can radically change the math (There are literally times where it is conceivable to buy extras and throw them in the recycling bin, and still come out profitable thanks to combinations of incentive discounts and ratio variants) but when you’re talking about the average comic, in the average store, most operations simply aren’t playing those kinds of games to any large degree, and will live and die on sell-through.
This implies, IMO, that sell-through on periodical sales reported to DCD are at least 80% of the total, because if they weren’t then stores would be failing left and right. And I think the number, overall, is in the 90s — far too many titles are “subs only” in far too many stores, and most accounts aren’t taking many chances in 2019.
There are a few books which will outperform based on things like store exclusives (which, while likely to be profitable for the smarter stores, will almost never “sell through” for anything but the largest) — but usually one can detect those spikes in the sales charts with just a little parsing. But like when it says “DOOMSDAY CLOCK #9 sold xx,xxx copies” — you can be confident that that number is overwhelmingly going to sell most of its copies before retailers take it off sale (Most issues have had 2nd prints, btw)
-B
Comments are closed.