
By Brian Hibbs
“There are three kinds of lies: Lies, Damned Lies, and Statistics”
Incredibly, this is the fifteenth annual report of something that is hard to exactly perceive and understand: the size and shape of the sales of graphic novels and trade paperbacks through the book store market, as seen through the prism of BookScan.
Some preamble:
 “Direct Market” stores (also known as “your Local Comics Shop”) buy much of their material for resale from Diamond Comics Distributors (though, not, by any means, all of the material your LCS has for sale – many DM stores are also buying from book-market wholesalers, or directly from publishers). While many DM stores have Point-of-Sales (POS) systems, because our market buys non-returnable what we track in our side of the industry is what sells-in to the store, not what sells-through to the eventual consumer. In a very real way, this means that the DM store owner is the actual customer of the publisher, as opposed to the end consumer.
The bookstore market, however, buys their material semi-returnable, where they can send back some portion of titles that don’t sell (but not, usually, all unsold product). Because of this, sell-through is the data that is tracked and trended. Bookstores that have POS systems are able to report their sales to BookScan, a subsidiary of The NPD Group (they bought it from Nielsen).
Each week, BookScan generates a series of reports detailing the specific sales to consumers through its client stores. I have several well trained spies who have, for several years, provided me with access to the BookScan reports at the end of each year.
This year, however, I am very excited to say that we are now getting the BookScan reports directly from The NPD Group, with no filter or middleman! May thanks to Kristen McLean for making this possible.
If you go over here, you can find a copy of the 2017 BookScan Top 750 year end report for the comics category.
For points of comparison, try these links to the earlier pieces:
2016: BookScan Report and My Analysis
2015: BookScan Report and My Analysis
2014: BookScan Report and My Analysis
2013: BookScan Report and My Analysis
2012: BookScan Report and My Analysis
2011: BookScan Report and My Analysis
2010: BookScan Report and My Analysis
2009: BookScan Report and My Analysis
2008: BookScan Report and My Analysis
2007: BookScan Report and My Analysis
2006: BookScan Report and My Analysis
2005: BookScan Report and My Analysis
2004: BookScan Report and My Analysis
2003: BookScan Report and My Analysis)
For the last eleven years, what I’ve been given is actual end-of-the-year totals, as opposed to the period from 2003-2005 where I only had the report of the final week of the year. The effective difference for a casual chart reader is probably very little, but it does change some of the value in the percentage changes year-to-year. Please bear it in mind when comparing this year’s report to the previous ones. And this year, of course, it all changes again – getting direct information beats a filter (BY FAR!)
Ultimately, we have three “eras”: 2003-2005 numbers that are “what is YTD sold, IF it made the chart in the last week of the year?”
2006-2016: the full “here’s everything that sold throughout the entire year”, but filtered through a leaker – almost certainly accurate, but absolutely missing some bits due to methodology changes and differences, even year-by-year. Important: in 2015 and 2016 I received lists that appeared to be lightly edited, potentially down to “books that are in print at the publisher level only” (obviously, there’s still stock out there on the shelves of stores and in warehouses that is not “in print” per se). Those two years are asterisked to reflect that!
2017-???: “Everything” sold in the calendar year, with no filter. (Though see further notes below!)
Just bear this all in mind if you compare the various “eras” against one another. These are not inherently apples-to-apples comparisons as a result! This year’s percentages are likely to be wacky compared to 2016, but moving forward there should be a much deeper consistency of data.
The biggest and most obvious difference when doing straight comparisons will be in the lower ends of the chart. This year, the “worst selling” book in the Top 750 is just a hair above 4000 copies. (about flat from the same 4k in 2016, and up from about 3600 copies in 2015 and 2900 copies in 2014) In ’03-‘05 there would be many items that didn’t have YTD sales in anything like that amount.
Also of major note is that starting in 2007, I have had the “full and entire” BookScan listing, down to books that have only one copy sold YTD. However, I’m not going to provide that entire list because that’s too much data, even for a data-junkie like myself. I’ve cut the list off at 750 items because that’s what we’ve historically reported. Still, I have the deeper data, and I’ll summarize it as we go along. As long as I continue to get that much data going forward, I should be able to tell you a few things about “The Long Tail”. In 2017, I possess data on over 35,000 items! We’ll talk more about this later in some depth, including the methodology of how these are generate.
This is important, however: this is not a list of every book that sold through every book store – the report is limited to those stores that report to BookScan. According to BookScan, more than 7500 venues report to them, but this still leaves many venues that don’t.
Neilsen claimed in 2013 that approximately 85% of retail, physical book sales are tracked through them, though this number appears very much in doubt as an actionable percentage for any specific individual book. A quick internet search can find any number of cases of authors saying that BookScan numbers show half or less of their royalty statements. There’s some really excellent discussion on why and by how much BookScan numbers might be off right here.
BookScan says “Barnes & Noble, Amazon, Costco, General Independents, Hastings, Target, BJ’s, K-Mart, Hudson Group, Meijers, Follett Books, Books-A-Million, CEO Read, Powells, Toys R Us, Shoprite, SuperValu, Sam’s Club and Walmart are among our many data providers.”
What sales do BookScan not track? Among others, this would include libraries, schools, specialty stores (like comic book stores!) and book clubs and fairs. BookScan does not track most sales at most independent bookstores. For many books those are very very important sales channels, and thus, BookScan under-reports by some potentially significant degree, and don’t, in any way, represent all physical book sales or even all “book stores” selling comic book material.
 There’s also a certain amount of miscategorization going on. As an example, for the last fifteen years the purely-prose novel Bloody Crown of Conan appears on my list, while other books (see; Dork Diaries in a few paragraphs) might appear one year, and disappear another. I do not know what the actual extent of miscategorization might be and how it would impact any of the general data analysis! There are simply too many potential data points to possibly connect them all together in the time I have to assemble this column.
I’ve done the best I can to try and root out any items “of significance” that should be on the chart that I’m given, but are not – for example, I have to have The Complete Persepolis and Maus manually pulled for me every year because of how BISAC codes work. Because this relies on me catching these titles to get them on to the list this means there’s almost certainly comics material missing that I didn’t catch. If you can think of a book I might have missed, please email me, and I’ll try to track down the sales for it, and update my listings for the future!
Either way, what I’m trying to get across to you is that this really is entirely unreliable data in terms of the absolute and total number of books sold, and is only able to give the broadest possible outline of what’s happening in book stores, based upon the data-set that I’m being given, which is in no way comprehensive. I still think that’s much much better than having no information, so I persevere in writing this each year. Also, now that I am getting directly from the NPD Group, I feel much more confident that I at least know where the potential problems generally are.
As always, I strongly encourage you to look at the BookScan numbers on your own and make your own conclusions – I’m trying to be balanced and fair, but, of course, I have huge bookshelves worth of biases I’m dragging around with me, and your analysis might be more correct than my own. Every year I write this and hope and pray that we’d get three or four competing analyses of the data dump, but that never happens. Maybe this year? (almost certainly not)
Again, I want to stress that I’m doing my primary analysis on the Top 750 items: the reason for this is that is all that I was able to get in the first four years of this analysis, and otherwise the percentage changes I’m discussing will be even more wrong than they would be otherwise. The Top 750 represents more than half of the total of the full list, and has consistently for years – in 2017 the Top 750 was roughly 10.3 million books sold; the bottom twenty-six thousand-ish represents just about 8.1 million books sold. While there are significant sales below the Top 750, the Top 750 probably represents the majority of items you’d be able to “easily” find on the shelf of a bookstore in America. I’d love to analyze the full “long tail” list, but I’m afraid that this might take these little essays to triple their current size, and keeping your attention just through this seems hard enough to me! Maybe if someone paid me by the word…
Finally, it is probably worth mentioning that although I’m analyzing both units and dollars, those dollars are what they would have been at full retail. BookScan does not report on the price that a book actually sold for, so the extrapolation of dollars that I made could be dramatically overstated. More than “could be”: it probably is… because Amazon sells so many books, often at crazy steep discounts.
This only counts physical books, and does not include any digital sale of any kind; it does however, include all physical books sold through Amazon.
One of the things I really never talk about is how I get this data each year. I certainly don’t have a BookScan account (they’re pretty expensive!), so I have historically dependent on leaks from industry sources. But this means that the methodology with which the data was generated may actually be very different from year to year. The thing is, since I don’t generate these, BookScan methodology is still largely a Black Box to me. For a guy who writes these reports for 15 (!) years, I still have only really a passing knowledge of how things work. I am learning, slowly, though!
Presumably, going forward with The NPD Group directly providing us data, we can be assured the methodology itself will not change. I have therefore marked the 2017 listing in bold on each chart to make clearer the demarcation between systems and methodology.
A Bunch of Information about BISAC codes and how this report is generated!
Here’s where we learn a little bit about the Book Industry Standards and Communications (or “BISAC”) codes. It turns out that the publishers assign them themselves, and that publishers are allowed to assign up to four different BISAC codes per item. For example: “Diary of a Wimpy Kid” is classified as “Juvenile Fiction: Humorous Stories”; “Juvenile Fiction: Comics & Graphic Novels: General”; and “Juvenile Fiction: Social Issues: General”. But the kicker is that BookScan reports will only spit out for the first BISAC listed for any given book. That is why “Diary of a Wimpy Kid” never ever shows on any of our reports, because the “comics” designation of the BISAC is listed second for that series! Conceptually I could also ask for “Juvenile Fiction: Humorous Stories” report, too – but that’s going to have thousands and thousands of prose-only, not-even-slightly-comics items on it, and working to cut those would quintuple the hours I spend on this (no thanks!) This is also why I have to manually ask for titles like “Maus” or “Persepolis” or “Understanding Comics” each and every year – not because they don’t contain the BISAC for comics (“CGN00xxxx” are the primary ones, for the record), but because that BISAC isn’t listed first!
Now, historically, this has really been opaque to me, to the point where I didn’t even really know what BISAC was what, but The NPD Group has been incredibly forthcoming in 2017, and I’m learning enough that I almost understand it. First and foremost, we’re now having the report generated using the codes for “Comics & Graphic Novels” (CGN), as well as the “comics” portions of “Juvenile” fiction (JUV) and nonfiction (JNF), and Young Adult Fiction (YAF) and non-fiction (YAN). Please note that the J and Y series of codes extend far past “comics”, but our search is for the narrower section. In addition to that, the NPD Group pulled records for three prominent authors that seldom showed up without intervention: Art Spiegelman, Marjane Satrapi, and Scott McCloud (As well as a small handful of books that I crosschecked against my own best sellers)
Follow this link for a list of BISAC codes that we have pulled, what their category is defined as, and what the top selling entry in that code was in 2017 (for grins, you can see that several of these categories don’t have any real “leader”). There are seventy-five “main” BISACs that we’re pulling in full, and another eleven that came with those specific author calls.
Right from the top, you can see there are some strange bits – for example, there is a CGN000 as well as a CGN 000000, both listed as “general” – most (but not all) “000” books are Barnes & Noble exclusive covers. CGN001000 is “anthologies”, but mostly appears to be listing collections of cartoon strips (rather than “a book with a common theme that has different authors” which is how I would define that), and CGN002000 is not defined at all (and I can’t see the similarities between the four books with that primary BISAC), and so on, and so forth.
Again, the publishers are the ones who assign the BISACs, and they can assign up to four per book. But reports can only generate (for now) from what the first BISAC code is listed – The NPD Group tells me they’re working on fixing that, but it’s a limitation of the current tools. That’s why they pulled by Author for Art Spiegelman – and look at how MAUS breaks down: the first individual volume has a primary BISAC of HIS022000 (“History: Jewish”), while the complete hardcover is BIO006000 (“Biography: Historical”). But the box set of the two paperbacks is BIO000000 (“Biography: General”), and METAMAUS (the book, with supporting documentation) for some reason is categorized as LIT017000 (“Literary: Comics & Graphic Novels”) which I’m not at all certain how that is different from CGN006000 (“Comics & Graphic Novels: Literary”) – but my point is that you have essentially one book that the publisher itself doesn’t really know what the “primary” BISAC should be.
There’s also more than a few dumb-ass choices, like the best-selling book in JUV008010 (Juvenile Fiction: Comics & GNs/Manga) being the not-even-slightly “manga” HILO by Judd Winick. These kinds of categorization problems pepper the entire database.
Additionally, only (apparently) the publishers can change BISACs, so even if I find errors year after year (god damn that BLOODY CROWN OF CONAN!!!), it’s very very difficult to convince folks that it matters enough to devote man-hours to fixing up, even if the folks at The NPD Group agree.
If you want to learn more about the theory and practice of BISAC codes, you can go and follow this link. (It’s a trap!)
The main thing to know is that while BISAC is a pretty good system for categorizing books because it is solely in the publisher’s hands it has some pretty extreme limitations when creating reports with it as the sole basis. There is not, however, any other way to generate this data without using those limitations, to the best of my knowledge.
Either way, prior to 2017 numbers, the exact methodology from my leakers is slightly different every year and sometimes we got weird spikes and discrepancies. For example, as far as I can tell, in 2014 and prior we were always getting every book that sold one copy anywhere, then in 2015, and slightly in 2016, we’re getting a lightly edited list that only listed in-print books from some (but not all!) publishers. I put an asterisk on 2015 and 2016 because it was missing several thousand data points… But those very strongly appeared to be datapoints that may not materially affect the actual bottom-line health of dollars and pieces the charts (you’ll see this year, I think). Either way, I really must once again urge you to treat every datapoint presented here as only part of the possible picture!
*********
OK, that’s the boilerplate and background out of the way, let’s start looking at the data.
2017 Overview
As always, I continue to cut out anything that clearly wasn’t a “comic” (though such definitions are sometimes difficult to make). For instance, the #10 book of the year – The “Dork Diaries” volumes (and more on that below) are not really a “comic” – they have words, they have pictures, but they don’t work together in the way I’d think we’d commonly agree is “comics”. However, it’s just close enough that I decided to keep it. Much less controversial (I’d imagine) is my decision to remove prose-driven books like DK Publishing’s “Marvel Encyclopedia” (21,561 copies sold in 2017), which, while nominally about comics or comics culture, is factually an encyclopedic prose book with pictures. Or “Wonder Woman: Warbringer” (43,623 sold in 2017) which is a straight-up prose novel that happens to feature a comics character, or “DC Super Heroes: My First Book of Girl Power” (30,138 copies sold in 2017) where the Amazon “Look Inside” clearly shows is an illustrated reader for 2nd graders. There is clearly an enormous market for this kind of material – in fact, in many cases a larger market than for the actual comics themselves – it just isn’t the “comics” market, as I would define it.
In all, I removed 35 items from the Top 750 that didn’t match my personal definition of “comics”, to make room for 35 more items that I think are comics. However, if there was a legitimate question about it, like our #10 book, I erred on the side of keeping it.
On the other hand, I’m also not actively chasing down other books like “Dork Diaries” (For example, “Diary of a Wimpy Kid”) or every volume in that series. This may possibly make me a hypocrite in how I handle things, but it’s also not wanting to add more steps for very little gain. Berate me in the comments section!
Here’s the big picture for the Top 750 in 2017:
| Year | Total Unit | Growth | Total Dollars | Growth |
| 2003 | 5,495,584 | ——- | $66,729,053 | ——– |
| 2004 | 6,071,123 | 10.5% | $67,783,487 | 1.6% |
| 2005 | 7,007,345 | 15.4% | $75,459,669 | 11.3% |
| 2006 | 8,395,195 | 19.8% | $90,411,902 | 19.8% |
| 2007 | 8,584,317 | 2.3% | $95,174,425 | 5.3% |
| 2008 | 8,334,276 | -2.9% | $101,361,173 | 6.5% |
| 2009 | 7,634,453 | -8.4% | $93,216,014 | -8.0% |
| 2010 | 6,414,336 | -15.9% | $85,266,166 | -8.5% |
| 2011 | 5,696,163 | -11.2% | $79,961,951 | -6.2% |
| 2012 | 5,438,329 | -4.53% | $89,918,354 | 12.45% |
| 2013 | 5,654,351 | 3.97% | $96,062,709 | 6.83% |
| 2014 | 6,659,031 | 17.77% | $112,768,709 | 17.39% |
| 2015* | 8,762,983 | 31.60% | $141,226,518 | 25.24% |
| 2016* | 9,967,907 | 13.75% | $159,510,075 | 12.95% |
| 2017 | 10,310,682 | 3.44% | $154,026,517 | -3.44% |
So, that’s a decidedly mixed result for 2017: while that’s the highest number of copies ever tracked through the Top 750, it’s also nearly 3.5% down in dollar sales. It’s also really weird that the percentage the pieces were up and the percentage the dollars were down were almost exactly the same amount.
I want to point out that while I asterisk 2015-2016 in terms of the sheer number of data points that I am getting was probably edited, it appears to be that the top 750 is fairly rock solid.
 The trend for print books in general (not just looking at comics) through BookScan appears to be a general growth of 1.9% in 2017 — which continues the four-year trend of comics-material being stronger than the general curve.
(For what it is worth, overall book sales through Diamond in the Direct Market appear to be down by about 9%, so the book market performed significantly better. Diamond only directly reports the Top 300 best-sellers each month, and those Top 300s in the DM sum up to $88.12m. Deep deep into the micro, my own individual sales in the book category were down about 1.8% in dollars at my main store in 2017.)
It might interest you in how many entries from which category are in the entire database, so here’s a fun breakdown:
As I noted, I primarily write about the top 750 because a) that’s all the data I was initially leaked back in 2003, b) it’s a “manageable” chunk of data, and c) “as above, so below” – the top 750 represents about half of sales. However, since 2007, I’ve received the “entire” database, which now gives us a solid ten years of data to track. Sometimes we refer to this as “the Long Tail”.
Here’s what the sales of all comics sales BookScan tracks in this category looks like – but, seriously, let me remind you that the dataset changes enough each year this is a kind of meaningless set of comparisons! Even putting aside “the asterisk years”, prior to 2013, this didn’t include Walmart, for just one example.
| Year | # of listed items | Percent Change | Total Unit Sold | Percent Change | Total Dollars Sold | Percent Change | Av. Sale per title | Av $ per title |
| 2007 | 13,181 | —– | 15,386,549 | —– | $183,066,142 | —– | 1167 | $13,888.64 |
| 2008 | 17,571 | 24.98% | 15,541,769 | 1.00% | $199,033,741 | 8.02% | 885 | $11,327.40 |
| 2009 | 19,692 | 12.07% | 14,095,145 | -9.31% | $189,033,736 | -5.02% | 716 | $9,599.52 |
| 2010 | 21,993 | 11.68% | 12,130,232 | -13.94% | $172,435,244 | -8.78% | 552 | $7,840.32 |
| 2011 | 23,945 | 8.88% | 11,692,058 | -3.61% | $175,634,490 | 1.86% | 488 | $7,334.91 |
| 2012 | 23,365 | -2.42% | 9,562,236 | -18.22% | $164,415,366 | -6.39% | 409 | $7,036.82 |
| 2013 | 24,492 | 4.82% | 10,153,628 | 6.18% | $176,419,370 | 7.30% | 415 | $7,325.63 |
| 2014 | 26,976 | 10.14% | 11,820,324 | 16.41% | $207,598,355 | 17.67% | 438 | $7,695.56 |
| 2015* | 22,431 | -16.85% | 15,269,550 | 29.18% | $259,807,532 | 25.15% | 681 | $11,582.52 |
| 2016* | 21,295 | -5.06% | 17,302,891 | 13.32% | $293,583,180 | 13.00% | 813 | $13,786.48 |
| 2017 | 35,338 | 65.95% | 18,385,086 | 6.25% | $302,300,435 | 2.97% | 520 | $8,554.54 |
There were just over 6000 items that disappeared between BookScan 2015 and 2016 (see above for how I get this data) – and now that I’m getting the data directly from The NPD Group starting in 2017, it all came rushing back restored (and then some!) But you can see that most of the “missing” material appears to be low-selling titles that only trickle as this is the first year in four that the long tail doesn’t show double-digit growth.
Let’s take a look at the Top 20 best-selling items on the 2017 chart; it looks like this (I apologize for the truncated titles, it is baked in):
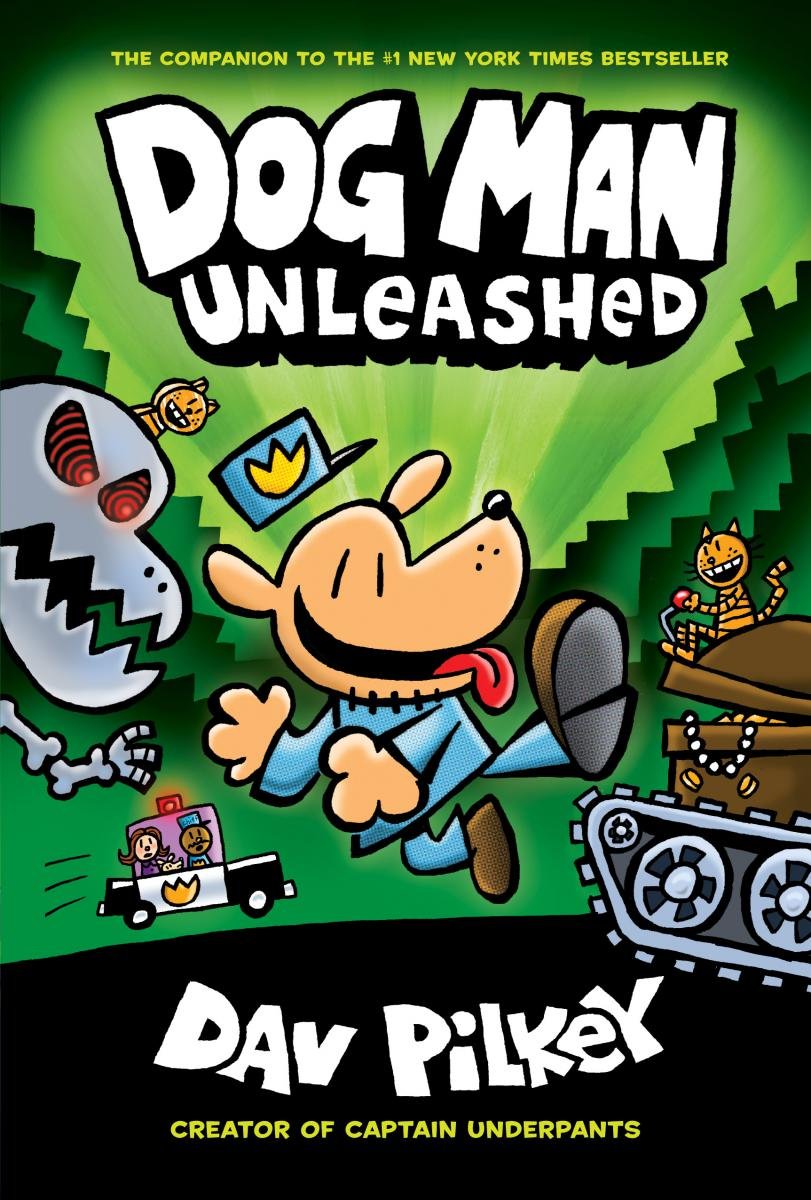
| 419,318 | DOG MAN UNLEASHED |
| 339,703 | DOG MAN: A TALE OF TWO KITTIES |
| 311,275 | DOG MAN |
| 179,859 | GHOSTS |
| 177,989 | DRAMA |
| 159,860 | SMILE |
| 147,889 | SISTERS |
| 115,735 | KRISTY’S GREAT IDEA: FULL-COLO |
| 99,464 | THE MISADVENTURES OF MAX CRUMB |
| 97,078 | DORK DIARIES 1: TALES FROM A N |
| 93,822 | REAL FRIENDS |
| 91,602 | BIG NATE: WHAT’S A LITTLE NOOG |
| 81,388 | DANTDM: TRAYAURUS AND THE ENCH |
| 79,579 | THE TRUTH ABOUT STACEY: FULL-C |
| 79,491 | DORK DIARIES 10: TALES FROM A |
| 76,571 | THE BABY-SITTERS CLUB: DAWN AN |
| 75,145 | CLAUDIA AND MEAN JANINE |
| 73,734 | INVISIBLE EMMIE |
| 68,800 | MARY ANNE SAVES THE DAY: FULL- |
| 66,876 | AWKWARD |
 Clearly, the first thing you can’t help but notice is that all twenty of the Top Twenty are books aimed at younger readers – it was just eighteen last year, and fifteen the year before You have to hit #23 before you reach a book aimed at adults (“Persepolis”), #29 before you hit a book aimed at adults that could be considered DM-driven (“Saga” v7), and a staggering #36 before you reach something that that is a superhero comic (“Batman: The Killing Joke”). Clearly, the times, they are a changin’. Further: the conventional wisdom is that the BookScan reporting is only the tip of the iceberg because the real market for kids books is going to be through things like a) Scholastic Book Fairs that run directly through elementary schools all over America, as well as b) libraries, both school and municipal, none of which report to BookScan. That’s all largely invisible, though, and something we can but speculate on the actual size and shape. (Big; and Wide)
The #1 book, “Dog Man: Unleashed” by Dav Pilkey, the second book in the “Dog Man” series, which was released at the (heh) tail end of 2016. Pilkey has always been a very successful cartoonist in the BookScan charts, but “Dog Man” is leaps and bounds ahead of his previous work, with this volume hitting nearly 420k in sales. That’s crazy impressive, as is the notion that he’s released four “Dog Man” books since just August 2016.
Pilkey also has books #2 and #3 with “Dog Man: A Tale of Two Kitties” (the third entry in the series, at 340k sold) and “Dog Man” (the first volume, at 313k sold). This is even more impressive when you jump down the list to #37 and find the boxed set of those three volumes selling another 36k, and you go a little further down and find ~25k each of “Super Diaper Baby” and “The Adventures of Ook and Gluck”. Pilkey’s successful “Captain Underpants” books are not listed here because they’re illustrated prose, and not comics. Just within the GN lists, Pilkey moves 1.2m copies of his books for an unbelievable $12.5 million in sales – that’s something like 4% of all of the dollars of all 35,338 GNs coming from the pen of one cartoonist.
Speaking of popular cartoonists, the next five spots sweep to Raina Telegemeier, as she takes #4 (“Ghosts”), #5 (“Drama”), #6 (“Smile”), #7 (“Sisters”), and #8 (“Baby Sitter’s Club: Kristy’s Great Idea”). She’s also #15 (“The Truth About Stacey”), #17 (“Claudia and Mean Janine”), and #19 (“Mary Anne Saves the Day”), and bit further down at #74 there are another 24k of the box set for “Smile” and “Sisters”.
It’s a little crazy that all eight of her books live in the Top 20. It’s hard to think of another comics author that has a straight successful run like that. It’s over a million books sold in 2017 (without a single new release) for $11.6 million sold.
Positions #9 and #10 belong to Rachel Renee Russell with “The Misadventures of Max Crumbly” v2 (not “Max Crumb” as the BookScan listing gets truncated – he’s a completely different artist!) and the first volume of “Dork Diaries”. Russell’s work is only kind of vaguely “comics” to my eyes, but it is also not not-comics! She also scores with v1 of “Max Crumbly” at #24, and more “Dork Diaries” with v10 at #15 and v9 at #30 …. But that’s all that is listed for this series. We don’t know exactly how v 2-8 or 11 do, because they are apparently not BISACed as “comics”-first! One presumes that many of those also sold in the 60-75k range as well in 2017, but it’s more books than I’m really that comfortable with trying to chase down since they’re only kinda-sorta comics. Honestly, I should probably just remove it from the conversation at all, but that feels like ignoring a vital part of at least a comics-like infrastructure.
Plus, if I chase all of those down, then I really also should chase down Jay Kinney’s very similar semi-comics series, “Diary of a Wimpy Kid”, of which there are also eleven volumes – and we’re told more than 180 million copies in print. It’s a conundrum. Just what is “comics” when it comes to the balance of comics-to-prose? I remain torn, and therefore I remain inconsistent – I just dread dipping my toes into the general fiction lists for kids and YA books, because that could add another week or two to an already too-long process.
At #11 we get another Big Name YA author in Shannon Hale, doing her first GN with artist LeUyen Pham, “Real Friends”, selling nearly 94k copies, while #12 is Lincoln Peirce’s “Big Nate: What’s a Little Noogie Between Friends?” with almost 92k sold. Peirce also places “Big Nate” volumes at #25, #31, #108, #127, #135, #152, #157, #177, #188, #198, #219, #258, #295, #307, #343, and #368. People seem to like “Big Nate”!
At #13 is something that I’m almost entirely ignorant about, a comic apparently from someone famous for playing Minecraft on YouTube, ““DanTDM: Trayaurus and the Enchanted Crystal”. How that gets you to sell almost 82k books, I’m not sure I understand fully, but that’s OK, I’m not the only person who lives in this world. Despite the providence, it is clearly and explicitly comics.
At #16 we return to the “Baby Sitter Club” franchise, but this is the first volume that is not by Raina. This is Gale Galligan, and the kids seem OK with the change in creators as “Dawn and the Impossible Three” racks up nearly 77k sold. #18 is “Invisible Emmie” by Terri Libenson (74k), and #20 is Svetlana Chmakova’s “Awkward” (67k)
For what it is worth, only five of the Top 20 are by white men, and not a single one of them was created within or “for” the traditional Direct Market comics system. This is a pretty dramatic change from even a few years ago on both counts.
(In terms of the DM, the highest placing that any of these twenty books appear to have placed through Diamond in 2017 is “Ghosts” at #809 for the year…. Though, in all fairness, because of discount and shipping terms you’d have to be a real fool to buy most of these books from Diamond rather than practically anyone else. I am assuming [perhaps foolishly] that most of my fellows are NOT sourcing these from Diamond – for example, “Ghosts” was my #27 best-seller for the year at my main store, and none of those copies were purchased from DCD.)
 “Kids” comics is absolutely the hottest demographic of the moment, reminding me in any ways of pre-Direct Market times when comics were on the newsstands and the audience was assumed to turn over every several years. One difference between then and now is that when those kids turn over, Pilkey and Telegemeier and all of the rest of these authors will still be waiting for the next incoming group of kids because these are permanent formats, not transitory ones like periodicals were.
In addition to 20/20 of the Top 20 being kids books, it is also 27/30, 34/40, 39/50 and a massive 64/100 that are kids-oriented. It’s not until you get done past spot #100 before things start to swing back to comics intended for adults.
What happens if you sort the chart by dollars grossed instead of pieces sold? Things change less than you might think:
| $4,188,986.82 | DOG MAN UNLEASHED |
| $3,393,632.97 | DOG MAN: A TALE OF TWO KITTIES |
| $3,109,637.25 | DOG MAN |
| $1,976,650.41 | GHOSTS |
| $1,956,099.11 | DRAMA |
| $1,930,863.75 | MARCH (TRILOGY SLIPCASE SET) |
| $1,756,861.40 | SMILE |
| $1,626,946.12 | DANTDM: TRAYAURUS AND THE ENCH |
| $1,625,300.11 | SISTERS |
| $1,445,127.74 | AKIRA 35TH ANNIVERSARY BOX SET |
| $1,391,501.36 | THE MISADVENTURES OF MAX CRUMB |
| $1,358,121.22 | DORK DIARIES 1: TALES FROM A N |
| $1,353,044.84 | THE BABY-SITTERS CLUB GRAPHIX |
| $1,271,927.65 | KRISTY’S GREAT IDEA: FULL-COLO |
| $1,222,454.31 | MY FAVORITE THING IS MONSTERS |
| $ 1,218,747.78 | REAL FRIENDS |
| $1,122,532.88 | THE WALKING DEAD COMPENDIUM VO |
| $1,112,079.09 | DORK DIARIES 10: TALES FROM A |
| $1,096,252.08 | AMULET BOX SET: BOOKS 1-7 |
| $1,074,933.99 | DOG MAN: THE EPIC COLLECTION: |
A lot of box sets start moving up the list, but we do have appearances by several not-kids works – specifically Rep John Lewis’ “March” (boxed set) comes in at #6, and a $200 (!) edition of “Akira” appears at #10. Fantagraphics makes a rare appearance with the sublime “My Favorite Thing is Monsters” at #15, and, oh look! there’s “The Walking Dead” down at #17, having lost almost three-quarters of its dollar volume in the last year (more on that later)
In 2017, there are twenty books (coincidentally the list above) that generated more than a million dollars in gross sales – this is down a bit from twenty-three books in 2016.
How about if we sort it by author? Here are people with more than 10 books placing in the Top 750:
| ISAYAMA HAJIME | 24 |
| PEIRCE LINCOLN | 17 |
| ISHIDA SUI | 16 |
| KIRKMAN ROBERT | 16 |
| VAUGHAN BRIAN K. | 13 |
| ARAKI HIROHIKO | 10 |
| KIBUISHI KAZU | 10 |
| SNYDER SCOTT | 10 |
This is shrinking list for 2017 – only 8 names now, compared to 10 the year before, and we’re talking about 1.6 million copies now on 116 of the Top 750. But here’s where you start to see just how badly the bottom has fallen out of “The Walking Dead” as Robert Kirkman placed a staggering forty books in the Top 750 in 2016. Now he’s down to just 16. Yikes.
Let’s add some dollar amounts, and widen it to the entire 33k list, with these being all of the authors selling over $1m combined in books according to BookScan. That looks like this:
| PILKEY DAV | $12,473,032.26 |
| TELGEMEIER RAINA | $9,640,046.81 |
| KIRKMAN ROBERT | $7,782,164.81 |
| RUSSELL RACHEL REN | $6,128,321.53 |
| VAUGHAN BRIAN K. | $4,263,973.08 |
| PEIRCE LINCOLN | $3,854,861.56 |
| LEWIS JOHN | $3,758,518.00 |
| KIBUISHI KAZU | $3,600,365.04 |
| ISHIDA SUI | $3,487,487.51 |
| MOORE ALAN | $2,926,106.54 |
| JOHNS GEOFF | $2,848,375.36 |
| ISAYAMA HAJIME | $2,835,506.03 |
| HIMEKAWA AKIRA | $2,813,826.66 |
| KUSAKA HIDENORI | $2,609,804.84 |
| SNYDER SCOTT | $2,561,484.56 |
| GAIMAN NEIL | $2,348,200.81 |
| YANG GENE LUEN | $2,173,307.74 |
| BENDIS BRIAN MICHAEL | $2,023,850.29 |
| KISHIMOTO MASASHI | $2,019,648.95 |
| ODA EIICHIRO | $2,007,041.74 |
| TORIYAMA AKIRA | $2,005,619.82 |
| GILLEN KIERON | $1,903,718.41 |
| OTOMO KATSUHIRO | $1,830,704.87 |
| SPIEGELMAN ART | $1,824,282.84 |
| SATRAPI MARJANE | $1,806,897.10 |
| KING TOM | $1,770,004.29 |
| MILLER FRANK | $1,766,494.54 |
| HORIKOSHI KOHEI | $1,760,337.90 |
| MASHIMA HIRO | $1,642,954.64 |
| AARON JASON | $1,633,896.36 |
| DANTDM | $1,626,946.12 |
| OHBA TSUGUMI | $1,593,829.64 |
| MILLAR MARK | $1,537,664.19 |
| MIURA KENTARO | $1,534,563.02 |
| ENNIS GARTH | $1,489,819.90 |
| JAMIESON VICTORIA | $1,468,903.29 |
| ARAKI HIROHIKO | $1,401,794.89 |
| MORRISON GRANT | $1,368,636.11 |
| MARTIN ANN M. | $1,354,103.87 |
| CHMAKOVA SVETLANA | $1,353,975.00 |
| HOLM JENNIFER L. | $1,336,025.62 |
| TOBIN PAUL | $1,335,197.89 |
| HALE SHANNON | $1,330,538.53 |
| ITO JUNJI | $1,320,569.94 |
| LEMIRE JEFF | $1,237,076.23 |
| TOBOSO YANA | $1,228,134.20 |
| FERRIS EMIL | $1,222,489.30 |
| HALE NATHAN | $1,211,376.48 |
| O’MALLEY BRYAN LEE | $1,177,564.44 |
| COATES TA-NEHISI | $1,164,788.45 |
| TAKAYA NATSUKI | $1,156,821.32 |
| ONE | $1,137,241.62 |
| TAYLOR TOM | $1,115,534.23 |
| SIMPSON DANA | $1,115,416.27 |
| SMITH JEFF | $1,108,367.15 |
| RUCKA GREG | $1,057,684.14 |
| WAID MARK | $1,038,522.79 |
| HICKMAN JONATHAN | $1,010,572.97 |
This gives us a big 58 authors, who sell a combined $137m worth of books. That is not very under one-half of all comics dollars being spent on BookScan (all 35k+ entries!) from the pens of just a small number of people.
What you can take from this is that only a small number of creators drive the majority of the business in comics (and books in general, I think); and conversely, this probably means that the numerical majority comics aren’t actually significantly profitable any given year.
Let’s switch our attention to looking how publishers performed.
As a way to make the publisher breakdowns more readable, I split the chart into “eastern” (Manga) and “western” comics, because I think there are a few clear market distinctions between those categories. So, without further ado:
2017 Manga
No real clear dominance of series in Manga in 2017 – sales are up for the second year in a row, but over a wider variety of titles than historically typical.
Here’s a year-to-year comparison chart for the Top 750:
| Year | # of placing titles | Unit sales | Dollar sales |
| 2003 | 447 | 3,361,966 | $34,368,409 |
| 2004 | 518 | 4,603,558 | $45,069,684 |
| 2005 | 594 | 5,691,425 | $53,922,514 |
| 2006 | 575 | 6,705,624 | $61,097,050 |
| 2007 | 575 | 6,837,355 | $61,927,238 |
| 2008 | 514 | 5,624,101 | $53,033,579 |
| 2009 | 451 | 4,414,705 | $41,068,604 |
| 2010 | 436 | 3,117,019 | $30,212,561 |
| 2011 | 392 | 2,627,570 | $27,017,081 |
| 2012 | 367 | 1,908,186 | $21,324,368 |
| 2013 | 315 | 1,665,487 | $21,256,777 |
| 2014 | 271 | 1,748,185 | $22,601,720 |
| 2015* | 279 | 2,033,534 | $26,191,474 |
| 2016* | 311 | 2,629,366 | $35,915,488 |
| 2017 | 284 | 2,427,380 | $35,433,489 |
It is a down year for Manga in the Top 750, as all three indicators drop, including the third lowest Number of Placing Titles in the time we’ve tracked these charts. To an extent, this is partly because of the explosion in strong selling kids material, but there’s also a weakening of Manga at the top – the single best-selling Manga (the first volume of “Tokyo Ghoul”) sold a bit over 34k, which is way down from the previous year where it sold 54k.
Because manga tends to be long, ongoing series, instead of relatively self-contained graphic novels, there are generally fewer properties on the manga list than you will find on the Western lists. This year I count just eighty-four distinct series among these placing books in 2017 – It had reached a height of ninety-six series in 2016, up from eighty-nine series in 2015, so this is also the least “diverse” list of manga (in one way of considering that) in several years.
Manga, as a category, has a long tail:
| Year | # of listed items | Percent Change | Total Unit Sold | Percent Change | Total $ Sold | Percent Change | Av. Sale per title | Av $ per title |
| 2007 | 6231 | —— | 11,323,487 | —— | $108,770,537 | —– | 1817 | $17,456.35 |
| 2008 | 7842 | 20.54% | 10,173,091 | -11.31% | $100,800,283 | -7.91% | 1297 | $12,853.90 |
| 2009 | 8756 | 11.66% | 8,148,490 | -19.90% | $81,770,442 | -18.78% | 931 | $9,338.79 |
| 2010 | 8764 | —— | 6,239,725 | -23.42% | $67,092,668 | -17.95% | 712 | $7,655.48 |
| 2011 | 8991 | 2.59% | 5,690,327 | -8.80% | $62,810,728 | -6.38% | 633 | $6,985.96 |
| 2012 | 6332 | -29.57% | 3,510,057 | -38.32% | $40,943,613 | -34.81% | 554 | $6,466.14 |
| 2013 | 7024 | 10.93% | 3,516,208 | 0.01% | $44,651,823 | 9.06% | 501 | $6,357.04 |
| 2014 | 7452 | 6.09% | 3,914,385 | 11.32% | $51,557,925 | 15.47% | 525 | $6,918.67 |
| 2015* | 4412 | -40.79% | 4,580,434 | 17.02% | $62,253,624 | 20.75% | 1038 | $14,110.07 |
| 2016* | 4968 | 12.60% | 5,821,892 | 27.10% | $81,314,479 | 30.62% | 1172 | $16,367.65 |
| 2017 | 10,248 | 106.8% | 5,865,412 | 0.75% | $85,581,224 | 5.25% | 572 | $8,351.02 |
As we can see, the data from ’15 and ’16 now seems really suspicious in this presentation – while the dollar amounts seem entirely in line, there’s a clear and massive amount of “missing” material… and it appears to be on the lower end of the charts (the “onesie, twosie” books) because now that it is restored (doubling the title count from last year!) unit sales don’t even raise one whole percentage point. And, in fact, it is the first year in the last four that manga didn’t have a double digit increase. So, ew to that.
The problem for Manga as a category is the lack of a new break out hit (like “Naruto” used to be) – the #1 book, “Tokyo Ghost”, barely scrapes 34k; about a 40% drop from the previous year – while the overall growth looks like it has essentially gone flat.
When you start breaking down the manga portion of the chart by publisher, there’s really not any contest at all: there’s a hundred-pound gorilla, and a bunch of smaller houses struggling in their shadow. This chart represents all 10,155 books that are “manga” in BookScan in 2017.
#1 MANGA – VIZ
Within the Top 750, the picture is about the same: The #1 publisher is Viz who takes 154 of the 282 manga spots in the Top 750, once again keeping them as the overwhelmingly dominant manga player with more than half of the placing titles. Within the Top 750, Viz charted about 1,564,440 pieces, for almost $22 million – this is actually a strong growth for Viz, up roughly 5% from the previous year in pieces placed.
Viz continues to control the manga charts as they have for a very long time now, and it is really difficult envisioning anyone really challenging them substantially for that role because they are about three times larger than their nearest competitor.
Viz’s best-selling title is “Tokyo Ghoul”: v1 moves just over 34k copies, and is the best-selling manga comic of the year. That is down significantly from 54k for v1 in 2016. The series charts fourteen volumes, with four spin-off books, within the Top 750 for a combined total of 272k copies sold – last year ten volumes sold 275k.
“My Hero Academia” is the second best-selling title for Viz in 2017. V1 sells 33k. While it has nine volumes released, just seven of them show up in the Top 750 – v5 and v6 must have irregular BISAC codes because they do not appear even on my “Long Tail” chart. Combined, the series reports 154k copies sold.
Viz’s third and fourth best-sellers are from “The Legend of Zelda”. “Twilight Princess v1” racks up 31k, while “Ocarina of Time” just makes 27k. Eight total “Zelda” books are on the Top 750, for a total of 158k sold.
At #5 for Viz is “One Punch Man” (V1 sells 27k) has twelve volumes in the Top 750 for a total of about 179k sold; in 2016 this was 9 volumes selling 232k copies combined.
Coming in at #9 for Viz is the first “Death Note” in the black edition (two-in-one editions, at a larger trim size) – that’s just over 24k, which seems very low to my eye with the Netflix adaptation. There are three other Black volumes in the Top 750, but v2 dives down to half of v1 at under 12k. The regular edition of “Death Note” also has two volumes place (v1 sells just 4748), and there’s also the complete edition that does about 14k. All together it’s a bit under 74k for the franchise in the Top 750.
“Pokemon” also does fairly well – twelve entries sell about 110k copies total, but that’s down from 126k in 2016, and one time powerhouse “Naruto” has fallen way down – v1 doesn’t crack 10k, and the “Boruto” relaunch seems pretty weak at just over 23k. It wasn’t very long at all ago that “Naruto” used to sell six figures of a new edition.
Let’s take a look at the “long tail” of Viz?
| Year | # of listed items | Percent Change | Total Unit Sold | Percent Change | Total $ Sold | Percent Change | Av. Sale per title | Av $ per title |
| 2007 | 2018 | —— | 6,249,324 | —— | $55,123,347 | —– | 3097 | $27,315.83 |
| 2008 | 2447 | 21.26% | 5,536,286 | -11.41% | $50,311,791 | -8.97% | 2263 | $20,560.60 |
| 2009 | 2793 | 14.14% | 4,819,407 | -12.95% | $44,310,790 | -11.93% | 1726 | $15,864.94 |
| 2010 | 3088 | 10.56% | 3,576,671 | -25.79% | $35,041,305 | -20.92% | 1158 | $11,347.57 |
| 2011 | 3393 | 9.88% | 3,276,297 | -8.40% | $32,766,960 | -6.49% | 966 | $9,657.22 |
| 2012 | 3518 | 3.68% | 2,099,560 | -35.92% | $22,433,721 | -31.54% | 597 | $6,376.84 |
| 2013 | 3636 | 3.35% | 1,853,211 | -11.73% | $21,586,923 | -3.77% | 510 | $5,937.00 |
| 2014 | 3765 | 3.55% | 1,855,161 | 0.11% | $22,732,074 | 5.30% | 493 | $6,037.74 |
| 2015* | 2264 | -39.87% | 2,150,656 | 15.93% | $28,134,971 | 23.77% | 950 | $12,427.11 |
| 2016* | 2405 | 6.23% | 2,811,978 | 30.75% | $38,854,681 | 38.10% | 1169 | $16,155.79 |
| 2017 | 4443 | 84.74% | 2,958,351 | 5.21% | $41,594,729 | 7.80% | 666 | $9,361.86 |
Viz is outpacing the general Manga market, but the resurgence boom seems to be over. Viz has no books that do over 50k in sales in 2017, another nineteen that do over 20k, and forty more that do over 10k – their top has crashed, but their midlist has fattened, so not the worst place to ever be.
#2 MANGA – KODANSHA
In second place among manga publishers, we have Kodansha Comics, which places 52 titles within the top 750, with 348k in sales, and $5.4 million dollars (compared to 469k and $5.6m in 2016 and 493k and $6.1m in 2015). Kodansha’s performance in the Top 750 is on a steady decline in the last few years.
Kodansha’s licenses formerly were both the original backbone of Tokyopop, as well as being the majority of Del Rey Manga. Kodansha pulled Tpop’s license in March of ’09 and Del Rey in October of ’10. You may want to look at those publisher’s listings below to get a better historical overview.
Kodansha’s current best-seller is “Attack on Titan”, where v 1 drops to under 19k in 2017 – this volume did about 26k in 2016 and 34k in 2015. “Attack” does place 23 volumes, and a spinoff into the Top 750, but it’s a weakening brand, pulling in not quite 170k across all of those books.
Their next best-selling title is “Fairy Tail” at just over 17k (this was 24k last year). There are an astounding sixty-three volumes of this series in print, but only eight of those are in the Top 750, giving as clear of a glance at the “Hammock Principle” as can be. Briefly stated, books in a series generally sell in a sales pattern that looks like a hammock if you chart it out: the first few volumes and the last few volumes sell the best, with the ends running down into the middle volumes which have the lowest sales, like the sagging part of a hammock. The problem with this, as both stores that don’t have infinite rack space, as well as publishers that need a certain volume and velocity to keep things in print, that sagging middle becomes unsustainable for most series over time.
The third best-seller for Kodansha is “Sailor Moon”, with v1 doing about 12k. v2 & 3 also appear in the top 750, but combined they fall just short of what v1 sells.
These Long Tail figures are just for Kodansha-published titles, and they reflect that Kodansha, itself, first started publishing in 2010:
| Year | # of listed items | Percent Change | Total Unit Sold | Percent Change | Total $ Sold | Percent Change | Av. Sale per title | Av $ per title |
| 2010 | 9 | —— | 13,291 | —— | $322,717 | —— | 1477 | $35,857.44 |
| 2011 | 108 | 1200.00% | 197,021 | 1482.36% | $2,537,221 | 786.21% | 1825 | $23,492.79 |
| 2012 | 246 | 127.78% | 324,827 | 64.87% | $4,026,770 | 58.71% | 1320 | $16,368.98 |
| 2013 | 320 | 30.08% | 501,554 | 54.41% | $6,299,487 | 56.44% | 1567 | $19,685.90 |
| 2014 | 442 | 38.13% | 821,298 | 63.75% | $10,481,008 | 66.38% | 1858 | $23,712.69 |
| 2015* | 455 | 2.94% | 855,347 | 4.15% | $10,938,531 | 4.37% | 1880 | $24,040.73 |
| 2016* | 587 | 29.01% | 981,386 | 14.74% | $12,596,281 | 15.16% | 1672 | $21,458.74 |
| 2017 | 895 | 52.47% | 917,596 | -6.50% | $13,616,224 | 8.10% | 1025 | $15,213.66 |
In 2017 Kodansha has no titles over 20k, and eight more over 10k.
#3 MANGA – YEN PRESS
The #3 manga publisher is Yen Press, which places just 27 titles in the Top 750, with about 165k copies sold (down from 350k last year), and nearly $2.6 million retail gross (down from $5.8 million retail gross). Yen is a division of Hachette (more on them later).
Yen’s sole significant seller is “Black Butler”, where v1 brings in just under 15k in the bookstore market. They sell nothing else over 10k.
In the Long Tail Yen is actually selling slightly better than Kodansha, but they need 60% more SKUs to do so. That doesn’t seem very healthy in my read.
| Year | # of listed items | Percent Change | Total Unit Sold | Percent Change | Total $ Sold | Percent Change | Av. Sale per title | Av $ per title |
| 2007 | 10 | —— | 12,896 | —— | $147,449 | —– | 1,290 | $14,744.90 |
| 2008 | 90 | 800.00% | 110,126 | 753.95% | $1,237,860 | 739.52% | 1,224 | $13,754.00 |
| 2009 | 211 | 134.44% | 330,962 | 200.53% | $3,697,113 | 198.67% | 1,569 | $17,521.86 |
| 2010 | 344 | 63.03% | 560,983 | 69.50% | $6,650,871 | 79.89% | 1,680 | $19,333.93 |
| 2011 | 460 | 33.72% | 764,125 | 36.21% | $9,953,966 | 49.66% | 1,661 | $21,639.06 |
| 2012 | 548 | 19.13% | 647,948 | -15.20% | $8,735,264 | -12.24% | 1,182 | $15,940.26 |
| 2013 | 654 | 19.34% | 692,380 | 6.86% | $9,715,421 | 11.22% | 1,059 | $14,855.38 |
| 2014 | 776 | 18.65% | 682,135 | -1.48% | $9,985,502 | 2.78% | 776 | $12,867.92 |
| 2015* | 649 | -16.37% | 917,620 | 34.52% | $13,248,445 | 32.68% | 1414 | $20,413.63 |
| 2016* | 793 | 22.19% | 1,072,008 | 16.82% | $15,520,207 | 17.15% | 1352 | $19,571.51 |
| 2017 | 1403 | 76.92% | 928,962 | -13.34% | $13,866,675 | -10.65% | 662 | $9,883.59 |
Yen Press has only one title selling over 10k copies in 2017, they also dropped significantly in Long Tail revenue. That can’t be good news.
#4 MANGA – SEVEN SEAS
The fourth largest publisher of manga in 2017, on the Top 750 of BookScan is Seven Seas, which places 20 titles, for 162k and $2.5 million in sales. This is a very small rise on the previous year of $2.4m.
Seven Seas’ Long Tail shows they hit a wall after several years of fantastic growth.
| Year | # of listed items | Percent Change | Total Unit Sold | Percent Change | Total $ Sold | Percent Change | Av. Sale per title | Av $ per title |
| 2007 | 54 | —— | 50,641 | —— | $558,450 | —– | 938 | $10,341.67 |
| 2008 | 76 | 41.74% | 80,112 | 58.20% | $833,667 | 49.28% | 1,054 | $10,969.30 |
| 2009 | 97 | 27.63% | 74,967 | -6.42% | $807,666 | -3.12% | 773 | $8.326.45 |
| 2010 | 93 | -4.12% | 75,764 | 1.06% | $875,612 | 8.41% | 815 | $9,415.18 |
| 2011 | 118 | 26.88% | 116,360 | 53.58% | $1,426,618 | 62.93% | 986 | $12,089.98 |
| 2012 | 151 | 27.97% | 124,262 | 6.79% | $1,684,994 | 18.11% | 823 | $11,158.90 |
| 2013 | 223 | 47.68% | 204,419 | 64.51% | $2,942,608 | 74.64% | 917 | $13,195.55 |
| 2014 | 300 | 34.53% | 284,484 | 39.17% | $3,979,338 | 35.23% | 948 | $13,264.46 |
| 2015* | 304 | 1.34% | 374,715 | 31.72% | $5,177,568 | 30.11% | 1233 | $17,031.47 |
| 2016* | 417 | 37.17% | 491,947 | 31.29% | $6,960,634 | 34.44% | 1180 | $16,692.17 |
| 2017 | 554 | 32.85% | 478,336 | -2.77% | $6,801,527 | -2.29% | 863 | $12,277.12 |
Their best-selling title is “The Ancient Magus Bride”, where v1 sells over 13k. There’s a very interesting success also in “My Lesbian Experience With Loneliness” which pulls in nearly 11k sold, and is one of my personal best selling Manga in the last six months.
Seven Seas has four titles that sell over 10k.
#5 MANGA – DARK HORSE
Moving back up to the #5 manga publisher is Dark Horse, with fifteen placing titles in the Top 750, for 96k copies sold and $1.5m in dollar sales (that’s up a lot now two years in a row)
The best-selling DH title is “Berserk” v1, scoring just over 14k copies sold.
Looking at the Long Tail, this is what Dark Horse’s (manga only!) recent performance looks like – they seems to have finally reversed and stabilized their years-long slump.
| Year | # of listed items | Percent Change | Total Unit Sold | Percent Change | Total $ Sold | Percent Change | Av. Sale per title | Av $ per title |
| 2007 | 341 | —— | 249,943 | —— | $3,329,464 | —– | 733 | $14,744.90 |
| 2008 | 420 | 23.17% | 248,981 | -0.38% | $3,176,870 | -4.58% | 593 | $7,563.98 |
| 2009 | 455 | 8.33% | 226,497 | -9.03% | $2,915,693 | -8.22% | 498 | $6,408.12 |
| 2010 | 473 | 3.96% | 194,494 | -14.13% | $2,633,077 | -9.69% | 411 | $5,566.76 |
| 2011 | 497 | 5.07% | 189,329 | -2.66% | $2,602,230 | -1.17% | 381 | $5,235.86 |
| 2012 | 493 | -0.80% | 112,373 | -40.65% | $1,631,038 | -37.32% | 228 | $3,308.39 |
| 2013 | 521 | 5.68% | 103,538 | -7.86% | $1,678,563 | 2.91% | 199 | $3,221.81 |
| 2014 | 559 | 7.29% | 100,894 | -2.60% | $1,617,251 | -3.65% | 180 | $2,893.11 |
| 2015* | 303 | -45.80% | 135,444 | 34.24% | $2,238,167 | 38.39% | 447 | $7,386.69 |
| 2016* | 225 | -25.74% | 174,298 | 28.69% | $2,291,355 | 2.38% | 775 | $10,183.80 |
| 2017 | 527 | 234.22% | 238,089 | 36.60% | $3,795,506 | 65.64% | 452 | $7,202.10 |
Dark Horse Manga has two books over 10k – both “Berserk”, but their Long Tail numbers are wonderfully positive.
There’s more about Dark Horse down below in the “Western” section.
#6 MANGA – VERTICAL
Sliding back to the sixth largest publisher of manga, as measured by the BookScan Top 750, is Vertical. They place nine into the Top 750, 56k copies, for $1.2 million – that’s a soften from the previous year.
The Long Tail, on the other hand, shows growth – they’ve had a great five years now!:
| Year | # of listed items | Percent Change | Total Unit Sold | Percent Change | Total $ Sold | Percent Change | Av. Sale per title | Av $ per title |
| 2007 | 25 | —— | 23,444 | —— | $417,914 | —— | 938 | $16,716.56 |
| 2008 | 34 | 36.00% | 21,003 | -10.41% | $343,109 | -8.21% | 617 | $10,091.44 |
| 2009 | 39 | 14.71% | 19,434 | -7.47% | $325,437 | -5.15% | 498 | $8,344.54 |
| 2010 | 62 | 58.97% | 33,097 | 70.30% | $494,098 | 51.83% | 534 | $7,969.32 |
| 2011 | 84 | 35.48% | 49,062 | 48.24% | $699,253 | 41.52% | 584 | $8,324.44 |
| 2012 | 118 | 40.48% | 45,026 | -8.23% | $671,086 | -4.03% | 382 | $5,687.17 |
| 2013 | 159 | 34.75% | 61,906 | 37.49% | $1,128,252 | 68.12% | 389 | $7,095.92 |
| 2014 | 187 | 17.61% | 83,312 | 34.58% | $1,491,984 | 32.24% | 446 | $7,978.53 |
| 2015* | 162 | -13.37% | 110,172 | 32.24% | $1,956,167 | 31.11% | 680 | $12,075.10 |
| 2016* | 185 | 14.20% | 172,792 | 56.84% | $2,931,568 | 49.86% | 934 | $15,846.31 |
| 2017 | 269 | 45.41% | 181,216 | 4.88% | $3,178,964 | 8.44% | 674 | $11,817.71 |
Vertical had a single book over 10k: the first volume of “Chi’s Sweet Home”
There’s only one other Manga title that places over 10k copies this year, this is from Ten Speed Press: “The Life Changing Manga of Tidying Up”, which scores a bit over 17k sold. I hope it brings them all joy! This is my other best-selling manga in my stores this year, for what it is worth.
And to finally close out the Manga Top 750, we have 5139 copies of Abby Denson’s “Cool Japan Guide” from Tuttle, a cartoon travelogue, two volumes of the “Manga” adaptation of Disney’s “Beauty & The Beast” from Tokyopop (4587 sold on the bigger one), and, last but not least, 4249 copies of the LGBT-oriented “My Brother’s Husband” published by Pantheon.
2017 Western Publishers
When I say “Western” here, I mean publishers/work from Europe and America, as opposed to Asia, not publishers of the genre of “western” comics!
I’d like to continue to remind you that back in 2008 there was some sort of behind-the-scenes recategorization in what got sent to me – I now know this is probably a change in BISAC codes! – and most of the “cartoon-strip humor” books like “Calvin & Hobbes” and “The Far Side” suddenly disappeared, so there’s kind of a not-strictly apples thing going on with the pre-2008 numbers here. Do keep that in mind when making comparisons both in the Top 750 chart, as well as the Long Tail.
BookScan itself does not try to control how data gets initially logged (or changed), leaving that all to publishers. I think that I understand this reasoning: the publisher is the customer, and they should have some level of control over how they are represented, but as a person who tries to decipher the data each year, I know that I would prefer some sort of internally-consistent (and externally-petionable!) method of categorizing titles that doesn’t seem to change in some fashion from year-to-year – Books will appear and disappear, almost seemingly willy-nilly, and it makes showing you anything even resembling consistent data staggeringly difficult. All of this is a function of how publishers assign BISACs and in what order – see the preamble above!
Another observation I have is that BookScan tracks (theoretically at least, since again, publishers set their own BISACs) Adult reading distinctly from YA and Kids. I don’t. Part of this is that I’m a bookseller, and I’m rather agnostic about who specifically buys books as a result. But I have to be certain to make this point as clearly as I can: the market for who is buying comics is changing, and it is changing for the wider and the better. The eight year old who is inhaling Dav Pilkey in 2017 is going to be the comics-literate adult of 2030 (or whatever), which is going to change what comics readers in the ‘30s will want or expect. The kids reading comics in 1965 totally imagined what the 1980’s comics scene could and would be, which is why we’re where we are today, but the shape of the Western industry in the future is absolutely what today’s children read and see.
OK, enough editorializing, let’s look at the market!
Here’s the Top 750 over time:
| Year | # of placing titles | Unit sales | Dollar sales |
| 2003 | 304 | 2,133,618 | $32,360,644 |
| 2004 | 233 | 1,467,535 | $22,713,802 |
| 2005 | 142 | 1,315,920 | $21,537,155 |
| 2006 | 174 | 1,689,571 | $29,314,852 |
| 2007 | 175 | 1,746,962 | $33,247,187 |
| 2008 | 236 | 2,710,175 | $48,327,594 |
| 2009 | 299 | 3,219,748 | $52,147,410 |
| 2010 | 314 | 3,297,317 | $54,515,605 |
| 2011 | 358 | 3,068,593 | $77,254,870 |
| 2012 | 383 | 3,530,143 | $68,593,986 |
| 2013 | 435 | 3,988,864 | $74,805,932 |
| 2014 | 479 | 4,910,846 | $90,166,989 |
| 2015* | 471 | 6,729,449 | $115,035,044 |
| 2016* | 439 | 7,338,541 | $123,594,588 |
| 2017 | 466 | 7,846,357 | $117,761,519 |
Up in pieces (almost 7%), Down in dollars (almost 5%) – it’s one of those years..
Let’s start with a look at the Long Tail for Western publishers collectively:
| Year | # of listed items | % Change | Total Pieces | % Change | Total Dollars | % Change | Av. Sale per title | Av $ per title |
| 2007 | 6950 | — | 3,029,039 | — | $74,595,605 | — | 436 | $10,733.18 |
| 2008 | 9728 | 39.97% | 5,368,678 | 77.24% | $98,233,459 | 31.69% | 552 | $10,098.01 |
| 2009 | 10,936 | 12.30% | 5,946,595 | 10.76% | $107,263,294 | 9.19% | 544 | $9,808.27 |
| 2010 | 13,229 | 20.97% | 5,890,507 | -0.01% | $105,342,577 | -0.02% | 445 | $7,963.00 |
| 2011 | 14,954 | 13.04% | 6,001,731 | 1.89% | $112,823,763 | 7.10% | 401 | $7,544.72 |
| 2012 | 17,031 | 13.89% | 6,052,179 | 0.84% | $123,471,753 | 9.44% | 355 | $7,249.82 |
| 2013 | 17,468 | 2.57% | 6,637,420 | 9.67% | $131,767,547 | 6.72% | 380 | $7,543.37 |
| 2014 | 19,524 | 11.77% | 7,905,939 | 19.11% | $156,040,431 | 18.21% | 405 | $7,992.24 |
| 2015* | 18,019 | -7.71% | 10,689,116 | 34.44% | $197,553,909 | 26.60% | 593 | $10,963.64 |
| 2016* | 16,328 | -9.38% | 11,516,867 | 7.74% | $212,698,759 | 7.67% | 705 | $13,026.63 |
| 2017 | 25,183 | 54.23% | 12,544,715 | 8.92% | $217,360,776 | 2.19% | 498 | $8,631.25 |
Fantastic collective performance as we get a more complete list of titles after the ’15-’16 problem – a million more books sold, close to five million more dollars sold. Comics in general look like they’re doing really fantastic in this slice!
Next, we’ll survey each of the publishers, and their best-selling titles, ranking them by the number of pieces they sold this year.
#1 – Scholastic
It is now the third year in the row that our #1 Western publisher in the Top 750 is Scholastic, and Scholastic surges wildly forward in sales this year by selling more than 2.7 million copies over 42 placing books – that’s up an incredible 42% from the 1.9 million last year. In dollars, we’re looking at $32.4 million, up from $23m in 2016.
This is even more incredible when you consider that the next largest publisher sold 828k copies, less than a third of their volume.
Scholastic has several imprints – besides the Graphix imprint, they also publish Arthur A. Levine and Blue Sky, and together, they place 36 titles in 2016 for almost 1.9 million copies, and almost $23 m in sales.
(Though, note that this is exclusively through BookScan reporters – there is a working assumption that whatever retail bookstore sales we’re seeing here are just a fraction of their overall sales – between Book Fairs, school sales, Library sales and such, Scholastic might be racking up much more impressive numbers, but I can only analyze what data we actually have!)
In alphabetical order by imprint:
Arthur A. Levine, as usual, places one book into the Top 750: just a bit over 9k copies of “The Arrival” by Shaun Tan – a small rise from last year.
Blue Sky is also just one book in the Top 750 – Dav Pilkey’s “Ook & Gluk, Kung-Fu Cavemen” more than doubles in sales to almost 25k, probably drafting on the staggering success of “Dog Man”.
The Graphix imprint has 31 placing titles, for just over 2.5m in sales, and is where the big hits live: the aforementioned “Dog Man” and all of Raina Telgemeier’s books (“Sisters”, “Smile”, “Drama”, and the “Baby Sitter’s Club” adaptations), all of which are discussed up top.
Graphix also continues to do well with Kazu Kibuishi’s “Amulet” – while there was not a new volume this year all seven volumes and two different box sets chart, with the first volume, “The Stonekeeper”, selling over 46k.
Jennifer Holm’s “Swing It, Sunny!” debuts with an impressive 35k, while the first volume (“Sunny Side Up”) sells 28k this year.
Jeff Smith’s “Bone”, which largely launched Graphix, places four of the nine volumes into the Top 750 this year. V1, “Out From Boneville”, sells almost 16k copies this year.
While neither reached over 5k, two other new series launched into the Top 750: Molly Ostertag’s “The Witch Boy”, and “Newsprints” by Ru Xu.
Scholastic also publishes as “Scholastic”, straight up, where the big hit is Jeffrey Brown’s “Jedi Academy” books: the first volume sold about 32k copies this year. They also are the imprint for Dav Pilkey’s “Super Diaper Baby” where v1 sells a bit over 26k. I’m not really clear why each of Pilkey’s series are homed at a different imprint, but then I’m not a publisher.
The Long Tail for Scholastic looks like this – more superb growth:
| Year | # of listed items | Percent Change | Total Unit Sold | Percent Change | Total $ Sold | Percent Change | Av. Sale per title | Av $ per title |
| 2007 | 28 | —— | 203,900 | —— | $2,018,694 | —– | 7282 | $72,096.21 |
| 2008 | 39 | 39.29% | 346,134 | 69.76% | $3,498,012 | 73.28% | 8875 | $89,692.62 |
| 2009 | 52 | 33.33% | 432,070 | 24.83% | $4,654,686 | 33.07% | 8309 | $89,513.19 |
| 2010 | 60 | 15.38% | 361,086 | -16.43% | $4,084,718 | -12.25% | 6018 | $68,078.63 |
| 2011 | 72 | 20.00% | 419,010 | 16.04% | $4,708,860 | 15.28% | 5819 | $65,400.83 |
| 2012 | 76 | 5.56% | 325,088 | -22.42% | $3,955,249 | -16.00% | 4277 | $52,042.75 |
| 2013 | 91 | 19.74% | 437,590 | 34.61% | $5,365,921 | 35.67% | 4809 | $58,966.16 |
| 2014 | 97 | 6.59% | 846,277 | 93.39% | $10,204,175 | 90.17% | 8725 | $105,197.68 |
| 2015* | 140 | 44.33% | 1,449,296 | 71.26% | $17,170,714 | 68.27% | 10,352 | $122,647.96 |
| 2016* | 131 | -6.43% | 1,940,760 | 33.91% | $23,919,704 | 39.31% | 14,815 | $182,593.16 |
| 2017 | 166 | 26.72% | 2,823,345 | 45.55% | $33,884,541 | 41.66% | 17,008 | $204,123.74 |
Scholastic has one book over 400k, two more over 300k, five more over 100k, four more over 50k, sixteen more over 20k, and another three over 10k. Whew! Any other publisher would be satisfied with half of that.
#2 – DC ENTERTAINMENT
Our #2 publisher in the Top 750, once again, is DC Entertainment.
In 2017 they placed 110 titles in the Top 750, for a bit under 828k units, and just under $15.2 m in retail dollars, from their two charting imprints. “DC” itself is 98 of those placements, while “Vertigo” represents 12. (In the Long Tail we still have America’s Best Comics, CMX, Mad, Paradox and Wildstorm)
By how they’re getting eclipsed by Scholastic, you can see why DC has announced a Juvenile and Young Adult lines! (several of those books look pretty great, too)
Here’s a year-to-year comparison chart of the Top 750:
| Year | # of placing titles | Unit sales | Dollar sales |
| 2003 | 74 | 336,569 | $6,151,258 |
| 2004 | 39 | 179,440 | $3,135,983 |
| 2005 | 42 | 298,484 | $5,440,001 |
| 2006 | 59 | 551,160 | $10,246,082 |
| 2007 | 58 | 487,467 | $9,953,976 |
| 2008 | 71 | 1,015,864 | $19,805,098 |
| 2009 | 93 | 1,223,733 | $24,061,834 |
| 2010 | 96 | 648,403 | $12,523,128 |
| 2011 | 107 | 660,706 | $13,083,378 |
| 2012 | 104 | 688,870 | $14,811,979 |
| 2013 | 130 | 767,686 | $15,620,981 |
| 2014 | 131 | 931,239 | $19,207,755 |
| 2015* | 119 | 1,074,304 | $21,701,088 |
| 2016* | 117 | 1,234,047 | $23,203,071 |
| 2017 | 101 | 827,544 | $15,234,525 |
2017 does not seem to have been a terrific year in the book stores for DC according to the BookScan reporters – strongly down on both metrics despite being miles ahead of most of their competitors
DC’s highest placing book is “Batman: The Killing Joke”, which sold about 36k copies. That’s really fantastic, but it is blunted a little given that the book sold almost 131k copies in 2016, and 70k copies, in 2015. Now, a big chunk of that, I think, was driven by the release of the animated adaptation driving sales of the book, so this is just settling back to “normal”.
I am sure that no one is surprised that Batman is DC’s most lucrative property – about a third, thirty-two of the ninety-eight DC branded books are either directly Batman, or a member of his extended “family” (“Nightwing”, “Red Hood”, and so on), and account for 289k of DC’s sales. Notable books here include the launch of the “Rebirth” era of Batman with v1 of Tom King’s run at #3 doing a bit over 24k (and v2 doing 12k, v3 at 8k, v4 at 5k), and the hardcover of Miller’s “The Master Race” debuting at 14k (#8). Miller’s original, “Dark Knight Returns” does just over 11k, while “Batman Year One does just under. The Batman/Flash “The Button” storyline debuts at 14k (#9), and there’s more “Rebirth” volumes with the first “Harley Quinn” at 13k, and the first “Nightwing” at just under that. Otherwise, only “Hush” is the only other Batman title that racks over 10k (it actually does 11.5k) – the first volume of Scott Snyder’s “New 52” run, “The Court of Owls” drops right under 10k. Those last two are under half of what they sold last year.
DC’s #2 title is “Watchmen”, coming in at a little under 31k in paperback, a small drop from 36k last year (5k copies of the hardcover also make the Top 750) and the $20 hardcover of the “DC Rebirth Special” that ties into to “Watchmen” shifts over 11k copies in its second frame, making the tying of “Watchmen” to the regular DC Universe appear to be a wise fiscal idea. Author Alan Moore is also responsible for DC’s #5 book, “V For Vendetta” (18k)
The fourth best-selling title for DC is the first volume of the “Rebirth” era of Flash: “Lightning Strikes Twice” – just over 19k (and 7500 copies of v2, and 5k copies of v3). Flash runs on (ugh, sorry) with several other books in the Top 750, including almost 13k copies of “Flashpoint”, just over 10k copies of the first volume of the “New 52” era (“Move Forward”), and almost 7k copies of “Flash: Rebirth” (no, the other kind)
At #6 we get something we haven’t seen for a long time: a Wonder Woman volume at the top with the first volume of the “Rebirth” era, “The Lies”, bringing in 16k copies – and there’s also a Barnes & Noble exclusive cover that sells an additional 4100 copies, while v2 does 11k (v3 sells about 4300 copies). Nearly 8k copies of “Her Greatest Battles” also charts, as well as a little less than 5k of the first volume of the “New 52” era: “Blood”.
DC’s seventh best-seller is “Injustice”, based on the video game – that brings in over 15k copies for the complete collection of “Year One”. “Year Two” does almost 12k. The two volumes of “Year Three” each do about 5200 copies, and “Year Four” and “Year Five” chart, though at below 5k each. Successful franchise!
DC’s #10 book is the first volume of Neil Gaiman’s Sandman which does nearly 14k (v2 does 6600 or so, while v3 & the prequel series “Overture” chart in the top 750, but under both 5k sold. Vertigo’s other over-10k hit is the first volume of Garth Ennis’ and Steve Dillon’s “Preacher” (10.5k, really) V2 does 7k, and v3 does 5300-ish and four charts under 5k.
Also selling over 10k is the first “Rebirth” volume of Superman at 12.5k (v2 sells about 6400), and almost 12k copies of the first volume of “DC Superhero Girls”. V2 and 3 of that each sell just under 10k, while v4 is a bit under 5k. There’s also the first appearance of the Justice League despite there being that big tentpole movie in the theatres – three first volumes of JL appear, all hovering a little bit above 10k: “The Extinction Machines” which is the first volume of the “Rebirth” era as well as “Origin” (the first volume of the New 52 era), and finally “Their Greatest Triumphs”, also led by Johns/Lee material. Here’s a clear case where the move just didn’t sell a meaningful amount of comics.
Here’s DC’s Long Tail – clearly whatever data I got in ’15-’16 was way off, but even with the title count restored, it was a badly down year for DC through BookScan reporters, even though they are the largest publisher of all, once you look at their Tail.
| Year | # of listed items | % Change | Total Pieces | % Change | Total Dollars | % Change | Av. Sale per title | Av $ per title |
| 2007 | 1644 | — | 1,181,218 | — | $22,033,212 | — | 719 | $13,402 |
| 2008 | 2057 | 25.12% | 1,719,330 | 45.56% | $33,609,704 | 52.54% | 836 | $16,339 |
| 2009 | 2264 | 10.06% | 1,902,181 | 10.64% | $37,816,864 | 12.52% | 840 | $16,704 |
| 2010 | 2442 | 7.86% | 1,320,262 | -30.59% | $25,982,910 | -31.29% | 541 | $10,640 |
| 2011 | 2423 | -0.07% | 1,323,630 | 0.26% | $27,130,811 | 4.42% | 546 | $11,197 |
| 2012 | 2452 | 1.20% | 1,206,198 | -8.87% | $26,729,997 | -1.48% | 492 | $10,901 |
| 2013 | 2551 | 4.04% | 1,369,850 | 13.57% | $29,881,153 | 11.79% | 537 | $11,714 |
| 2014 | 2746 | 7.64% | 1,638,901 | 19.64% | $35,388,570 | 18.43% | 597 | $12,887 |
| 2015* | 1690 | -38.46% | 1,997,577 | 21.89% | $43,031,546 | 21.60% | 1182 | $25,462 |
| 2016* | 1214 | -28.17% | 2,262,888 | 13.82% | $47,963,215 | 11.46% | 1864 | $39,508 |
| 2017 | 3152 | 259.64% | 1,948,037 | -13.91% | $42,921,514 | -10.51% | 618 | $13,617 |
DC now just has three books over 20k, and twenty-five more that come in over 10k.
#3 – IMAGE COMICS
Image Comics stays as our #3 Western publisher via the BookScan reporters; Image has 52 titles placing within the Top 750 in 2017, that sell 556k copies and just a notch over $11m. That’s a huge drop from last year’s 909k, and almost $23m.
This is what Image’s performance has looked like, in the Top 750, over the last decade:
| Year | # of placing titles | Unit sales | Dollar sales |
| 2003 | 1 | 2,328 | $30,148 |
| 2004 | 1 | 402 | $5,206 |
| 2005 | 3 | 8,699 | $100,236 |
| 2006 | 1 | 5,311 | $113,465 |
| 2007 | 4 | 28,349 | $344,026 |
| 2008 | 9 | 55,033 | $830,574 |
| 2009 | 11 | 78,874 | $1,210,094 |
| 2010 | 22 | 289,044 | $6,479,930 |
| 2011 | 27 | 367,265 | $8,670,917 |
| 2012 | 33 | 701,050 | $20,389,762 |
| 2013 | 38 | 651,390 | $19,371,269 |
| 2014 | 47 | 691,804 | $17,554,492 |
| 2015 | 71 | 878,262 | $22,587,672 |
| 2016 | 72 | 908,655 | $22,917,758 |
| 2017 | 52 | 556,196 | $11,092,960 |
So, yeah, that’s absolutely the worst Image has done with the BookScan reporters in six years, losing about half of their volume in the Top 750.
But, maybe, let’s start with the good news first? Image’s #1 book for the year, as reported by BookScan users, is Brian K Vaughan and Fiona Staples’ “Saga”, where v7, the newest release, scores 45k copies, up a little from 2016’s 44k. “Saga” also takes spot #5 with v1 (20k), and #8 (v6 and 16k), and every one of the softcovers scores well over 10k copies. Even v2 of the HC sells 13k (v1 racks just 8k) Vaughan’s “Paper Girls” also comes in at #6 with almost 20k sold of v1 and #10 with 15k for v2 (there’s also 11k for v3)
Much of Image’s chart collapse is on the absolute freefall that has become “The Walking Dead” in 2017. “TWD” used to be Image’s huge juggernaut-like cash cow – just within last year’s Top 750, the 37 placing “TWD” titles sold more than a half-million copies for $17.5m dollars – but things have collapsed and this year the collective performance (on just 17 volumes) is down to just over 200k sold, for just $5.7m in sales. The best-selling “TWD” book is v27 at just over 36k, while v28 moves about 24k. But the real plummet is in the Compendium editions where volume 1 (#7) plunges down to under 19k sold, when it did 71k in the previous year, and hasn’t sold less than 60k in any of the last six years. Before you start shedding any tears for Kirkman and Adlard, don’t forget those compendia are reprints of reprints, and were (essentially) just “found money”, though this is a big potential cash flow crunch as they right-size inventory to adjust to the new reality.
The question, of course, becomes if this is a one-time realignment, or the beginning of something more serious. I’d guess towards the former just because the “frontlist” of the newly released v27 is pretty close to what the best new volume sold last year (43k), but it is worrying that the stand-alone v1 drops to about 14k, down from 26k last year which suggests (along with the compendium) that the huge drive of yearly new readers is coming to an end. The “original graphic novel” of “Here’s Negan” does decently with about 11k units sold (plus a bit more than 8k of a B&N exclusive cover)
In the full Long Tail chart, “The Walking Dead” about 266k copies for $7.1m – this is down massively from last year’s 405k and $16m, and that $8.9m in sales difference is the majority of Image’s $9.7m loss in the Long Tail chart below.
Image’s #4 best-selling title is the first volume of Majorie Liu and Sana Takada’s “Monstress”, coming a little short of 24k, almost exactly the same as last year. V2 also launches at about 13k.
Only one other new Image volume manages to pull in sales over 10k this year: the first volume of Bryan Lee O’Malley and Leslie Hung’s “Snotgirl”, which almost pulls in 11k, along with another 4k or so from a Barnes & Noble exclusive cover. Series that were selling over 10k last year included the first volumes of “Descender”, “Bitch Planet” and “Rat Queens”, but the best-selling of these (“Bitch Planet”) dropped to around 8k this year in the bookstores, and the others are even lower. Image needs to seriously develop a few more new hits.
Here’s what Image’s Long Tail looks like: just like from the top, it’s a brutal cut this year. Losing a third of your dollar sales has got to suck.
| Year | # of listed items | Percent Change | Total Unit Sold | Percent Change | Total $ Sold | Percent Change | Av. Sale per title | Av $ per title |
| 2007 | 438 | —— | 116,015 | —— | $2,313,477 | —– | 265 | $5,281.91 |
| 2008 | 515 | 17.58% | 121,001 | 4.30% | $2,445,765 | 5.72% | 235 | $4,749.06 |
| 2009 | 571 | 10.87% | 156,466 | 29.31% | $3,207,033 | 31.13% | 274 | $5,616.52 |
| 2010 | 642 | 12.43% | 359,238 | 229.59% | $8,152,806 | 254.22% | 560 | $12,699.07 |
| 2011 | 749 | 16.66% | 466,637 | 29.90% | $11,041,187 | 35.43% | 623 | $14,741.24 |
| 2012 | 868 | 15.89% | 794,419 | 70.24% | $22,797,279 | 106.47% | 915 | $26,264.15 |
| 2013 | 994 | 14.52% | 776,507 | -2.25% | $22,085,860 | -3.12% | 781 | $22,219.18 |
| 2014 | 1006 | 1.21% | 830,735 | 6.98% | $20,309,973 | -8.04% | 826 | $20,188.84 |
| 2015* | 842 | -16.30% | 1,070,299 | 28.84% | $26,175,438 | 28.88% | 1271 | $31,087.22 |
| 2016* | 876 | 4.04% | 1,187,316 | 10.93% | $28,267,847 | 7.99% | 1355 | $32,269.23 |
| 2017 | 1531 | 174.77% | 938,991 | -20.91 | $18,564,975 | -34.32% | 613 | $12,126.05 |
Image has five titles over 20K, and another seventeen over 10k.
#4 – PRH
Soaring forward to #4 (they were #7 last year) is the first of the so called “Big Five” traditional book publishers: Penguin Random House. They land thirty-two titles, selling 487k copies for $7.6m in gross sales.
Like a lot of the “big five” book publishers, these companies have lots and lots of imprints built up over decades of publishing books. Penguin Random House, as best as I can tell, has eleven distinct imprints that appear in the Top 750 list for 2016 – Alfred A. Knopf, Ballantine, Bantam, Crown, Del Rey, Dial, Pantheon, Random House, Ten Speed, Tundra and Viking.
They’re also, in the long tail: (deep breath!) Ace, Berkley, Broadway Books, Doubleday, Dutton, Emblem, Golden, Gotham Books, G.P. Putnam & Sons, Grossett & Dunlap, Hudson Street, InkLit, McClelland & Stewart, Montena, New American Library, Penguin, Philomel, Plume, Price Stern Sloan, Puffin, Putnam, Razorbill, Riverhead, Schocken, Schwartz & Wade, Three Rivers, Villard, Watson-Guptill and Yearling. (whew!) However, they are not (Brian writes down here so he remembers this research next year) the PRH-distributed-only Campfire, Frog In Well, Library of America, Overlook Press, Powerhouse, Quirk, Shambhala, Universe, or Verso
Looking at those imprints in alphabetical order:
Alfred A. Knopf Books For Younger Readers places two books into the Top 750, both from Jarrett J. Krosocza’s “Lunch Lady” series. Aimed squarely at, as the imprint’s name implies, younger readers, the best-seller is “Lunch Lady & The Cyborg Substitute” with sales just over 7.2k.
Ballantine places just one title in the Top 750: Bryan Lee O’Malley’s “Seconds”, which sells nearly 6k copies in its fourth year of release.
Bantam (not “Batman” I tell you, mistyping fingers!) has the adaptation of George R.R. Martin’s third “Dunk & Egg” short story, “The Mystery Knight” (the first two are published by Amazon’s print comics imprint, “Jet City Comics”, but don’t make the Top 750) which debuts in hardcover to about 4500 copies.
Crown Books for Younger Readers has two volumes of Jeffrey Brown’s awesome “Lucy & Andy Neanderthal” which do 7200 and 5800 copies.
Del Rey publishes the Dave Wenzel adaptation of “The Hobbit” for about 4600 copies.
Dial places two books by powerhouse Victoria Jamieson: “Roller Girl”, which at 64k is Penguin Random House’s best-seller over all, and the delightful new “All’s Faire in Middle School” debuts at a strong 40k
Pantheon is their “literary” comics wing, and has some of PRH’s best-sellers. There are nine Pantheon books within the Top 750, the best-selling being the first volume of Marjane Satrapi’s “Persepolis” at 64k (only about 200 copies under “Roller Girl”!) art spiegelman’s “Maus” comes in second with almost 32k copies sold in what is its 31st consecutive year in print. As usual, that drops to both a significant as well as stupid degree with volume 2 which sells just 13k (it’s like walking out in the middle of a play!) But the spread between “Persepolis”’ first and second volume is even worse: v2 sells not even 6k copies. Where did the other 90% of the readership go? (Were they were not assigned v2 in class?) The complete edition of “Persepolis” sells 27k, while the complete edition of “Maus” sells 18k. “Maus” also has a boxed set that sells 12k. Charles Burns’ “Black Hole” and new debut “Imagine Wanting Only This” by Kristen Radtke also make the Top 750, but both at under 5k.
Random House Books For Younger Readers places seven titles in the Top 750, led by Judd Winick’s “Hilo”, where v1 does 16k, v2 does 12.5k, and v3 debuts at 17k. Looking good! Jennifer Holm’s “Babymouse” has three entries (v1 does 9k), and the debut of “5 Worlds”, with “The Sand Warrior”, launches at about 7k.
Ten Speed Press brings us a single title, a comics biography of Alexander Hamilton, with just over 6k sold.
Tundra makes the list with “Narwahl: Unicorn of the sea”, another juvie-aimed title which does nearly 35k in softcover, as well as almost another 20k in hardcover, which is pretty impressive. The sequel, “Super Narwahl and Jelly Jolt”, does almost 27k.
And finally, Viking comes along with “Caveboy Dave: More Scrawny Than Brawny” with just over 4k right at the bottom of the chart
Penguin Random House formed out of a merger in 2013 – prior to that they were separate publishers Penguin and Random House. Here’s what the Long-Tail for the combined Penguin Random House looked like in 2017:
| Year | # of listed items | % Change | Total Pieces | % Change | Total Dollars | % Change | Av. Sale per title | Av $ per title |
| 2013 | 282 | ——- | 447,174 | ——- | $7,259,364 | ——- | 1,586 | $25,742.43 |
| 2014 | 252 | -10.64% | 428,634 | -4.15% | $7,415,712 | 2.15% | 1,701 | $29,427.43 |
| 2015* | 450 | 78.57% | 513,611 | 19.83% | $8,517,761 | 14.49% | 1,141 | $18,928.36 |
| 2016* | 293 | -34.88% | 435,877 | -15.13% | $7,150,087 | -16.06% | 1,488 | $24,403.03 |
| 2017 | 409 | 39.59% | 664,858 | 52.53% | $10,136,224 | 41.76% | 1,626 | $24,782.94 |
However, I’m not willing to pull an “We’ve always been at war with Eastasia” moment, so let’s look at the individual pieces of the past. This is what Penguin Putnam (Ace, Berkley Books, Dial, Dutton, Gotham Books, Grossett & Dunlap, Hudson Street, InkLit, New American Library, Penguin, Philomel, Plume, Price Stern Sloan, Puffin, Putnam, Razorbill, Riverhead and Viking) used to look like alone)
| Year | # of listed items | % Change | Total Pieces | % Change | Total Dollars | % Change | Av. Sale per title | Av $ per title |
| 2007 | 18 | —— | 13,545 | —— | $178,260 | —— | 753 | $9,903.33 |
| 2008 | 28 | 55.56% | 28,606 | 111.19% | $310,856 | 74.38% | 1022 | $11,102.00 |
| 2009 | 39 | 39.29% | 40,288 | 40.84% | $444,928 | 43.13% | 1033 | $11,408.41 |
| 2010 | 45 | 15.38% | 50,628 | 25.67% | $623,650 | 40.17% | 1125 | $13,858.89 |
| 2011 | 53 | 17.78% | 123,749 | 144.43% | $1,576,161 | 152.73% | 2335 | $29,738.89 |
| 2012 | 60 | 13.21% | 121,769 | -1.60% | $1,499,660 | -4.85% | 2029 | $24,994.33 |
This is what Random House (Alfred A. Knopf, Ballantine, Bantam, Broadway, Crown, Del Rey, Doubleday, Pantheon, Random House, Schocken, and Three Rivers) looked like alone:
| Year | # of listed items | % Change | Total Pieces | % Change | Total Dollars | % Change | Av. Sale per title | Av $ per title |
| 2007 | 74 | — | 216,580 | — | $2,890,347 | — | 2,927 | $39,058.74 |
| 2008 | 77 | 5.47% | 383,105 | 76.89% | $5,698,922 | 97.17% | 4,975 | $74,011.97 |
| 2009 | 109 | 41.56% | 405,598 | 5.87% | $5,398,890 | -5.26% | 3,721 | $49,531,10 |
| 2010 | 132 | 21.10% | 389,410 | -3.99% | $5,831,814 | 8.02% | 2,950 | $44,180.41 |
| 2011 | 144 | 9.09% | 397,143 | 1.99% | $6,356,212 | 8.99% | 2,760 | $44,140.36 |
| 2012 | 185 | 28.47% | 375,254 | -5.51% | $7,124,794 | 12.09% | 2,028 | $38,512.40 |
Penguin Random House has two titles over 50k, five additional books over 20k, and another seven books over 10k.
#5 – ANDREWS MCMEEL
The #5 publisher is now Andrews McMeel. Andrews is a publisher that sometimes frustrates me by how they’ve been represented by BookScan – as I noted, it used to be that “humor” books like “Far Side” and “Calvin & Hobbes” used to rule the BookScan charts. Until, one day, poof! All of those books disappeared entirely from the dataset I was given, throwing off a whole lot of my comparables. And, for the most part, comic strip reprints have stayed out of these charts for half a decade. But, they’ve started creeping back into the listings for the last few years. I’m actually fine with comic strips and comic books co-existing in the same places – at least they’re both comics – but the inconsistency just drives me nucking futz.
I found 23 titles from Andrews in the Top 750 in 2016, for 463k copies and $4.7 million in sales, but clearly that number would scale up to some large degree if it listed all of the strip collections they publish. I have no reason to think that “Calvin & Hobbes” isn’t selling well through today.
Lincoln Pierce and “Big Nate” is the big star player for Andrews McMeel – fourteen of the twenty-three placing titles are that series that combine for 334k total copies and almost $3.4m dollars. And, again, it’s probably very safe to assume there are significant sales happening on these books that BookScan isn’t capturing. This year’s best-selling “Big Nate” book is the debut of “What’s a Little Noogies Between Friends” with almost 92k copies sold.
The other big winner here in the charts is “Pheobe and Her Unicorn” which while not scaling the same heights (v1 sells 35k), still places all six volume in the series into the best-sellers with sales over 10k, which is terrific.
Andrews McMeel’s Long Tail chart is just about the most useless one of all because they publish a whole lot of comics (humor strips, like “Calvin & Hobbes”) where the BISAC changed to something we’re having a hard time properly getting – almost certainly they’re doing several times better than this chart would suggest because of those books. Further, things appear and disappear in a way I’ve never been able to make sense of – it might be them changing BISACs after the fact. Most of my comparatives are terrible and counterproductive here, and I really apologize for the weakness of my data in this specific instance.
Still, they’re one of the rare down publishers this year.
| Year | # of listed items | Percent Change | Total Unit Sold | Percent Change | Total $ Sold | Percent Change | Av. Sale per title | Av $ per title |
| 2007 | 22 | —— | 29,835 | —— | $461,238 | —– | 1,356 | $20,965.36 |
| 2008 | 20 | -9.09% | 25,115 | -15.82% | $388,965 | -15.67% | 1,256 | $19,448.25 |
| 2009 | 21 | 5.00% | 26,205 | 4.34% | $401,982 | 3.35% | 1,248 | $19,142.00 |
| 2010 | 19 | -9.52% | 47,181 | 80.05% | $544,852 | 35.54% | 2,483 | $28,676.42 |
| 2011 | 17 | -10.53% | 116,850 | 147.66% | $1,222,171 | 124.31% | 6,874 | $71,892.41 |
| 2012 | 31 | 82.53% | 225,546 | 93.02% | $2,737,935 | 124.02% | 7,276 | $88,320.48 |
| 2013 | 43 | 38.71% | 343,681 | 52.38% | $3,747,799 | 36.88% | 7,993 | $87,158.12 |
| 2014 | 59 | 37.21% | 373,713 | 8.74% | $4,387,252 | 17.06% | 6,334 | $74,360.21 |
| 2015* | 76 | 28.81% | 502,061 | 34.34% | $5,950,368 | 35.63% | 6,606 | $78,294.32 |
| 2016* | 85 | 11.84% | 472,145 | -5.96% | $5,147,673 | -13.49% | 5,555 | $60,560.86 |
| 2017 | 140 | 64.71% | 520,554 | 10.25% | $5,644,031 | 9.64% | 3,718 | $40,314.51 |
Andrews McMeel has two books over 50k, two more over 20k, and thirteen others over 10k.
#6 SIMON & SCHUSTER
Dropping down to #6 Western Publisher in the BookScan Top 750 is Simon & Schuster, who are also one of the mainstream book publishing so-called “Big Five”. They take this position with just ten placing titles, which total 431k in units and $6.4m at retail.
Seven of these books are from their Aladdin imprint, while one each are from Margaret K. Elderberry and Gallery 13 and Touchstone
Aladdin is all about Rachel Renee Russell, with almost 100k copies of “The Misadventures of Max Crumbly”, and 98k of the first volume of “Dork Diaries”. These sell a ton, but are down a lot from 208k in 2016 and 358k in 2015. As noted towards the top, if all of the “Dork Diaries” books were in the database given to me, this would almost certainly change the charts a lot.
Gallery 13 is where the Steven King / Bernie Wrightson “Creepshow” lives, and it does almost 9300 copies this year.
The Margaret K. Elderberry imprint also has one book – Emily Carroll’s “Through The Woods”, which sells just under 6k copies, a small rise from the previous year.
Touchstone books has just one title: Allie Brosh’s “Hyperbole and a Half” which sells almost 59k copies, almost identical to the last two years. It is remarkably consistent in sales.
Here is Simon & Schuster’s Long Tail, which includes the imprints that I’m aware of (Aladdin and Simon-named ones, as well as Atria, Atheneum, Free Press, Gallery, Margaret K. Elderberry, Pocket, Scribner, and Touchstone)
| Year | # of listed items | % Change | Total Pieces | % Change | Total Dollars | % Change | Av. Sale per title | Av $ per title |
| 2007 | 12 | — | 8,317 | — | $158,014 | — | 693 | $13,167.83 |
| 2008 | 26 | 116.67% | 14,917 | 79.36% | $211,798 | 34.04% | 574 | $8,146.08 |
| 2009 | 41 | 57.69% | 109,558 | 634.45% | $1,430,544 | 575.43% | 2,672 | $34,891.32 |
| 2010 | 46 | 12.20% | 214,828 | 96.09% | $2,660,094 | 85.95% | 4,670 | $57,828.13 |
| 2011 | 62 | 34.78% | 187,531 | -12.71% | $2,383,491 | -10.40% | 3,025 | $38,443.40 |
| 2012 | 63 | 1.61% | 165,831 | -11.57% | $2,844,453 | 19.34% | 2,632 | $45,150.05 |
| 2013 | 67 | 6.35% | 258,931 | 56.14% | $4,165,350 | 46.44% | 3,865 | $62,169.40 |
| 2014 | 71 | 5.97% | 383,878 | 48.25% | $6,520,821 | 26.55% | 5,407 | $91,842.54 |
| 2015* | 75 | 5.63% | 910,341 | 237.14% | $13,386,461 | 205.29% | 12,138 | $178,486.15 |
| 2016* | 75 | —— | 618,922 | -32.01% | $9,477,798 | -29.20% | 8,252 | $126,370.64 |
| 2017 | 89 | 18.67% | 449,243 | -27.42% | $6,788,432 | -28.38% | 5,048 | $76,274.52 |
It’s the rare Long Tail which is shrinking right now.
Simon & Schuster has four books over 50k, two more over 20k, and one over 10k.
#7 MARVEL COMICS
Dropping down to #7 (previously #5) Western publisher within the Top 750 in 2017 is Marvel Comics, which places 50 titles for about 379k copies and $7.8m sold.
Here is how Marvel looks in the Top 750:
| Year | # of placing titles | Unit sales | Dollar sales |
| 2003 | 73 | 455,553 | $8,428,962 |
| 2004 | 50 | 227,985 | $3,756,764 |
| 2005 | 26 | 153,317 | $2,459,027 |
| 2006 | 33 | 294,852 | $5,702,307 |
| 2007 | 37 | 376,918 | $7,599,057 |
| 2008 | 38 | 303,639 | $6,446,359 |
| 2009 | 34 | 226,541 | $5,019,216 |
| 2010 | 33 | 206,273 | $4,979,323 |
| 2011 | 27 | 128,364 | $3,303,496 |
| 2012 | 32 | 141,145 | $3,872,683 |
| 2013 | 39 | 187,598 | $4,229,242 |
| 2014 | 53 | 342,706 | $8,341,787 |
| 2015* | 63 | 478,076 | $10,611,981 |
| 2016* | 60 | 555,715 | $12,088,278 |
| 2017 | 50 | 378,689 | $7,840,198 |
It is down year for Marvel, reversing six years of growth.
“Marvel” is practically synonymous with “comics” itself amongst the muggles – and they have multiple films and television shows running, well-saturating the market with awareness of their characters and effectively working as free advertising for the comics. Marvel’s publication and collection strategy is a little all over the map, with it really being unclear to the casual reader what book should be read in which order, and this chaos in the line, I believe, is the largest reason they’re not outselling DC significantly in the book market.
In advance of the film (released in Feb of 2018, don’t forget), Ta-Nehisi Coates’ “Black Panther: A Nation Under Our Feet” takes the top of Marvel charts – v1 does 28k, v2 does 17k, and v3 pulls in like 9600 copies. This will almost certainly explode on next year’s chart.
Marvel’s third best-selling comic is “Old Man Logan”, probably on the strength of the “Logan” film. Almost 17k sells there.
Marvel’s fourth best-seller is the first volume of Kieron Gillen’s “Darth Vader” (also about 17k), while the later books all chart (v2 & 3 right around 10k). Eighteen of the fifty placing Marvel titles are “Star Wars”, selling a combined 126k and $2.6m in gross sales.
Marvel’s fifth best-seller is the “Infinity Gauntlet” – something like 16k sold – this, also, is likely to soar in 2018 as the third Avengers movie does a story very similar to it.
At #6 for Marvel is “Deadpool Kills the Marvel Universe” (14k) – not really the tone of the movie, and #7 is the first Ms. Marvel book “No Normal”, with almost 13k. Really that last one is one of the only books to show up without a movie or TV show connected to it (the first “Unbeatable Squirrel Girl” comes in a little over 5k, further down the chart)
No other Marvel comics top 10k in the bookstore market.
Otherwise, it’s pretty much business-as-usual on the Marvel charts this year.
Here is Marvel’s Long Tail.
| Year | # of listed items | % Change | Total Pieces | % Change | Total Dollars | % Change | Av. Sale per title | Av $ per title |
| 2007 | 1230 | — | 1,034,023 | — | $19,947,737 | — | 841 | $16,218 |
| 2008 | 1559 | 26.75% | 1,032,394 | -0.001% | $20,128,825 | 0.01% | 662 | $12,911 |
| 2009 | 2067 | 32.58% | 954,335 | -7.56% | $19,608,696 | -2.58% | 462 | $9,487 |
| 2010 | 2551 | 23.42% | 870,597 | -8.77% | $19,485,662 | -0.06% | 352 | $7,638 |
| 2011 | 2852 | 11.80% | 852,187 | -2.11% | $20,225,728 | 3.80% | 299 | $7,092 |
| 2012 | 3083 | 8.10% | 726,542 | -14.74% | $18,848,013 | -6.81% | 236 | $6,114 |
| 2013 | 3203 | 3.89% | 730,826 | 0.59% | $17,820,299 | -5.45% | 228 | $5,564 |
| 2014 | 3352 | 4.65% | 918,595 | 25.69% | $24,369,961 | 36.75% | 274 | $7,270 |
| 2015* | 1882 | -43.85% | 1,114,414 | 21.32% | $28,021,290 | 14.98% | 592 | $14,889 |
| 2016* | 1841 | -2.18% | 1,277,046 | 14.59% | $31,402,330 | 12.07% | 694 | $17,057 |
| 2017 | 3578 | 94.35% | 1,142,061 | -10.57% | $28,201,535 | -10.19% | 319 | $7,882 |
Marvel has one book over 20k, and another seven books that are over 10k.
#8 – HARPERCOLLINS
Back up to being #8 largest publisher with Western comics in BookScan Top 750 in 2017 is another of the “big five”: HarperCollins. Harper places sixteen books into the Top 750 for a total of 306k copies sold, and $4.8 million. There’s a lot of imprints with the word “Harper” in the title in the Long Tail (Harper, Harper Paperbacks, Harper Teen, Harper Festival, Harper Teen, and so on), and Harper is also Amistad, Blazer & Bray, IT books, William Morrow, and Zondervan.
Harper’s biggest hit is “DanTDM: Trayaurus and the Enchanted Crystal” by DanTDM, who is apparently a YouTuber? This comic is apparently based on Minecraft? This is not my thing, I’m over fifty! Either way, it racks up a very impressive 81k copies sold, making it a real world significant hit. They also do phenomenally with nearly 41k copies sold of “Everyone’s a Aliebn When UR a Aliebn Too”
At the Balzer & Bray imprint the big hit is “Invisible Emmie” by Terri Libenson, which debuts to an incredible 74k copies.
Noelle Stevenson’s “Nimona”, also continues its success, with almost 20k sold in its third year of release (it was 36k last year). Harper also publishes several of Lincoln Pierce’s “Big Nate” volumes (which, no your eyes are not tricking you, is published by two different publishing houses) – the best-selling one, “Triple Play” sells just under 16k. The perennial “Understanding Comics” moves a pretty steady 14k copies.
Nothing else is over 10k, so here is the Long Tail:
| Year | # of listed items | Percent Change | Total Unit Sold | Percent Change | Total $ Sold | Percent Change | Av. Sale per title | Av $ per title |
| 2007 | 18 | —— | 36,940 | —— | $600,540 | —– | 2052 | $33,363.33 |
| 2008 | 36 | 100.00% | 48,264 | 30.66% | $863,808 | 43.84% | 1341 | $23,994.67 |
| 2009 | 42 | 16.67% | 81,774 | 69.43% | $1,308,891 | 15.53% | 1947 | $31,164.07 |
| 2010 | 41 | -2.38% | 64,429 | -21.21% | $719,328 | -45.04% | 1571 | $17,544.59 |
| 2011 | 50 | 21.95% | 75,394 | 17.02% | $1,083,609 | 50.64% | 1508 | $21,672.18 |
| 2012 | 80 | 60.00% | 159,573 | 111.65% | $2,113,744 | 95.07% | 1995 | $26,421.80 |
| 2013 | 68 | -15.00% | 197,595 | 23.83% | $2,667,933 | 26.22% | 2906 | $39,234.31 |
| 2014 | 115 | 69.12% | 158,193 | -19.94% | $2,398,836 | -10.09% | 1376 | $21,042.42 |
| 2015* | 109 | -5.22% | 188,181 | 18.96% | $2,646,378 | 10.32% | 1726 | $24,278.70 |
| 2016* | 108 | -0.09% | 261,183 | 38.79% | $4,473,589 | 69.05% | 2418 | $41,422.12 |
| 2017 | 107 | -0.09% | 357,972 | 37.06% | $5,530,994 | 23.64% | 3346 | $51,691.53 |
Harper has two books over 50k, another book over 20k, and four more over 10k.
#9 HOLTZBRINK
Reaching the top ten for the first time ever, at #9, is Holtzbrinck, which owns Macmillan, is also one of those publishers with lots and lots (and lots) of imprints: FirstSecond, Henry Holt, Hill + Wang, and Square Fish are the only four to make the Top 750, but there are others down into the Long Tail as well – I have also identified Farrar Straus Giroux, Metropolitan, Picador, Roaring Brook, Rodale Press, St. Martins Griffin, Times books, and Tor. Holtzbrinck also distributes several other publishers they don’t own, including Bloomsbury, Drawn & Quarterly, Papercutz, and Seven Seas. Holtzbrinck-owned companies placed eighteen titles in the Top 750, for about 262k and about $3.5m combined.
By imprint, the best-seller here from FirstSecond is Shannon Hale and LeUyen Pham’s “Real Friends”, which just rocks with a devastating 94k copies sold in its debut year. They also succeed with just over 11k copies of Ben Hatke’s “Zita the Spacegirl”.
Square Fish’s top title continues to be Gene Yang’s “American Born Chinese” (almost 34k), followed by Hope Larson’s Adaptation of “A Wrinkle In Time”, which surges in advance of the film to almost 33k copies sold (it was about 15k last year)
Henry Holt is the imprint that has 6k copies of Victoria Jamieson’s “The Great Pet Escape”, while Hill & Wang’s best-seller is just under 4200 copies of the adaptation of “Fahrenheit 451”
Here’s Holtzbrinck’s Long Tail (again, I might have missed an imprint somewhere – trying to tease them all out is a difficult task from their Byzantine org chart).
| Year | # of listed items | Percent Change | Total Unit Sold | Percent Change | Total $ Sold | Percent Change | Av. Sale per title | Av $ per title |
| 2007 | 39 | —— | 31,452 | —— | $559,681 | —– | 806 | $14,350.79 |
| 2008 | 66 | 69.23% | 63,473 | 101.81% | $1,132,767 | 102.40% | 962 | $17,163.14 |
| 2009 | 88 | 33.34% | 84,090 | 32.48% | $1,438,044 | 26.95% | 956 | $16,341.41 |
| 2010 | 108 | 22.73% | 68,599 | -18.42% | $1,085,311 | -24.53% | 635 | $10,049.18 |
| 2011 | 139 | 28.70% | 114,243 | 66.54% | $1,794,084 | 65.31% | 822 | $12,907.08 |
| 2012 | 165 | 18.71% | 126,745 | 10.94% | $2,077,143 | 15.78% | 768 | $12,588.75 |
| 2013 | 187 | 13.33% | 142,375 | 12.33% | $2,395,569 | 15.33% | 761 | $12,810.53 |
| 2014 | 222 | 18.72% | 190,682 | 33.93% | $3,096,858 | 23.27% | 859 | $13,949.81 |
| 2015* | 104 | -53.15% | 99,223 | -47.96% | $1,804,001 | -41.75% | 954 | $17,346.16 |
| 2016* | 272 | 161.54% | 272,668 | 174.80% | $4,240,075 | 135.04% | 1,002 | $15,588.51 |
| 2017 | 336 | 23.53% | 437,258 | 60.36% | $6.616,130 | 56.04% | 1,301 | $19,690.86 |
Holtzbrinck has one book over 50k, two more over 20k, and just one other over 10k.
#10 ABRAMS
Rounding out the 10 largest publishers according to the BookScan Top 750 for 2017 is Henry N. Abrams at #10, who place 16 titles, for 209k and $2.8m in sales.
They publish as Abrams Comicarts, Henry N. Abrams, as well as Amulet Books. They’re not considered one of the “Big Five”, but they’re not a traditional Direct Market publisher either.
As an Abrams branded imprint, their best-selling book is “El Deafo” which does fantastic at 66k. The next best seller is the adaptation of Octavia Butler’s “Kindred” at almost 11k
As Amulet, they score biggest with “Nathan Hale’s Hazardous Tales”, where seven books hit the chart – the largest is “The Raid of No Return” which launches with 18k sold. Three other Hale volumes sell over 10k as well. Amulet also places 11k of the first volume of “Spongebob Comics”
As Abrams Comicsarts, their best-seller is “My Friend Dahmer” (which had a 2017 film adaptation) – selling nearly 10k copies.
Here is your long-tail:
| Year | # of listed items | Percent Change | Total Unit Sold | Percent Change | Total $ Sold | Percent Change | Av. Sale per title | Av $ per title |
| 2008 | 3 | —— | 10,031 | —— | $148,675 | —— | 3,344 | $49,558.33 |
| 2009 | 25 | 733.33% | 24,116 | 140.41% | $640,635 | 330.90% | 965 | $25,625.40 |
| 2010 | 41 | 64.00% | 48,240 | 100.03% | $1,109,444 | 73.18% | 1,177 | $27,059.61 |
| 2011 | 49 | 19.51% | 31,846 | -33.98% | $731,054 | -34.11% | 650 | $14,919.47 |
| 2012 | 62 | 26.53% | 37,522 | 17.82% | $756,650 | 3.50% | 605 | $12,204.03 |
| 2013 | 70 | 12.90% | 72,538 | 93.32% | $3,278,063 | 333.23% | 1,036 | $46,829.47 |
| 2014 | 88 | 25.71% | 74,083 | 2.13% | $2,324,820 | -29.10% | 842 | $26,418.41 |
| 2015* | 92 | 4.55% | 145,633 | 96.58% | $1,898,267 | -18.35% | 1,583 | $20,633.34 |
| 2016* | 112 | 21.74% | 177,127 | 21.63% | $2,326,956 | 22.58% | 1,581 | $20,776,39 |
| 2017 | 124 | 10.71% | 248,580 | 40.34% | $3,449,807 | 48.25% | 2,005 | $27,821.02 |
Henry N. Abrams has one book over 50k, and six more over 10k.
Obviously, there are more than 10 publishers, and we’ve spent a lot of time gathering data about many of them over the years. There are several other publishers that I’d like to call out here.
Let’s start with the last of the “Big Five” in the mainstream book publishing world: Hachette, which includes the imprints of Black Dog & Leventhal, JY, Little, Brown, Grand Central, Nation Books, Running Press, and Yen. In the Top 750 among western publishers, together they place ten books, selling 171k copies and $2.2m. Yen also has a lot of manga up above in the previous section. If you added them together, it would be about 336k, and $4.8m
JY is the strongest imprint in the comics realm, being home to Svetlana Chmakova’s “Awkward” (69k) and “Brave” (51k)
Little, Brown places five books into the Top 750, “Catstronauts: Mission Moon: is their best-seller at nearly 13k. They also sell 4727 copies of the first 3-in-one edition of Herge’s “Tintin”, which is disturbingly low for one of the classic masters of the medium, if you ask me.
None of their other imprints manage to score any titles at 10k or over.
Here’s the Long Tail of just the Western books for Hachette. It’s going to jump a bit because we now add Perseus publishers (which they purchased in 2016) Basic Books, Public Affairs, and Running Press:
| Year | # of listed items | Percent Change | Total Unit Sold | Percent Change | Total $ Sold | Percent Change | Av. Sale per title | Av $ per title |
| 2007 | 15 | —— | 39,181 | —— | $689,383 | —— | 2,612 | $45,958.87 |
| 2008 | 18 | 20.00% | 37,519 | -4.24% | $596,609 | -13.46% | 2,084 | $33,144.94 |
| 2009 | 18 | —— | 40,172 | 7.07% | $642,935 | 7.76% | 2,232 | $35,718.61 |
| 2010 | 19 | 5.56% | 160,992 | 300.76% | $3,097,996 | 381.85% | 8,473 | $163,052.42 |
| 2011 | 24 | 26.32% | 88,131 | -45.26 | $1,273,500 | -58.89% | 3,672 | $53,063.01 |
| 2012 | 28 | 16.67% | 110,897 | 25.83% | $1,565,744 | 22.95% | 3,961 | $55,919.43 |
| 2013 | 24 | -14.29% | 39,093 | -65.75% | $584,783 | -62.65% | 1,629 | $24,365.96 |
| 2014 | 32 | 33.33% | 38,853 | -0.61% | $593,667 | 1.52% | 1,214 | $18,552.10 |
| 2015* | 30 | -0.63% | 61,539 | 58.39% | $830,047 | 39.82% | 2,051 | $27,668.23 |
| 2016* | 56 | 86.67% | 81,648 | 32.68% | $1,654,511 | 99.33% | 1,458 | $29,544.84 |
| 2017 | 78 | 39.29% | 220,591 | 170.17% | $2,998,501 | 81.23% | 2,828 | $38,442.32 |
And if you add the Manga from Yen, the combined total looks like this:
| Year | # of listed items | Percent Change | Total Unit Sold | Percent Change | Total $ Sold | Percent Change | Av. Sale per title | Av $ per title |
| 2007 | 25 | —— | 52,077 | —— | $836,832 | —– | 2,083 | $33,473.28 |
| 2008 | 108 | 332.00% | 147,645 | 183.51% | $1,834,469 | 119.22% | 1,367 | $16,985.82 |
| 2009 | 229 | 112.04% | 371,134 | 151.37% | $4,340,048 | 132.78% | 1,621 | $18,952.17 |
| 2010 | 363 | 58.52% | 721,975 | 94.53% | $9,748,867 | 124.63% | 1,999 | $26,856.38 |
| 2011 | 484 | 33.33% | 852,256 | 18.05% | $11,227,466 | 15.17% | 1,761 | $23,197.24 |
| 2012 | 576 | 19.01% | 758,845 | -10.96% | $10,301,009 | -8.25% | 1,317 | $17,883.70 |
| 2013 | 678 | 17.71% | 731,473 | -3.61% | $10,300,204 | —– | 1,079 | $15,192.04 |
| 2014 | 808 | 19.17% | 720,988 | -1.43% | $10,579,169 | 2.71% | 892 | $13,093.03 |
| 2015* | 742 | -8.17% | 994,407 | 37.92% | $14,304,955 | 35.22% | 1,340 | $19,278.92 |
| 2016* | 849 | 14.42% | 1,153,656 | 16.01% | $17,174,718 | 20.06% | 1,359 | $20,229.35 |
| 2017 | 1481 | 74.44% | 1,199,553 | 3.98% | $16,865,176 | -1.80% | 810 | $11,387.69 |
Hachette has two titles over 50k, and one other over 10k, on the Western charts.
While not one of the “Big Five”, there are other publishers that I would consider both “significant” as well as bookmarket-first who did well in the Top 750. In straight alphabetical: Houghton Mifflin Harcourt (2 titles), and Hyperion/Disney Press (7), Joe Books (8), and Skyhorse (7)
Houghton Mifflin Harcourt publishes comics both as HMH and Mariner. They place two titles into the Top 750 that total about 33k
The best-seller is Alison Bechdel’s “Fun Home” which which does 32k They also place 5661 copies of Bechdel’s “Are You My Mother?” into the Top 750.
The Long Tail:
| Year | # of listed items | Percent Change | Total Unit Sold | Percent Change | Total $ Sold | Percent Change | Av. Sale per title | Av $ per title |
| 2007 | 4 | —— | 20,474 | —— | $434,495 | —— | 5119 | $108,623.75 |
| 2008 | 6 | 50.00% | 14,183 | -30.73% | $307,019 | -29.34% | 2363 | $51,169.83 |
| 2009 | 14 | 133.33% | 24,568 | 73.22% | $436,328 | 42.12% | 1755 | $31,166.29 |
| 2010 | 17 | 21.43% | 29,163 | 18.70% | $532,539 | 22.05% | 1715 | $31,325.82 |
| 2011 | 18 | 5.88% | 24,239 | -16.88% | $450,536 | -15.40% | 1347 | $25,029.78 |
| 2012 | 21 | 16.67% | 23,562 | -2.79% | $402,575 | -10.65% | 1122 | $1,9170.24 |
| 2013 | 29 | 38.10% | 44,558 | 89.11% | $687,920 | 70.88% | 1536 | $23,721.38 |
| 2014 | 27 | -6.90% | 32,751 | -26.50% | $552,884 | -19.63% | 1213 | $20,477.19 |
| 2015* | 33 | 22.22% | 78,357 | 239.25% | $1,214,786 | 219.72% | 2374 | $36,811.70 |
| 2016* | 38 | 15.15% | 60,359 | -22.97% | $943,188 | 22.36% | 1588 | $24,820.74 |
| 2017 | 27 | -28.95% | 42,963 | 28.82% | $710,481 | -24.67% | 1591 | $26,314.11 |
Houghton Mifflin Harcourt has just the one book over 20k.
Hyperion/Disney Press is, like Marvel, also owned by Disney. Technically, that probably means I should fold them together, but I resist, how I resist (largely because they are distributed separately). Hyperion has seven placing titles, doing 82k. The best-selling title is the kids-oriented adaptation of “Star Wars: The Original Trilogy” at 25k, though adaptations of Rick Riordan books also do well with a pair at about 14k.
| Year | # of listed items | Percent Change | Total Unit Sold | Percent Change | Total $ Sold | Percent Change | Av. Sale per title | Av $ per title |
| 2007 | 10 | —– | 39,121 | —– | $336,771 | —– | 3912 | $33,677.10 |
| 2008 | 19 | 90.00% | 41,005 | 4.82% | $409,051 | 21.46% | 2158 | $21,529.00 |
| 2009 | 24 | 26.32% | 23,301 | -43.18% | $234,078 | -42.78% | 971 | $9,753.25 |
| 2010 | 26 | 8.33% | 30,860 | 32.44% | $314,067 | 34.17% | 1187 | $12,079.50 |
| 2011 | 29 | 11.54% | 46,553 | 50.85% | $392,652 | 25.02% | 1605 | $13,539.72 |
| 2012 | 31 | 6.90% | 33,105 | -28.89% | $376,735 | -4.05% | 1068 | $12,152.74 |
| 2013 | 33 | 6.45% | 102,537 | 209.73% | $1,298,672 | 244.72% | 3107 | $39,353.70 |
| 2014 | 38 | 15.15% | 77,045 | -24.86% | $1,015,188 | -21.83% | 2028 | $26,715.49 |
| 2015* | 57 | 50.00% | 63,290 | -17.85% | $831,477 | -18.10% | 1110 | $14,587.32 |
| 2016* | 36 | -36.84% | 61,730 | -2.46% | $926,504 | 11.43% | 1715 | $25,736.22 |
| 2017 | 41 | 13.89% | 99,589 | 61.33% | $1,592,970 | 71.93% | 2429 | $38,852.93 |
Hyperion has one book over 20k, and another two books over 10k.
Joe Books mostly just do screen-cap fumetti (Or as they call them, “cinestory”). But their screen-caps of “Disney Descendants: Wicked World” are on top, with the new release of v3 launching over 17k. v1 does about 15k, and v2 does 11k and v4 sells 13k. The also do solidly with the “Trolls” adaptation, at about 15k. All together, Joe Books placed eight titles in the Top 750 for 86k
They’re a newer company, so the history of their long tail is fairly short:
| Year | # of listed items | Percent Change | Total Unit Sold | Percent Change | Total $ Sold | Percent Change | Av. Sale per title | Av $ per title |
| 2014 | 1 | — | 22,740 | — | $340,873 | — | 22,740 | $340,873.00 |
| 2015* | 13 | 1200.00% | 66,375 | 291.88% | $1,047,511 | 307.30% | 5,106 | $80,577,77 |
| 2016* | 43 | 230.77% | 139,487 | 110.15% | $1,661,338 | 58.60% | 3,244 | $38,635.77 |
| 2017 | 99 | 130.23% | 135,130 | -3.12% | $1,610,875 | -3.04% | 1,365 | $16,271.46 |
Joe Books has two titles over 20k, and three more over 10k.
Skyhorse (placing seven books for almost 75k total) is a new publisher here in the section of “they publish enough for a full write up” – and they make it here largely on the strength of screencap fumetti comics taken from “Minecraft” published in their Sky Pony imprint. All of these comics are “unofficial”, however, as they’re not licensing the Minecraft brand or engine to do so. The best-seller, “The Battle for the Dragon’s Teeth” sells nearly 21k copies, and they have three more that all sell over 10k. That’s impressive, but I don’t really have anything else to say.
I guess I have to build them a Long Tail, however. This one looks a little silly!
| Year | # of listed items | Percent Change | Total Unit Sold | Percent Change | Total $ Sold | Percent Change | Av. Sale per title | Av $ per title |
| 2012 | 2 | — | 180 | — | $2,331 | — | 90 | $1,165.50 |
| 2013 | 4 | 100.00% | 1,227 | 681.67% | $15,897 | 681.98% | 307 | $3,974.25 |
| 2014 | 4 | — | 458 | -62.67% | $6,191 | -61.06 | 115 | $1,547.75 |
| 2015* | 5 | 25.00% | 14,011 | 3059.17% | $168,332 | 2718.98% | 2,802 | $33,666.40 |
| 2016* | 6 | 20.00% | 51,833 | 369.95% | $622,000 | 369.51% | 8,639 | $103,666.67 |
| 2017 | 26 | 433.33% | 81,366 | 56.98% | $1,144,071 | 83.93% | 3,129 | $44,002.73 |
Skyhorse has one book over 20k, and three more over 10k.
Outside of those bookstore-native publishers, we’ve got several Direct Market-native publishers who placed more than three titles into the Top 750. Those would be: Dark Horse (20 titles placing), Boom (8), IDW (7), Oni (7), Archie (3), and Drawn & Quarterly (2)
This is the first year in the history of doing this survey that Dark Horse Comics has been out of the Top 10 (they were #8 last year) but they’re the strongest pub here in the “other” section, as they place 20 titles for 187k.
Dark Horse’s #1 book of the year, for the third year running, is a “Plants Vs. Zombies” title. This year it is “Boom Boom Mushroom”, which sells about 22k (down from almost 29k copies last year). There are nine other volumes of “PvZ”, on the Top 750 BookScan this year. Together they sell 110k combined – more than half of Dark Horse’s placement – and $1.1m in sales.
Dark Horse’s other big success in 2017 is the first volume of “The Legend of Korra”, “Turf Wars” which debuts to just over 19k copies. Dark Horse also continues to do well with comics based on “Avatar: The Last Airbender” which has five volumes place for just over 40k, total.
Nothing else over 10k, though they squeak in Moebius’ “The World of Edena” at just a hair over 4k
Here’s what Dark Horse’s Western performance looks like in the Long Tail:
| Year | # of listed items | Percent Change | Total Unit Sold | Percent Change | Total $ Sold | Percent Change | Av. Sale per title | Av $ per title |
| 2007 | 597 | —— | 413,022 | —— | $7,607,264 | —– | 692 | $14,744.90 |
| 2008 | 734 | 22.95% | 552,815 | 33.85% | $9,329,828 | 22.64% | 753 | $12,710.94 |
| 2009 | 798 | 8.72% | 455,924 | -17.53% | $7,757,240 | -16.86% | 571 | $9,720.85 |
| 2010 | 955 | 19.67% | 445,248 | -2.34% | $7,852,063 | 1.22% | 466 | $8,222.06 |
| 2011 | 1025 | 7.33% | 389,514 | -12.52% | $7,102,710 | -9.54% | 380 | $6,929.47 |
| 2012 | 1133 | 10.54% | 377,322 | -3.13% | $6,907,772 | -2.74% | 333 | $6,096.89 |
| 2013 | 1238 | 9.27% | 383,391 | 1.61% | $7,391,831 | 7.01% | 310 | $5,970.78 |
| 2014 | 1420 | 14.70% | 421,708 | 9.99% | $8,982,411 | 21.52% | 297 | $6,325.64 |
| 2015* | 947 | -33.31% | 376,231 | -10.78% | $8,120,937 | –9.59% | 397 | $8,575.44 |
| 2016* | 877 | -7.39% | 461,297 | 22.61% | $9,076,526 | 11.77% | 526 | $10,349.52 |
| 2017 | 1598 | 82.21% | 478,658 | 3.76% | $9,256,795 | 1.99% | 300 | $5,792.74 |
Despite the weakening front, in the Long Tail Dark Horse has its best year ever.
Dark Horse’s Manga offerings are up in that section. Dark Horse is one of the rare publishers that does a significant business in both Eastern and Western comics, and I’m sure they’d prefer all of their numbers to be represented together. In which case, their Long Tail actually looks like this:
| Year | # of listed items | Percent Change | Total Unit Sold | Percent Change | Total $ Sold | Percent Change | Av. Sale per title | Av $ per title |
| 2007 | 938 | —— | 662,965 | —— | $10,936,728 | —– | 707 | $11,659.62 |
| 2008 | 1075 | 14.61% | 801,796 | 20.94% | $12,506,698 | 14.36% | 746 | $11,634.14 |
| 2009 | 1253 | 16.56% | 682,421 | -14.89% | $10,672,933 | -14.66% | 545 | $8,517.90 |
| 2010 | 1428 | 13.97% | 639,742 | -6.25% | $10,485,140 | -1.76% | 448 | $7,342.54 |
| 2011 | 1522 | 6.58% | 578,843 | -9.52% | $9,704,940 | -7.44% | 380 | $6,376.44 |
| 2012 | 1626 | 6.83% | 489,695 | -15.40% | $8,538,810 | -12.02% | 301 | $5,251.42 |
| 2013 | 1759 | 8.18% | 486,929 | -0.56% | $9,070,394 | 6.23% | 277 | $5,156.56 |
| 2014 | 1979 | 12.51% | 522,602 | 7.33% | $10,599,661 | 16.86% | 264 | $5,356.07 |
| 2015* | 1250 | -36.84% | 511,675 | -2.09% | $10,359,104 | -2.27% | 409 | $8,287.28 |
| 2016* | 1102 | -11.84% | 635,595 | 24.22% | $11,367,881 | 9.74% | 577 | $10,315.68 |
| 2017 | 2125 | 92.83% | 716,747 | 12.77% | $20,624,676 | 81.43% | 337 | $9,705.73 |
Dark Horse has one title over 20k on the Western charts, and seven more over 10k.
Boom! Sells eight titles into the Top 750, for almost 54k, using the imprints Archaia, Boom, Boom Box, Boom Town, and Kaboom. Six of those placing titles are “Lumberjanes”, with v1 the strongest at 12k (19k in the previous year), and they also sell about 5k each of two volumes of “Mighty Morphin Power Rangers”
| Year | # of listed items | Percent Change | Total Unit Sold | Percent Change | Total $ Sold | Percent Change | Av. Sale per title | Av $ per title |
| 2007 | 21 | —– | 10,462 | —– | $246,984 | —— | 498 | $11,761.14 |
| 2008 | 44 | 109.52% | 10,943 | 4.60% | $394,361 | 59.67% | 249 | $8,962.75 |
| 2009 | 93 | 111.36% | 25,378 | 131.91% | $485,485 | 23.11% | 273 | $5,220.27 |
| 2010 | 202 | 117.20% | 64,770 | 155.22% | $1,140,019 | 134.82% | 321 | $5,643.66 |
| 2011 | 253 | 25.25% | 75,472 | 16.52% | $1,435,514 | 25.92% | 298 | $5,673.97 |
| 2012 | 307 | 21.34% | 59,758 | -20.82% | $1,160,894 | -19.13% | 195 | $3,781.41 |
| 2013 | 347 | 13.03% | 86,637 | 44.98% | $1,650,374 | 42.16% | 250 | $4,756.12 |
| 2014 | 388 | 11.82% | 108,504 | 25.24% | $1,894,658 | 14.80% | 280 | $4,883.14 |
| 2015* | 295 | -23.97% | 126,029 | 16.15% | $2,159,071 | 13.96% | 427 | $7,318.88 |
| 2016* | 309 | 4.75% | 134,386 | 6.63% | $2,313,502 | 7.15% | 435 | $7,487.06 |
| 2017 | 633 | 104.85% | 171,133 | 27.34% | $2,983,775 | 28.97% | 270 | $4,713.70 |
Boom! just has the one book over 10k.
They were #10 of the Western publishers in 2016, but they fell back down into the “other” section here in 2017: IDW Publishing who place seven books for a total of 171k sold. This is a stronger performance than the 158K last year, showing you that sometimes it’s about other people’s growth more than anything else.
Representative John Lewis’s “March” trilogy, his memoir about the civil rights struggle of the 1960s, is absolutely their biggest hit. Volume 1 sells 58k, v2 sells 20k, v3 27k, and the boxed set of the whole trilogy shifts 39k through BookScan reporters. Those are some excellent numbers.
IDW moved their bookstore distribution over to Penguin Random House (and away from Diamond Books) in 2017, joining DC and Dark Horse. This did not give them the immediate boost that one might hope for, as a string of double digit growth disappears
The next best-selling title is the benefit anthology “Love is Love” which sells a smidge over 16k.
A pair of “My Little Pony” books, an adaptation of the movie, and a prequel to the same make it on to the chart with 7100 for the former, and 5100 of the latter.
This is IDW’s Long Tail:
| Year | # of listed items | Percent Change | Total Unit Sold | Percent Change | Total $ Sold | Percent Change | Av. Sale per title | Av $ per title |
| 2007 | 233 | —— | 102,118 | —— | $2,090,647 | —– | 438 | $8,972.73 |
| 2008 | 335 | 43.78% | 146,125 | 43.09% | $2,766,505 | 32.33% | 436 | $8,258.22 |
| 2009 | 477 | 42.39% | 215,907 | 47.76% | $4,346,836 | 57.12% | 453 | $9,112.86 |
| 2010 | 623 | 30.61% | 161,578 | -25.16% | $3,653,680 | -15.95% | 259 | $5,864.65 |
| 2011 | 785 | 26.00% | 206,136 | 27.58% | $4,884,606 | 33.69% | 263 | $6,222,43 |
| 2012 | 937 | 19.36% | 162,599 | -21.12% | $4,329,973 | -11.35% | 174 | $4,621.10 |
| 2013 | 1059 | 13.02% | 180,694 | 11.13% | $4,443,372 | 2.62% | 171 | $4,195.82 |
| 2014 | 1134 | 7.08% | 228,895 | 26.68% | $5,309,992 | 19.50% | 200 | $4,641.40 |
| 2015* | 959 | -15.43% | 310,512 | 35.66% | $6,478,023 | 22.00% | 324 | $6,754.98 |
| 2016* | 978 | 1.98% | 343,197 | 10.53% | $8,194,098 | 26.49% | 351 | $8,378.42 |
| 2017 | 1639 | 67.59% | 346,368 | 0.92% | $8,278,617 | 1.03% | 211 | $5,051.02 |
IDW has one book over 50k, three more over 20k, and another one over 10k
Oni Press is our next publisher, with seven placing books for just a hair under 50k total. “Rick and Morty” is their biggest hit, with four of the seven placers being that, and v1 selling a bit over 13k. They also place three volumes of “Scott Pilgrim”, but the highest is down to 5700, down massively from its once mighty peak (Check out 2010 in the Long Tail)
Here’s Oni’s Long Tail
| Year | # of listed items | Percent Change | Total Unit Sold | Percent Change | Total $ Sold | Percent Change | Av. Sale per title | Av $ per title |
| 2007 | 125 | —— | 11,294 | —— | $141,829 | —– | 90 | $1,134.63 |
| 2008 | 138 | 10.40% | 21,843 | 93.40% | $320,799 | 126.19% | 158 | $2,324.63 |
| 2009 | 149 | 7.97% | 51,584 | 136.13% | $713,121 | 122.30% | 346 | $4,786.05 |
| 2010 | 156 | 4.70% | 446,791 | 866.14% | $5,882,247 | 824.86% | 2864 | $37,706.71 |
| 2011 | 177 | 13.46% | 162,275 | -63.68% | $2,786,438 | -52.63% | 917 | $15,742.59 |
| 2012 | 171 | -3.39% | 80,560 | -50.36% | $1,594,016 | -42.79% | 471 | $9,321.73 |
| 2013 | 195 | 14.04% | 68,140 | -15.42% | $1,401,748 | -12.06% | 349 | $7,188.45 |
| 2014 | 213 | 9.23% | 61,584 | -9.62% | $1,303,069 | -7.04% | 289 | $6,117.70 |
| 2015* | 165 | -22.54% | 65,254 | 5.96% | $1,478,997 | 11.35% | 395 | $8,963.62 |
| 2016* | 191 | 15.76% | 90,222 | 38.26% | $1,992,643 | 34.73% | 472 | $10,432.69 |
| 2017 | 283 | 48.17% | 117,950 | 30.73% | $2,847,629 | 42.91% | 417 | $10,062.29 |
Oni has one book over 10k.
Archie Comics places a three books in the Top 750, selling 16k copies. Two of the three are the Mark Waid-led Archie “reboot”, where v1 moves 6935 copies. There’s also “Road to Riverdale”, a lead-in to the show, which sells under 5k. The TV show does not appear to have moved the needle massively here.
Here’s Archie’s Long Tail:
| Year | # of listed items | Percent Change | Total Unit Sold | Percent Change | Total $ Sold | Percent Change | Av. Sale per title | Av $ per title |
| 2007 | 18 | —— | 12,443 | —— | $103,998 | —– | 691 | $5,777.67 |
| 2008 | 26 | 44.44% | 25,046 | 101.29% | $220,207 | 111.74% | 963 | $8,469.50 |
| 2009 | 33 | 26.92% | 26,998 | 7.79% | $246,557 | 11.97% | 818 | $7,471.42 |
| 2010 | 43 | 30.30% | 24,828 | -8.04% | $227,014 | -7.93% | 577 | $5,279.40 |
| 2011 | 62 | 44.19% | 51,551 | 107.63% | $528,353 | 132.74% | 831 | $8,521.82 |
| 2012 | 85 | 37.10% | 66,988 | 29.95% | $797,165 | 50.88% | 788 | $9,378.41 |
| 2013 | 110 | 29.41% | 79,978 | 19.39% | $974,889 | 22.29% | 727 | $8,862.63 |
| 2014 | 148 | 34.55% | 92,953 | 16.22% | $1,170,486 | 20.06% | 628 | $7,908.69 |
| 2015* | 165 | 11.49% | 75,222 | -19.08% | $892,756 | -23.73% | 456 | $5,410.64 |
| 2016* | 163 | -1.21% | 56,241 | -25.23% | $730,252 | -18.20% | 345 | $4,480.07 |
| 2017 | 156 | -4.29% | 72,574 | 29.04% | $1,102,457 | 50.97% | 465 | $7,067.03 |
Archie has no books over 10k
Drawn & Quarterly places two books into the Top 750, for about 9300 copies. I wouldn’t even mention them except that I already built a Long Tail chart, and who wants to throw away research work like that? D&Q’s best-seller is Craig Thompson’s “Blankets” (5036) with R. Sikoryak’s “The Unquotable Trump” selling about 4233. I suspect the latter would have been much higher if it didn’t go out-of-print almost immediately upon release.
| Year | # of listed items | Percent Change | Total Unit Sold | Percent Change | Total $ Sold | Percent Change | Av. Sale per title | Av $ per title |
| 2007 | 62 | — | 24,689 | — | $500,764 | — | 398 | $8,076.84 |
| 2008 | 82 | 32.26% | 42,038 | 70.27% | $912,774 | 82.28% | 513 | $11,131.39 |
| 2009 | 107 | 30.49% | 42,957 | 2.19% | $920,014 | 0.79% | 401 | $8,598.26 |
| 2010 | 126 | 17.76% | 44,737 | 4.14% | $1,009,387 | 9.71% | 355 | $8,011.01 |
| 2011 | 145 | 15.08% | 62,286 | 39.23% | $1,399,793 | 38.68% | 430 | $9,653.74 |
| 2012 | 155 | 6.90% | 43,098 | -30.81% | $926,233 | -33.83% | 278 | $5,975.70 |
| 2013 | 189 | 21.94% | 41,887 | -2.81% | $893,905 | 3.49% | 222 | $4,729.66 |
| 2014 | 205 | 8.47% | 46,030 | 9.90% | $1,032,032 | 15.45% | 225 | $5,034.30 |
| 2015* | 219 | 6.83% | 73,471 | 59.62% | $1,680,878 | 62.87% | 335 | $7,675.24 |
| 2016* | 233 | 6.39% | 57,326 | -21.97% | $1,266,170 | -24.67% | 246 | $5,434.21 |
| 2017 | 247 | 6.01% | 68,087 | 18.77% | $1,548,813 | 22.32% | 276 | $6,270.50 |
Drawn & Quarterly has no books over 10k.
No publisher that has not been mentioned placed more than three titles within the Top 750, which leaves me with twenty-two more books from nineteen different publishers. This is the most number of different publishers in the Top 750 we’ve ever had, by the way.
There are three titles in this cohort that shift over 20k. The strongest one is Emil Ferris’ “My Favorite Thing Is Monsters” from Fantagraphics, which impressively sells almost 31k copies. Next is Roz Chast’s “Going Into Town: A Love Letter to New York” from Bloomsbury UK that does 25k. And the third is “Wires and Nerve” by Marissa Meyer and Douglas Holgate from Feiwel & Friends that does almost 22k.
There are two books that sell over 10k. The first is “Timmy Failure: Mistakes Were Made” by Stephan Pastis, with 18k sold from Candlewick. There are also two other “Timmy Failure” books charting (at about 7k and 6k) – if this remains true next year, we might need to set up a Long Tail listing for Candlewick. Finally, in the wake of the Luc Besson film, the first omnibus of “Valerian” comes in at 10,334 sold from Cinebook.
After that, none of the remaining books sell 10k, so they don’t get individual write ups (I’m tired! This is over 19k words already!)
A few final bits of number-crunching for fun before we go for the year!
First and foremost: I’m sure you noticed that one of the columns on the BookScan chart is listed as “publishers”. I’ve never been able to understand why: that column is clearly the distributor column, with the (very very) weird exception of DC Comics. DC (and Dark Horse, and IDW, and others) are distributed by Random House in the bookstore market, not Diamond. Marvel is distributed by Hachette. Boom! is distributed by Simon, and so on. Now most analysis that I do I get fairly rigorous about going in and fixing problems, but this is a simple search (with the exception of combining “Random House” and “Random House Inc” [rassen-frassen] into one, and fixing DC), then where is the money going for distribution?
Turns out it looks like this in 2017:
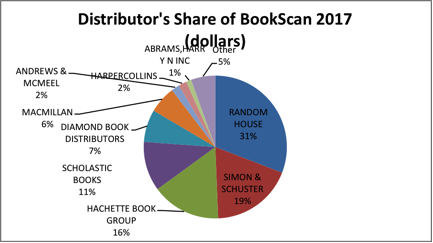
Not what you pictured in your head, was it? This chart is one of the reasons why it is hard to call Diamond a true “monopoly”.
Lastly: if we look at the entirety of the 35k-long “Long Tail” BookScan list, how do the publishers stack up in 2017? We’ll consider it in dollars this time, including both “east” and “west” comics, and round everything to the nearest hundred-thousand just for ease of presentation – DC is the #1 publisher, but Viz is now within striking distance (about $800,000 is all that separates them), and Scholastic is tearing up the inside track.
#1 DC $42.9 Million
#2 Viz $42.1
#3 Scholastic $33.9
#4 Marvel $28.2
#5 Image $18.6
#6 Hachette $16.9
#7 Kodansha $13.6
#8 Dark Horse $13.1
#9 Penguin Random House $10.5
#10 Seven Seas $8.5
Or, if you’d prefer a visual chart?
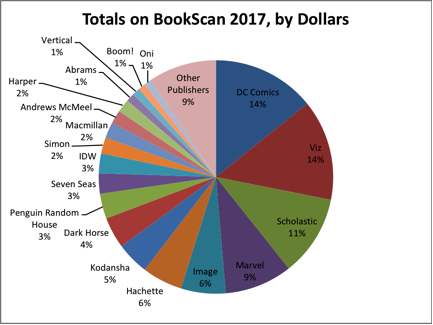
And that’s pretty much what BookScan in 2017 looks like to these eyes.
How does it look to you?
**************************
Brian Hibbs has owned and operated Comix Experience in San Francisco since 1989, was a founding member of the Board of Directors of ComicsPRO, has sat on the Board of the Comic Book Legal Defense Fund, and has been an Eisner Award judge. Feel free to e-mail him with any comments. You can purchase two collections of the first Tilting at Windmills (originally serialized in Comics Retailer magazine) published by IDW Publishing, as well as find an archive of pre-CBR installments right here. Brian is also available to consult for your publishing or retailing program.


BookScan costs an independent bookstore anywhere between IRRC fifteen hundred and three thousand dollars a year to get their reports. I believe they only collect sales data from those who are paying this fee. Many indie bookstores, many of which do sell a healthy number of GNs, report to other data collectors who not charge them, i.e. the New York Times.
It’s like trying to estimate how well a CD sells if all you’ve got is data for Target, Walmart and selected smaller sellers. Both the CD and a GN now exist as both physical things like the second Umbrella Academy GN I picked up this week and digital things, both as solo units and, in the cas of zmarvel and Comixology, as streams.
Due to severe head trauma suffered last autumn from falling way too far down stairs, I lost my ability to track narrative as my short term memory has an outside limit of about twenty minutes before I forget what I watching or reading. No novels of films now, but GNs and short things such as the JLA animated series is fine. So do my reading of GNs on. Comixology count towards sales? I suspect even though it’s a revenue stream.
Thanks for this, it’s really helpful!
I really wish there was a way we could learn Scholastic’s sales numbers, like at book fairs. I keep hearing how Marvel books like Squirrel Girl, Moon Girl, and Ms Marvel, sell incredibly well at fairs. As well they should. They’re all amazing books. But I’m constantly curious on how well they sell in terms of numbers.
@Cat: ” I believe they only collect sales data from those who are paying this fee. ”
I have never heard this, and doesn’t really make any sense — sales data is valuable to retailers, who would give it to a third party if they had to PAY to do so?
To the best of my knowledge this is categorically false.
Now, BookScan *is* super expensive for a sub — I sure have never been able to buy one, which is why its so revolutionary that The NPD group is now sharing the data freely with us all.
-B
@Cat: ” I believe they only collect sales data from those who are paying this fee. ”
Yeah not true. You have to pay to SEE the data.
The link called “Follow this link for a list of BISAC” codes goes to an error code and an not active page.
Great analysis as usual. Lots of hard work too. Thank you.
It appears that Bookscan says it tracks 80-85% of print sales in 2017. From a Jan 2018 article in Publishers Weekly: https://www.publishersweekly.com/pw/by-topic/industry-news/bookselling/article/75760-print-sales-up-again-in-2017.html
Any chance that some of us can get the entire data list? I’m more interested in specific smaller publisher titles numbers than I am comparing the entire market.
Sorry for the typo in my previous reply.
If anyone is interested, I did a comparison of the DC Rebirth collection sales between the Diamond-NA reported sales and the BookScan reported sales: http://yetanothercomicsblog.blogspot.com/2018/03/dc-rebirth-collection-sales-2017.html
Disney’s Law of the Vault:
There is a new audience every seven years. (Discovered by accident during World War II, when Disney had lost most of their overseas revenue, and much of production was centered on war films. Disney released Snow White to generate revenue.)
Originally, the movies were released periodically in theaters because of this new audience.
(Snow White: 1937, 1944, 1952, 1958, 1967, 1975, 1983, 1987 and 1993.)
(Grr…)
Now, Disney releases them via media, locking them away after a year of sales.
VHS, laserdisc, DVD, Blu-Ray, now 4K UHD.
For kids books, that market is eternal, as long as the books age well.
For example, the bestselling graphic novel in the U.S., The Monster at the End of This Book: Starring Lovable, Furry Old Grover, has been in print since 1971, and is available in a variety of bindings and even other media.
If a book is popular in a library, then it eventually gets worn and replaced. As new schools are built, new libraries get stocked.
As kids age, nostalgia kicks in, and they buy the books for other children.
RE: Andrews McMeel
The BISAC codes are: http://bisg.org/page/Humor
HUM001000 HUMOR / Form / Comic Strips & Cartoons
So, if you want to recrunch those numbers… Or do an appendix… (removing your appendix might be easier, and less frustrating.)
@Nick: Why do you assume Marvel isn’t lying about book fair and library sales the way they lie about absolutely everything else? I remember when they said Ms Marvel was far and away their best-selling digital title in single issues, then Comixology started ranking their top sellers and Ms Marvel was okayish at best. Meanwhile Marvel has a well-documented history in recent years of overshipping titles and counting these as “sales”. Why would they not be lying about library and book fair sales, simply because the public doesn’t have access to them? All they do is lie to make themselves feel better.
Brevoort tried to tell us that 2017 was Marvel Comics’ second most profitable year ever (specifically for the comics division). And yet Marvel’s direct market sales were down, and here we see that their Book Scan numbers declined by 10% as well, despite listing nearly twice as many items. I’d love it if Marvel was actually reaching new, younger readers through libraries and book fairs. But I’m connected to both industries and I’ve seen no evidence of this, nor heard any anecdotes of it. About 1/4th of the libraries I’m connected with have a collection or two of Moon Girl. That kind of footprint is entirely in line with other Marvel titles over the past decade, and it’s absolutely dwarfed by Manga titles, which are everywhere. I’d love to believe otherwise, but at this point Marvel has lied too many times about too many things for me to believe them.
Listening to comics “fans” ranting about Marvel is like listening to Trump voters ranting about Hillary on talk radio. Both are living in an alternative reality, with “alternative facts.”
Hi Brian! I copied the Top 750 chart onto a google doc and the total for My Hero Academia series is 176k! I just filtered by Author and selected Horikoshi Kohei to get it. https://docs.google.com/spreadsheets/d/1CMoCeO94WAfENbnwB6gj_d3H6ZwlbbJNBDvveuiMcVA/edit?usp=sharing
Thank you so much for this!! This is an amazing undertaking and super appreciated!
The Bloody Crown of Conan shows up on the list because the BISAC says it is a Graphic Novel.
Comments are closed.