

By Brian Hibbs
“There are three kinds of lies: Lies, Damned Lies, and Statistics”
Incomprehensibly, this is the eighteenth annual report of something that is hard to exactly perceive and understand: the size and shape of the sales of graphic novels and trade paperbacks through the book store market, as seen through the prism of NPD BookScan.
I want to profusely apologize for just how late this year’s report is – it is entirely and wholly on me. 2021 has been a rough year, but I can see the sun shining through now that health and business issues have started to resolve for me.
There is a tremendous amount that goes into making these reports, and a whole lot of detail of how these lists get generated, but my wise editor believes that most folks just want to get to the numbers. So, if you are interested in how the sausage gets made, please go down to the bottom of the column for lots of lots of § in-depth details. And you can see the Top 750 with sales figures redacted here.
I will summarize a few things here: all sales reported here are generated by The NPD Group, which runs NPD BookScan. These reflect actual sales made through bookstores that report to NPD BookScan, including Amazon. NPD believes that some 80% or more of book sales are captured by them – so even best-case scenario, these are a little light. They also only include very few comic book specialty stores (whose purchases can be found in the excellent reports by John Jackson Miller’s Comichron)
But these are book sold through the venues that report to NPD BookScan only – it certainly doesn’t include sources of sales like, for example, school library purchases, or direct-to-consumer sales through things like the Scholastic book fairs. In some cases, those numbers could be many multiples of the retail trade. I certainly expect that something as broadly popular as “Dog Man” (the #1 book in 2020) is selling at least twice as many copies (and maybe much much more!) through academic channels. However, this is beyond the scope of this survey.
This also only includes physical books sold! No digital of any kind.
Also to top-level note: I am myself a Direct Market (comic book store) retailer – while my individual focus is on book-format material, I have a lot of biases, both visible and invisible that I bring to these reports. Please bear these in mind as you read my analysis!
I have historically divided the data between the “Top 750” because a) that’s all the data I was initially leaked back in 2003, b) it’s a “manageable” chunk of data, and c) “as above, so below” – the top 750 represents about half of sales. However, since 2007, I’ve received the “entire” database, which now gives us a solid fifteen years of data to track. I refer to this as “the Long Tail”. This year’s “Long Tail” has more than 44k items! That’s a lot! And a whole lot of those books are selling copies that don’t even add up to one hundred copies sold in a year.
I also do a rough calculation of multiplying the number of copies sold (a firm number) against the cover price, giving a calculation of what retail dollar sales would be. However, this is not actually a real number, because a significant percentage of these books sold for less than cover price (thanks Amazon!)
The main thing that I have to do once I receive the report from NPD BookScan is to edit the data I am sent, removing all of the things that are not comics. I literally hand-checked thousands of items against Amazon’s “Look Inside” feature” to say “is this a comic or not?” I defined “comics” like this: either a) it has multiple panels sequentially producing a narrative (those don’t have to be on ONE PAGE, so someone like Mo Williams is certainly comics) OR b) a single image that, taken entirely by itself, provides a complete thought. So, “The Far Side” is comics, but, no, “Diary of a Wimpy Kid” is NOT (but very glad to see that number as a comparative)
Using my working definitions, starting in 2018 I decided to cut some items that had previously been kept in: chief among best-sellers would be Rachel Renee Russell’s “Dork Diaries” – they have words, they have pictures, but they don’t work together in the way I’d think we’d commonly agree is “comics”. I also removed prose-driven books like DK Publishing’s “Marvel Encyclopedia”, which, while nominally about comics or comics culture, is factually an encyclopedic prose book with pictures. Or “Wonder Woman: Warbringer” which is a straight-up prose novel that happens to feature a comics character, or “DC Super Heroes: My First Book of Girl Power” where the Amazon “Look Inside” clearly shows is an illustrated reader for 2nd graders. There is clearly an enormous market for this kind of material – in fact, in many cases a larger market than for the actual comics themselves – it just isn’t the “comics” market, as I would define it.
Here’s the big picture for just the Top 750 in 2020:
| Year | Total Unit | Growth | Calculated Retail Value | Growth |
| 2003 | 5,495,584 | ——- | $66,729,053 | ——– |
| 2004 | 6,071,123 | 10.5% | $67,783,487 | 1.6% |
| 2005 | 7,007,345 | 15.4% | $75,459,669 | 11.3% |
| 2006 | 8,395,195 | 19.8% | $90,411,902 | 19.8% |
| 2007 | 8,584,317 | 2.3% | $95,174,425 | 5.3% |
| 2008 | 8,334,276 | -2.9% | $101,361,173 | 6.5% |
| 2009 | 7,634,453 | -8.4% | $93,216,014 | -8.0% |
| 2010 | 6,414,336 | -15.9% | $85,266,166 | -8.5% |
| 2011 | 5,696,163 | -11.2% | $79,961,951 | -6.2% |
| 2012 | 5,438,329 | -4.53% | $89,918,354 | 12.45% |
| 2013 | 5,654,351 | 3.97% | $96,062,709 | 6.83% |
| 2014 | 6,659,031 | 17.77% | $112,768,709 | 17.39% |
| 2015* | 8,762,983 | 31.60% | $141,226,518 | 25.24% |
| 2016* | 9,967,907 | 13.75% | $159,510,075 | 12.95% |
| 2017 | 10,310,682 | 3.44% | $154,026,517 | -3.44% |
| 2018 | 11,755,903 | 14.02% | $165,885,527 | 7.70% |
| 2019 | 15,537,520 | 32.17% | $226,370,566 | 36.46% |
| 2020 | 18,245,279 | 17.43% | $274,308,460 | 21.18% |
That’s nothing less than the best year of comics that we’ve ever tracked in the Top 750! Not just in terms of raw numbers (this segment of the market has more than doubled since 2014!), but also in terms of percentages of growth. And the calculated retail dollars (again: only a measure of what the gross sales would be if every book was bought at full cover price… which assuredly they are not!) is up even more than the raw circulation figures. WOW!
(I want to remind you that while I asterisk 2015-2016 in terms of the sheer number of data points that I was getting was probably edited, it appears to be that the top 750 itself was fairly rock solid – there is more on this down below in the sausage making section)
The trend for print books in general (not just looking at comics) through bookstores in 2020, according to the NPD group and NPD BookScan appears to be a general rise of 8.2% in 2020, which does nothing but continue the now seven-year trend of comics-material being significantly stronger than the general curve.
(For what it is worth, overall book [only] sales through Diamond in the Direct Market appear to be down by about 2%, (in dollars, ComicChron isn’t calculating pieces here) so the book market performed incredibly better in the book category – however, I want to reiterate that “Direct Market” retailers are not necessarily buying their book stock from Diamond; certainly, I’ve moved the overwhelming majority of my own purchases directly to book publishers and distributors. Deep deep into the micro, my own individual sales were down about 33% in dollars at my main store in 2020 because of the damn plague.)
As I discuss in the boilerplate below, § I primarily write about the top 750 because a) that’s all the data I was initially leaked back in 2003, b) it’s a “manageable” chunk of data, and c) “as above, so below” – the top 750 represents about half of sales. However, since 2007, I’ve received the “entire” database, which now gives us a solid fifteen years of data to track, the aforementioned “the Long Tail”.
Here’s what the sales of all comics sales NPD BookScan tracks in this category looks like – but, seriously, let me remind you that the dataset changes enough each year this can be an awkward set of comparisons! Even putting aside “the asterisk years”, prior to 2013 this didn’t include Walmart, for just one example (of scores!) of the lack of direct comparison.
| Year | # of listed items | Percent Change | Total Unit Sold | Percent Change | Calculated Retail Value | Percent Change | Av. Sale per title | Av $ per title |
| 2007 | 13,181 | —– | 15,386,549 | —– | $183,066,142 | —– | 1167 | $13,888.64 |
| 2008 | 17,571 | 24.98% | 15,541,769 | 1.00% | $199,033,741 | 8.02% | 885 | $11,327.40 |
| 2009 | 19,692 | 12.07% | 14,095,145 | -9.31% | $189,033,736 | -5.02% | 716 | $9,599.52 |
| 2010 | 21,993 | 11.68% | 12,130,232 | -13.94% | $172,435,244 | -8.78% | 552 | $7,840.32 |
| 2011 | 23,945 | 8.88% | 11,692,058 | -3.61% | $175,634,490 | 1.86% | 488 | $7,334.91 |
| 2012 | 23,365 | -2.42% | 9,562,236 | -18.22% | $164,415,366 | -6.39% | 409 | $7,036.82 |
| 2013 | 24,492 | 4.82% | 10,153,628 | 6.18% | $176,419,370 | 7.30% | 415 | $7,325.63 |
| 2014 | 26,976 | 10.14% | 11,820,324 | 16.41% | $207,598,355 | 17.67% | 438 | $7,695.56 |
| 2015* | 22,431 | -16.85% | 15,269,550 | 29.18% | $259,807,532 | 25.15% | 681 | $11,582.52 |
| 2016* | 21,295 | -5.06% | 17,302,891 | 13.32% | $293,583,180 | 13.00% | 813 | $13,786.48 |
| 2017 | 35,338 | 65.95% | 18,385,086 | 6.25% | $302,300,435 | 2.97% | 520 | $8,554.54 |
| 2018 | 38,424 | 8.73% | 19,965,469 | 8.60% | $318,345,707 | 5.31% | 520 | $8,855.07 |
| 2019 | 40,745 | 6.06% | 24,694,686 | 23.69% | $399,322,754 | 25.44% | 606 | $9,800.53 |
| 2020 | 44,316 | 8.76% | 29,251,619 | 18.45% | $480,408,257 | 20.31% | 660 | $10,840.51 |
Overall, this is our Topline conclusion for NPD BookScan 2019: Up 9% in total number books listed, up a huge 18% in Units Sold, and up 20% in the calculated retail value if all books sold for cover price (they didn’t, not in the “bookstore” market) – as you read through individual publisher listings, you can compare their “long tail” performance this year against those benchmarks to see if they overperformed or underperformed the market.
But, as great as those topline numbers look, please remember that it is largely “hits” that are driving the business – the “average” book still only sold approximately six hundred and sixty copies, nationwide, in the entire year. Almost no one can earn a living from that (including book sellers!)
Let’s take a look at the Top 20 best-selling items on the 2020 chart; it looks like this:
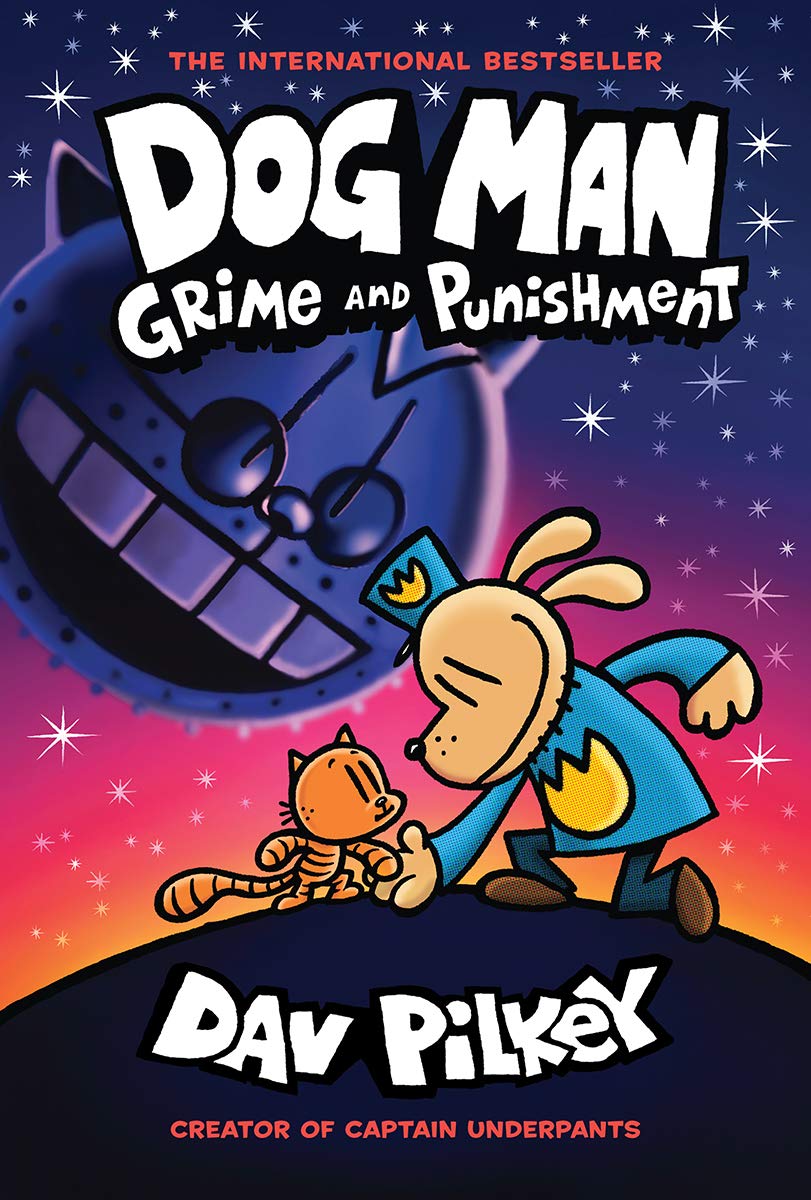
| 1 | DOG MAN: GRIME AND PUNISHMENT (v9) | PILKEY, DAV | 1,240,277 |
| 2 | DOG MAN: FETCH-22 (v8) | PILKEY, DAV | 601,337 |
| 3 | CAT KID COMIC CLUB | PILKEY, DAV | 412,894 |
| 4 | DOG MAN: FOR WHOM THE BALL ROLLS (v7) | PILKEY, DAV | 346,019 |
| 5 | GUTS | TELGEMEIER, RAINA | 299,307 |
| 6 | DOG MAN: BRAWL OF THE WILD (v6) | PILKEY, DAV | 253,139 |
| 7 | DOG MAN v1 | PILKEY, DAV | 221,803 |
| 8 | NEW KID | CRAFT, JERRY | 221,718 |
| 9 | DOG MAN: LORD OF THE FLEAS (v5) | PILKEY, DAV | 217,365 |
| 10 | DOG MAN UNLEASHED (v2) | PILKEY, DAV | 201,976 |
| 11 | DOG MAN AND CAT KID (v4) | PILKEY, DAV | 192,643 |
| 12 | DOG MAN: A TALE OF TWO KITTIES (v3) | PILKEY, DAV | 184,977 |
| 13 | FGTEEV PRESENTS: INTO THE GAME! | FGTEEV | 175,899 |
| 14 | THE SILVER EYES (FIVE NIGHTS AT FREDDY’S #1) | CAWTHON, SCOTT | 171,680 |
| 15 | THE LAST KIDS ON EARTH: JUNE’S WILD FLIGHT | BRALLIER, MAX | 144,588 |
| 16 | DRAMA | TELGEMEIER, RAINA | 138,776 |
| 17 | KAREN’S WITCH (BABY-SITTERS LITTLE SISTER #1) | FARINA, KATY | 138,610 |
| 18 | MY HERO ACADEMIA, VOL. 1, VOLUME 1 | HORIKOSHI, KOHEI | 136,491 |
| 19 | SISTERS | TELGEMEIER, RAINA | 132,733 |
| 20 | THE LAST KIDS ON EARTH AND THE SKELETON ROAD | BRALLIER, MAX | 129,006 |
Depending on your exact definitions of intended audiences, it appears that each and every one of the top 20 is intended for children or middle readers. It won’t be until #22 that you can find a comic intended for a different audience ( “Strange Planet”, a collection of webcomics), and if you are looking for a “Marvel / DC-style” comic, you are not even in the top fifty. “Watchmen” finally shows up at #57 – after that the next aimed-at-adults superhero comic is “Harleen” way the heck down at #144. The earliest Manga in the charts are “My Hero Academia” at #18, the first one aimed at adults would appear to be… well, depends who you ask? I tend to think that “Demon Slayer Kimetsu No Yaiba” (#33) is probably rated “T”, so next after that would be Ito’s “Uzumaki” at #34.
Children’s books have absolutely taken over the top of the charts. Forty-six of the top fifty. Eighty-seven of the top one hundred.
 Clearly, Dav Pilkey and his “Dog Man” series of books are the current Rulers of comic sales in the bookstores. What’s critical to remember about this is that Scholastic is also presumably selling a metric shedload of these books through the Scholastic Book Fairs, to elementary and middle school libraries, and any number of other places that don’t report to NPD BookScan. This here continues to be just the tip of the iceberg. (Editor’s note: due to the pandemic there probably weren’t many Scholastic Book Fair sales in 2020, and they’re still not included in NPD BookSCan numbers.)
So strong is Pilkey’s hold on the current charts that he takes the eight of the top ten spots on the charts. The #1 best-seller (“Dog Man: Grime and Punishment”), which is the ninth Dog Man volume, and was only on sale for three months of 2020 (!!) sells more than 1.2 million copies. Those are hard sales to actual readers, not just retailers buying stock to sell later.
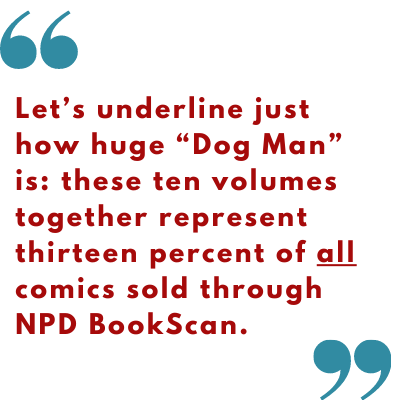
At #2 is “Fetch-22” with 600k sold, #3 is “Cat Kid Comic Club” with 414k sold, #4 is “For Whom The Ball Rolls” at 346k, #6 is “Brawl of the Wild” at 253k, #7 is the first volume, just called “Dog Man” at 222k sold, #9 is “Lord of the Fleas” and 217k, #10 is “Unleashed” with 202k, “Dog Man and Cat Kid” is #11 with 193k, and “A Tale of Two Kitties”, the lowest seller at #12, still does a staggering 185k sold. Ten “Dog Man” volumes (or a spin-off), and they sell no worse than the #12th best-selling book on the market. That’s crazy. Any one of those, in any year, would be a very high number by itself – add them all together and you three point eight million copies of one single series sold in one single year.
Let’s underline just how huge “Dog Man” is: these ten volumes together represent thirteen percent of all comics sold through NPD BookScan.
If Pilkey is the current King of comics sales, then the Queen is Raina Telgemeier, because she has three books in the Top 20, including #5, with “Guts” (299k sold), #16, “Drama” (139k), and #19 with “Sisters” (133k). “Ghosts” and “Smile” don’t make the Top 20, but they certainly sell a lot of copies with 117k and 198k, respectively.
We also have a new breakthrough author in the Top ten: Jerry Craft’s “New Kid,” the 2020 Newbery Award winner for children’s literature, is at #8, and it sells an impressive 222k copies.
Coming in at #13 is a book from a YouTuber, FGTeev’s “Into the Game!” which sells 176k copies, while #14 is 172k copies of the first “Five Nights at Freddy’s” graphic novels, “The Silver Eyes”.
“The Last Kids of Earth” place two volumes into the top twenty: “June’s Wild Flight” is #15 with 145k copies, while “The Skeleton Road” is #20 with 129k copies. It isn’t in the Top 20, but “The Midnight Blade” also sells great with a hair over 100k sold.
And the “Little Sister” spinoff of “Baby Sitters Club), “Karen’s Witch” places at #17 with 139k sold. Not in the Top twenty, “Karen’s Roller Skates” still shifts 102k copies, while from the main “BSC” seris has big winners with “Boy-Crazy Stacey” (111k) and “Kristy’s Great Idea” (100k)
At position #18 is the first piece of manga in the charts, the first volume of “My Hero Academia” with 136k copies sold. V2 doesn’t make the Top Twenty, but places 106k sold.
And while they don’t make the Top Twenty, selling over 100k copies is a serious success, so it is worth calling out “Strange Planet” by Nathan Pyle (119k, and the sole book selling that well which is aimed at adults), and the first “Wings of Fire” adaptation from Scholastic, that sells 109k
As is increasingly the situation, you may want to really underline the fact that not one of these books was created “for” the traditional Direct Market audience, and that the DM (as purchased through Diamond at least) does a mediocre job stocking or selling any of these books – in fact, of the top 500 DM best-sellers in 2020, only one of the NPD BookScan top 20 even appears at all – “My Hero Academia v1” sells all of 3219 (!!) copies through Diamond to comic book stores. Now, to be fair, many DM stores are buying these books from non-Diamond sources (because Diamond uniformly has the worst wholesale pricing for each and every book in the Top Twenty), but clearly the model is really starting to seismically shift.
How about if we sort things by author? There are 9671 different names on the entire NPD BookScan list for 2020. Here are people who sold more than 100k copies combined via NPD BookScan reporters in 2020:
| 4,106,772 | PILKEY, DAV |
| 1,128,083 | TELGEMEIER, RAINA |
| 1,055,010 | HORIKOSHI, KOHEI |
| 557,369 | GOTOUGE, KOYOHARU |
| 376,642 | BRALLIER, MAX |
| 331,335 | SUTHERLAND, TUI T. |
| 286,317 | CRAFT, JERRY |
| 282,177 | SIMPSON, DANA |
| 282,010 | YANG, GENE LUEN |
| 250,858 | ITO, JUNJI |
| 250,382 | ISHIDA, SUI |
| 243,894 | SHIRAI, KAIU |
| 243,737 | GALLIGAN, GALE |
| 243,063 | FARINA, KATY |
| 236,821 | ISAYAMA, HAJIME |
| 230,299 | KISHIMOTO, MASASHI |
| 228,013 | TORIYAMA, AKIRA |
| 223,126 | ARAKI, HIROHIKO |
| 220,183 | MIURA, KENTARO |
| 220,138 | FURUDATE, HARUICHI |
| 213,334 | LIBENSON, TERRI |
| 200,519 | ONE |
| 193,790 | HALE, SHANNON |
| 189,684 | ODA, EIICHIRO |
| 189,379 | CLANTON, BEN |
| 188,847 | PYLE, NATHAN W. |
| 175,899 | FGTEEV |
| 173,293 | KIBUISHI, KAZU |
| 172,823 | CAWTHON, SCOTT |
| 162,992 | HIMEKAWA, AKIRA |
| 162,022 | HALE, NATHAN |
| 149,466 | MILLER, KAYLA |
| 140,439 | MOORE, ALAN |
| 139,410 | WAY, GERARD |
| 132,263 | OHBA, TSUGUMI |
| 130,642 | PEIRCE, LINCOLN |
| 130,337 | AIDAIRO |
| 129,415 | LEWIS, JOHN |
| 128,528 | ITAGAKI, PARU |
| 127,135 | OHKUBO, ATSUSHI |
| 121,863 | MASHIMA, HIRO |
| 118,445 | TOGASHI, YOSHIHIRO |
| 117,917 | MCELROY, CLINT |
| 117,197 | TOBIN, PAUL |
| 116,722 | ODA, TOMOHITO |
| 110,212 | GREEN, JOHN PATRICK |
| 109,882 | TAKEUCHI, NAOKO |
| 108,787 | GAIMAN, NEIL |
| 104,523 | KIRKMAN, ROBERT |
| 103,734 | SNYDER, SCOTT |
| 103,350 | KUSAKA, HIDENORI |
These fifty-one people represent sixty-one percent of all sales of NPD BookScan-reported sales in 2020.
What you can take from this is that only a tiny number of creators drive the majority of the business in comics (and books in general, I think); and conversely, this probably means that the numerical majority of comics aren’t actually significantly profitable any given year.
Let’s now switch our attention to looking at how publishers performed.
As a way to make the publisher breakdowns more readable, I split the chart into “eastern” (Manga) and “western” comics, because I think there are a few clear market distinctions between those categories. So, without further ado:
2020 Manga
Overall sales are up immensely for the Manga category in 2020 – about 53% in pieces within the Top 750, and just under 56% in calculated dollars.
Here’s a year-to-year comparison chart for the Top 750:
| Year | # of placing titles | Unit sales | Calculated Retail Value |
| 2003 | 447 | 3,361,966 | $34,368,409 |
| 2004 | 518 | 4,603,558 | $45,069,684 |
| 2005 | 594 | 5,691,425 | $53,922,514 |
| 2006 | 575 | 6,705,624 | $61,097,050 |
| 2007 | 575 | 6,837,355 | $61,927,238 |
| 2008 | 514 | 5,624,101 | $53,033,579 |
| 2009 | 451 | 4,414,705 | $41,068,604 |
| 2010 | 436 | 3,117,019 | $30,212,561 |
| 2011 | 392 | 2,627,570 | $27,017,081 |
| 2012 | 367 | 1,908,186 | $21,324,368 |
| 2013 | 315 | 1,665,487 | $21,256,777 |
| 2014 | 271 | 1,748,185 | $22,601,720 |
| 2015* | 279 | 2,033,534 | $26,191,474 |
| 2016* | 311 | 2,629,366 | $35,915,488 |
| 2017 | 284 | 2,427,380 | $35,433,489 |
| 2018 | 299 | 2,641,158 | $35,955,537 |
| 2019 | 332 | 3,539,031 | $49,900,429 |
| 2020 | 358 | 5,419,328 | $77,703,520 |
All three indicators are up for the category in 2020, and this year would be the fifth best year for Manga in terms of units sold since we’ve tracked been able to track these things, and the number one year in terms of calculated dollars sold! Be clear, however, that calculated dollars is a pretty fictional measurement because no one anywhere knows how much any individual book is actually selling for. Interestingly, this powerful year-over-year growth was achieved despite a “North American Manga Shortage” that began as a result of COVID lockdowns – if 2021’s growth is lower, that would appear to be the culprit. Both pieces and dollars are up by more than fifty percent in the Top 750, which is utterly remarkable! What’s even more interesting is that this continues to be from a relatively low number of placing books, historically-speaking – there are only about two thirds of the number of placing titles as there were in 2005. As is typical with Manga, this is driven by the near-exclusive domination of series in the manga world – when there’s not a strong anime driving sales, manga tankobon series start to perform more like periodicals than books (albeit over a wider horizon); rather than generally building a strong core backlist that sells forever, year-in-and-year out, manga tends instead to ebb and flow with culture and fashion (and what anime is airing currently, especially)
Much like in 2019, we can see this kind of concentration clearly with the category leader in 2020: “My Hero Academia” – thirty-six volumes of the series (or spin-off books) show up in the Manga Top 750, and represent more than one-in-five of Manga volumes sold, combined, in the Top 750.
Seven of the Top Ten Manga in 2019 were “My Hero Academia” volumes, starting with v1 at the #1 spot (nearly 135k sold), v2 at #2 (106k), v24 at #4 (76k), v3 at #5 (71k), v23 at #6 (64k), v4 at #8 (49k), and v5 at #10 (52k) – plus each and every volume of the series charts within the Top 750. Those are all large gains in the audience for MHA – for example, v1 sold approximately 99k in 2019, so sales are up by about 36% on that volume, year-over-year.
 Other than MHA in the Manga Top Ten is “Demon Slayer: Kimetsu No Yaiba” v1 at #3 (81k sold), and v2 of that series at #9 (53k) as well as “Uzumaki” by Junji Ito, which comes in #7 with just over 62k copies sold – very much up from 36k from the previous year. That last would appear be a relatively rare example of “steady selling core backlist” that’s not directly tied to an Anime being in production – “Uzumaki” has been selling in this edition since 2013, and virtually everyone of Ito’s books (all of which stand-alone) places within the Top 750.
One other thing that the nature of multi-book series means that there tends to be less diversity overall in what’s actually selling – of the 358 different “manga” books in the Top 750, I only count eighty-four distinct “series” – I found seventy-nine in 2019.
Other popular Manga series include “Haikyu!!” (v1 sold 50k at #12), “Toilet-Bound Hanako-Kun” (v1 sold 48k at #13), “Tokyo Ghoul” (v1 sold 47k at #15), “The Promised Neverland” (v1 sold 37k at #19), “Death Note” (v1 sold 35k at #21) and Naruto (v1 sold 34k at #24)
Manga, as a category, has a “long tail”, where we’re looking at all sales for the year, and not just within the Top 750 best-sellers:
| Year | # of listed items | Percent Change | Total Unit Sold | Percent Change | Calculated Retail Value | Percent Change | Av. Sale per title | Av $ per title |
| 2007 | 6231 | —— | 11,323,487 | —— | $108,770,537 | —– | 1817 | $17,456 |
| 2008 | 7842 | 20.54% | 10,173,091 | -11.31% | $100,800,283 | -7.91% | 1297 | $12,854 |
| 2009 | 8756 | 11.66% | 8,148,490 | -19.90% | $81,770,442 | -18.78% | 931 | $9,339 |
| 2010 | 8764 | —— | 6,239,725 | -23.42% | $67,092,668 | -17.95% | 712 | $7,655 |
| 2011 | 8991 | 2.59% | 5,690,327 | -8.80% | $62,810,728 | -6.38% | 633 | $6,986 |
| 2012 | 6332 | -29.57% | 3,510,057 | -38.32% | $40,943,613 | -34.81% | 554 | $6,466 |
| 2013 | 7024 | 10.93% | 3,516,208 | 0.01% | $44,651,823 | 9.06% | 501 | $6,357 |
| 2014 | 7452 | 6.09% | 3,914,385 | 11.32% | $51,557,925 | 15.47% | 525 | $6,919 |
| 2015* | 4412 | -40.79% | 4,580,434 | 17.02% | $62,253,624 | 20.75% | 1038 | $14,110 |
| 2016* | 4968 | 12.60% | 5,821,892 | 27.10% | $81,314,479 | 30.62% | 1172 | $16,368 |
| 2017 | 10,248 | 106.8% | 5,865,412 | 0.75% | $85,581,224 | 5.25% | 572 | $8,351 |
| 2018 | 10,839 | 5.77% | 6,100,260 | 4.00% | $87,421,299 | 2.15% | 563 | $8,065 |
| 2019 | 9928 | -8.40% | 7,461,077 | 22.31% | $110,577,066 | 26.49% | 752 | $11,138 |
| 2020 | 12,423 | 25.13% | 10,766,492 | 44.30% | $161,611,294 | 46.15% | 867 | $13,009 |
Good general “Long-Tail” growth in the overall category – number of books available hits a new record at over 12k items, up nearly 25% from last year, while both units sold and calculated dollars are staggeringly up well over 40%. While units sold is not a record (still have to surpass 2007), calculated dollars are.
When you start breaking down the manga portion of the chart by publisher, there’s really not any contest at all: there’s a two-ton gorilla, and then a bunch of smaller houses struggling in their shadow. This chart represents all 12,423 books that are “manga” in NPD BookScan in 2020, and represents “the long tail” of the charts:
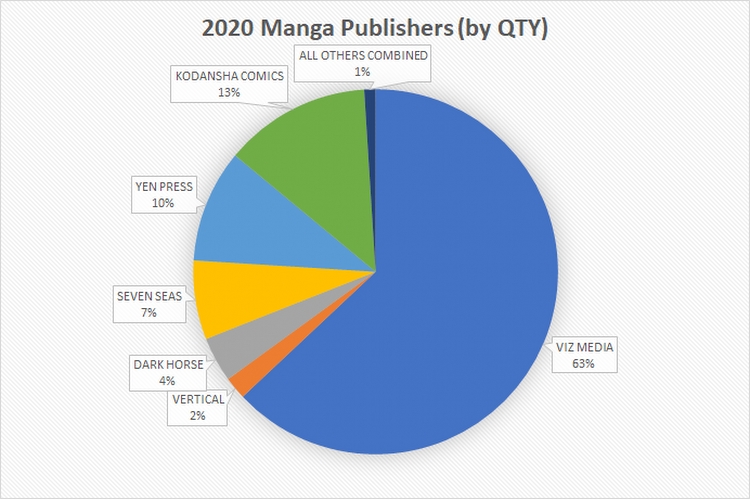
Viz absolutely crushes everyone, being nearly two thirds of sales of all manga. And people complain about monopolies in Direct Market comics, yikes!
If we look solely within the Top 750, the picture is very similar: The #1 publisher is Viz who takes 259 of the 358 manga spots in the Top 750, keeping them as the overwhelmingly dominant player with seventy-two percent of the placing titles! Within the Top 750, Viz charted about 4.3 million pieces, for more than $58 million of calculated retail dollars – this is yet another year of strong growth for Viz, up roughly 54% from the previous year in pieces placed!
Viz controls the manga charts as they have for a very long time now. It is nearly impossible to envision anyone really challenging them substantially for that role because they are almost five times larger than their nearest competitor in their segment (!)
As noted above, Viz’s #1 Best-seller is “My Hero Academia”. Twenty five volumes of the main series chart, and nothing from that main series sells under 17k (volumes 13-15 are the lowest part of the “hammock”), while all eight volumes of “MHA: Vigilantes” all sell under 18k, and all three of “MHA: Smash!!” sell under 10k. Seven of Viz’s Top 10 are “MHA”, as are eleven of the Top 20. All told, this one series sells nearly 1.2 million books combined this year! This is dramatically up from 862k in 2019, just under a half-million in 2018 and just 134k combined in 2017.
(The “Hammock Principle”, briefly stated, is books in a series generally sell in a sales pattern that looks like a hammock if you chart it out: the first few volumes and the last few volumes sell the best, with the ends running down into the middle volumes which have the lowest sales, like the sagging part of a hammock. The problem with this, as both stores that don’t have infinite rack space, as well as publishers that need a certain volume and velocity to keep things in print, is that sagging middle becomes unsustainable for most series over time, and stores start to only carry the first and last few volumes.)
“Demon Slayer: Kimetsu No Yaiba” is Viz’s second most popular property in 2020, with two volumes placing in their top ten, and nineteen volumes overall placing with the Manga top 750. Combined this property shifts 557k units. It was only 116k units in 2019
The only other book to crack Viz’s Top Ten in 2020 is “Uzumaki” (62k at place #7, compared to 36k in 2019) by Junji Ito, and Ito appears to be the only author that Viz is successful while doing so with single, unconnected, books instead of ongoing series. This is pretty close to a year-over-year doubling of sales for at least three years running. Ito also sells three other books at over 25k – “Gyo”, “Tomie” and “Smashed” – while “Shiver” and “Venus in the Blind Spot” sell over 20k, “No Longer Human” and “Remina” sell over 15k, and “Frankenstein” and “Fragments of Horror” sell in the 10k range.
Other strong series for Viz include “Haikyu!!” (v1 over 50k), “Tokyo Ghoul” (v1 places 47k), “The Promised Neverland” (v1 sells almost 40k), “Death Note” (35k for v1), “Naruto” (34k for v1), “Komi Can’t Communicate” (almost 30k), “Beastars” and “Assassination Classroom” (28k for v1 of each), while “Hunter X Hunter”, “Jojo’s Bizarre Adventure” and “One-Punch Man” all come in around the 25k mark.
Let’s take a look at the “long tail” of Viz?
| Year | # of listed items | Percent Change | Total Unit Sold | Percent Change | Calculated Retail Value | Percent Change | Av. Sale per title | Av $ per title |
| 2007 | 2018 | —— | 6,249,324 | —— | $55,123,347 | —– | 3097 | $27,316 |
| 2008 | 2447 | 21.26% | 5,536,286 | -11.41% | $50,311,791 | -8.97% | 2263 | $20,561 |
| 2009 | 2793 | 14.14% | 4,819,407 | -12.95% | $44,310,790 | -11.93% | 1726 | $15,865 |
| 2010 | 3088 | 10.56% | 3,576,671 | -25.79% | $35,041,305 | -20.92% | 1158 | $11,348 |
| 2011 | 3393 | 9.88% | 3,276,297 | -8.40% | $32,766,960 | -6.49% | 966 | $9,657 |
| 2012 | 3518 | 3.68% | 2,099,560 | -35.92% | $22,433,721 | -31.54% | 597 | $6,377 |
| 2013 | 3636 | 3.35% | 1,853,211 | -11.73% | $21,586,923 | -3.77% | 510 | $5,937 |
| 2014 | 3765 | 3.55% | 1,855,161 | 0.11% | $22,732,074 | 5.30% | 493 | $6,038 |
| 2015* | 2264 | -39.87% | 2,150,656 | 15.93% | $28,134,971 | 23.77% | 950 | $12,427 |
| 2016* | 2405 | 6.23% | 2,811,978 | 30.75% | $38,854,681 | 38.10% | 1169 | $16,156 |
| 2017 | 4443 | 84.74% | 2,958,351 | 5.21% | $41,594,729 | 7.80% | 666 | $9,362 |
| 2018 | 4637 | 4.37% | 3,184,274 | 7.64% | $44,423,434 | 6.80% | 687 | $9,580 |
| 2019 | 4702 | 1.40% | 4,329,369 | 35.96% | $60,817,993 | 36.91% | 921 | $12,934 |
| 2020 | 4856 | 3.28% | 6,614,179 | 52.77% | $94,768,000 | 55.82% | 1362 | $19,516 |
Viz is in a truly fantastic place by their long-tail – not only are they out performing the Top 750 overall, they’re outperforming the general Manga long-tail. They added about 3% to the number of SKUs they sell, yet they’re up by more than fifty percent in pieces and dollars, and had the single biggest year of both circulation and dollars that we’ve ever tracked for them. That’s simply incredible business! Viz in 2020 has two books over 100k, ten more over 50k, another thirteen over 30k, and additional thirty-four over 20k, and a staggering ninety-four others over 10k. They are a very very very strong publisher, in short.
In a steady second place among manga publishers, we have Kodansha Comics, which places forty-four titles within the top 750, with 451k in units sold (compared to 300k in sales in 2019), and $5.9 million in calculated retail dollars ($5.1m in 2019).
Kodansha’s licenses formerly were both the original backbone of Tokyopop, as well as being the majority of Del Rey Manga. Kodansha pulled Tpop’s license in March of ’09 and Del Rey in October of ’10. You may want to look at those publisher’s listings below to get a better historical overview.
Kodansha’s current #1 best-seller is a return to “Attack on Titan”, with v1 shifting some 32k units in 2020 – this is almost triple from 2019’s 11k copies sold, although I am not sure how to specifically account for that surge? V2 (#4) moves about 17, while Vs 30 (#5), 31 (#9), 3 (#10) 29 (#14) and 23 (#15) all place over 10k each.
#2 for Kodansha is “Sailor Moon”. V1 sells just a hair under 20k (that’s up from around 15k in 2019), while v2 comes in at #11, and a bit over 10k.
In the #3 slot is “Fire Force”, where v1 sells a bit under 20k, and v2 of this series does a bit over 10k to come in at #12.
Also doing solidly are “The Seven Deadly Sins” (v1 is #6 at about 14k), “Rent-A-Girlfriend” (v1 is #7 at under 14k), and “Wotakoi: Love is Hard for Otaku” with v1 at #8 at 13k sold and v4 at #17 and about 9700 copies sold. The first volume of perennial “Akira” sells a bit over 10k to place at #13 for Kodansha, while the rest of the top 20 is fleshed out by “Fairy Tale: 100 Year Quest” (v1 sells 9700-ish copies through NPD BookScan reporters to place #16, while v3 moves about 9400 copies at #20), and “Vinland Saga” at 9500 copies and position #19.
These Long Tail figures are just for Kodansha-published titles, and they reflect that Kodansha, itself, first started publishing in 2010:
| Year | # of listed items | Percent Change | Total Unit Sold | Percent Change | Calculated Retail Value | Percent Change | Av. Sale per title | Av $ per title |
| 2010 | 9 | —— | 13,291 | —— | $322,717 | —— | 1477 | $35,857 |
| 2011 | 108 | 1200.00% | 197,021 | 1482.36% | $2,537,221 | 786.21% | 1825 | $23,493 |
| 2012 | 246 | 127.78% | 324,827 | 64.87% | $4,026,770 | 58.71% | 1320 | $16,369 |
| 2013 | 320 | 30.08% | 501,554 | 54.41% | $6,299,487 | 56.44% | 1567 | $19,686 |
| 2014 | 442 | 38.13% | 821,298 | 63.75% | $10,481,008 | 66.38% | 1858 | $23,713 |
| 2015* | 455 | 2.94% | 855,347 | 4.15% | $10,938,531 | 4.37% | 1880 | $24,041 |
| 2016* | 587 | 29.01% | 981,386 | 14.74% | $12,596,281 | 15.16% | 1672 | $21,459 |
| 2017 | 895 | 52.47% | 917,596 | -6.50% | $13,616,224 | 8.10% | 1025 | $15,214 |
| 2018 | 1060 | 18.44% | 870,940 | -5.08% | $12,612,501 | -7.37% | 822 | $11,899 |
| 2019 | 1177 | 11.04% | 989,089 | 13.57% | $15,838,708 | 25.58% | 840 | $13,457 |
| 2020 | 1337 | 13.59% | 1,356,290 | 37.13% | $21,345,409 | 34.77% | 1014 | $15,965 |
In 2020, Kodansha has one book selling over 30k, and fourteen more titles that sell over 10k, but otherwise their long-tail seems very healthy, with growth of better than a third on 13% more SKUs. This would be a celebration anywhere, however their growth is much smaller than Viz’s.
It is always a bit of a foot race for the next few slots, but in 2020 in the Top 750, the #3 publisher of Manga is Yen Press, which places 20 titles, for about 267k copies sold (up big from 117k copies sold the previous year), and nearly $3.9 million of calculated retail gross (up from $1.9 million retail gross the previous year). Yen is a division of Hachette (more on them later).
Yen’s change of position this year is largely driven by the success of “Toilet-Bound Hanako-Kun”, which takes four of their five best-selling spots. V1 (their #1 best-seller) sells an impressive 48k copies in 2020, while v2 (#2) pulls in 28k, v3 (#3) slides in at just over 20k. They also place v4 (#5 and 16k), v5 (#8 and 11k) while v6 sells about 6600 copies at position #18.
Yen’s previous best-seller, “Black Butler”, continues strong – v1 (#4) brings in a bit over 19k, which is great growth from selling around 13k in the bookstore market the previous year. This was 11k in 2018. Two other volumes also make the Top 750, though none sell over 10k.
Yen also does well with “Kakegurui – Compulsive Gambler” where v1 (#6) hits 15k, “Fruits Basket” where v1 (#7) does almost 15k and v2 (#12) does 8100 copies, and with “Ibitsu” where v1 (#9) comes in with 11k copies. Finally, Yen’s #10 book, the first volume of “Soul Eater” is just a hair under 10k.
In the Long Tail Yen this year finally stops the red numbers, and provides their Best Year on Record via NPD BookScan reporters!
| Year | # of listed items | Percent Change | Total Unit Sold | Percent Change | Calculated Retail Value | Percent Change | Av. Sale per title | Av $ per title |
| 2007 | 10 | —— | 12,896 | —— | $147,449 | —– | 1,290 | $14,745 |
| 2008 | 90 | 800.00% | 110,126 | 753.95% | $1,237,860 | 739.52% | 1,224 | $13,754 |
| 2009 | 211 | 134.44% | 330,962 | 200.53% | $3,697,113 | 198.67% | 1,569 | $17,522 |
| 2010 | 344 | 63.03% | 560,983 | 69.50% | $6,650,871 | 79.89% | 1,680 | $19,334 |
| 2011 | 460 | 33.72% | 764,125 | 36.21% | $9,953,966 | 49.66% | 1,661 | $21,639 |
| 2012 | 548 | 19.13% | 647,948 | -15.20% | $8,735,264 | -12.24% | 1,182 | $15,940 |
| 2013 | 654 | 19.34% | 692,380 | 6.86% | $9,715,421 | 11.22% | 1,059 | $14,855 |
| 2014 | 776 | 18.65% | 682,135 | -1.48% | $9,985,502 | 2.78% | 776 | $12,868 |
| 2015* | 649 | -16.37% | 917,620 | 34.52% | $13,248,445 | 32.68% | 1414 | $20,414 |
| 2016* | 793 | 22.19% | 1,072,008 | 16.82% | $15,520,207 | 17.15% | 1352 | $19,572 |
| 2017 | 1403 | 76.92% | 928,962 | -13.34% | $13,866,675 | -10.65% | 662 | $9,884 |
| 2018 | 1737 | 23.81% | 890,228 | -4.17% | $13,051,751 | -5.88% | 513 | $7,514 |
| 2019 | 1846 | 6.28% | 884,596 | -0.63% | $13,008,175 | -0.33% | 479 | $7,047 |
| 2020 | 2010 | 8.88% | 1,090,002 | 23.22% | $15,797,758 | 21.44% | 542 | $7,860 |
Yen Press has one book over 30k, two more titles selling over 20k copies, and another six that place over 10k in 2020.
Dropping down a place in 2020, to being the #4 manga publisher is Dark Horse. They place sixteen titles in the Top 750, whose combined sales represent 206k copies sold (up from 148k in 2019) and $7.2m in calculated retail value (up big from $4.2m)
The best-selling DH series continues to be “Berserk” which is now in $50 hardcover editions and outselling the softcovers. The HC of v1 (#1 for Dark Horse) racked up 33k sold, which is pretty impressive at a $50 base price. V2 (#2) and v4 (#3) sell around 20k, and v5 (#4) does around 17k. Showing you “the hammock” in action, v3 (#6) does just 14k. And despite in being released in November, v6 (#10) does more than 8700 copies. And that’s just the hardcover edition! The paperback of “Berserk” v1 (#7) continues to sell nearly 14k copies, and v2 (#11) does around 7800.
Other than “Berserk”, Dark Horse also does solidly with “Danganronpa 2”, where v1 (#5) almost makes it to 15k and “Danganronpa The Animation” where v1 (#9) tops 10k. Plus, they also do very well with “Mob Psycho 100” (#8), whose v1 shifts over 11k copies
Looking at the Long Tail, this is what Dark Horse’s (manga only!) recent performance looks like – it’s up big! There is much more on Dark Horse down below in the “Western Publishers” section.
| Year | # of listed items | Percent Change | Total Unit Sold | Percent Change | Calculated Retail Value | Percent Change | Av. Sale per title | Av $ per title |
| 2007 | 341 | —— | 249,943 | —— | $3,329,464 | —– | 733 | $14,745 |
| 2008 | 420 | 23.17% | 248,981 | -0.38% | $3,176,870 | -4.58% | 593 | $7,564 |
| 2009 | 455 | 8.33% | 226,497 | -9.03% | $2,915,693 | -8.22% | 498 | $6,408 |
| 2010 | 473 | 3.96% | 194,494 | -14.13% | $2,633,077 | -9.69% | 411 | $5,567 |
| 2011 | 497 | 5.07% | 189,329 | -2.66% | $2,602,230 | -1.17% | 381 | $5,236 |
| 2012 | 493 | -0.80% | 112,373 | -40.65% | $1,631,038 | -37.32% | 228 | $3,308 |
| 2013 | 521 | 5.68% | 103,538 | -7.86% | $1,678,563 | 2.91% | 199 | $3,222 |
| 2014 | 559 | 7.29% | 100,894 | -2.60% | $1,617,251 | -3.65% | 180 | $2,893 |
| 2015* | 303 | -45.80% | 135,444 | 34.24% | $2,238,167 | 38.39% | 447 | $7,387 |
| 2016* | 225 | -25.74% | 174,298 | 28.69% | $2,291,355 | 2.38% | 775 | $10,184 |
| 2017 | 527 | 234.22% | 238,089 | 36.60% | $3,795,506 | 65.64% | 452 | $7,202 |
| 2018 | 531 | 0.76% | 224,010 | -5.91% | $3,579,135 | -5.70% | 422 | $6,740 |
| 2019 | 384 | -27.68% | 329,034 | 46.88% | $7,280,058 | 103.40% | 857 | $18,958 |
| 2020 | 472 | 22.92 | 430,762 | 30.92% | $11,111,354 | 52.63% | 913 | $23,541 |
Dark Horse Manga has one book over 30k, and eight more books over 10k.
Dropping to the #5 manga publisher as represented by the NPD BookScan Top 750 is Seven Seas, which places just seven titles for almost 54k copies sold combined. This is a huge drop from 2019 where they sold 100k, and 2018 when they had sold 199k. 2020’s calculated value comes out to almost $993k.
Seven Seas’ biggest success in 2020, as the previous year, was “I Want To Eat Your Pancreas”. It sells a respectable 11k, up from 9k the previous. They have no other comic that passes 10k copies sold.
Seven Seas’ Long Tail shows their “best year ever”, but the growth is pretty anemic compared to their peers
| Year | # of listed items | Percent Change | Total Unit Sold | Percent Change | Calculated Retail Value | Percent Change | Av. Sale per title | Av $ per title |
| 2007 | 54 | —— | 50,641 | —— | $558,450 | —– | 938 | $10,342 |
| 2008 | 76 | 41.74% | 80,112 | 58.20% | $833,667 | 49.28% | 1,054 | $10,969 |
| 2009 | 97 | 27.63% | 74,967 | -6.42% | $807,666 | -3.12% | 773 | $8.326 |
| 2010 | 93 | -4.12% | 75,764 | 1.06% | $875,612 | 8.41% | 815 | $9,415 |
| 2011 | 118 | 26.88% | 116,360 | 53.58% | $1,426,618 | 62.93% | 986 | $12,090 |
| 2012 | 151 | 27.97% | 124,262 | 6.79% | $1,684,994 | 18.11% | 823 | $11,159 |
| 2013 | 223 | 47.68% | 204,419 | 64.51% | $2,942,608 | 74.64% | 917 | $13,196 |
| 2014 | 300 | 34.53% | 284,484 | 39.17% | $3,979,338 | 35.23% | 948 | $13,264 |
| 2015* | 304 | 1.34% | 374,715 | 31.72% | $5,177,568 | 30.11% | 1233 | $17,031 |
| 2016* | 417 | 37.17% | 491,947 | 31.29% | $6,960,634 | 34.44% | 1180 | $16,692 |
| 2017 | 554 | 32.85% | 478,336 | -2.77% | $6,801,527 | -2.29% | 863 | $12,277 |
| 2018 | 906 | 63.54% | 667,556 | 39.56% | $9,511,591 | 39.84% | 737 | $10,498 |
| 2019 | 1049 | 15.78% | 671,362 | 0.57% | $9,498,329 | -0.14% | 640 | $9,055 |
| 2020 | 1230 | 17.25% | 699,127 | 4.14% | $9,913,480 | 4.37% | 568 | $8,060 |
Seven Seas has the one title that sells over 10k this year.
The sixth largest publisher of manga as measured by the NPD BookScan continues to be Vertical. They place five books into the Top 750, 35k copies, for $538k – that’s not very different from the previous year, really.
Their best-seller in 2020 is “Don’t Toy With Me, Miss Nagatoro”, but it’s oddly v2 that sells best not v1, and it sells nearly 8500 copies.
The Long Tail is up a bit… and they have their best calculated dollar sales on record… by about $1000!
| Year | # of listed items | Percent Change | Total Unit Sold | Percent Change | Calculated Retail Value | Percent Change | Av. Sale per title | Av $ per title |
| 2007 | 25 | —— | 23,444 | —— | $417,914 | —— | 938 | $16,717 |
| 2008 | 34 | 36.00% | 21,003 | -10.41% | $343,109 | -8.21% | 617 | $10,091 |
| 2009 | 39 | 14.71% | 19,434 | -7.47% | $325,437 | -5.15% | 498 | $8,345 |
| 2010 | 62 | 58.97% | 33,097 | 70.30% | $494,098 | 51.83% | 534 | $7,969 |
| 2011 | 84 | 35.48% | 49,062 | 48.24% | $699,253 | 41.52% | 584 | $8,324 |
| 2012 | 118 | 40.48% | 45,026 | -8.23% | $671,086 | -4.03% | 382 | $5,687 |
| 2013 | 159 | 34.75% | 61,906 | 37.49% | $1,128,252 | 68.12% | 389 | $7,096 |
| 2014 | 187 | 17.61% | 83,312 | 34.58% | $1,491,984 | 32.24% | 446 | $7,979 |
| 2015* | 162 | -13.37% | 110,172 | 32.24% | $1,956,167 | 31.11% | 680 | $12,075 |
| 2016* | 185 | 14.20% | 172,792 | 56.84% | $2,931,568 | 49.86% | 934 | $15,846 |
| 2017 | 269 | 45.41% | 181,216 | 4.88% | $3,178,964 | 8.44% | 674 | $11,818 |
| 2018 | 339 | 26.02% | 162,840 | -10.14% | $2,784,106 | -12.42% | 480 | $8,213 |
| 2019 | 387 | 14.16% | 163,631 | 0.49% | $2,835,473 | 1.85% | 423 | $7,327 |
| 2020 | 403 | 4.13% | 192,059 | 17.37% | $3,179,242 | 12.12% | 477 | $7,889 |
Vertical has no books over 10k this year.
There are also a couple of books from Square Enix to round out the the manga share of the Top 750 – “Soul Eater” for 8700 copies, and “A Man and His Cat” for about 6600, but I’m not going to build up a long-tail for just that.
Manga is a pretty closed system, overwhelmingly controlled by a single vendor. If we treated every publisher not covered above as a single entity, we’re talking about 4229 SKUs, that sold 384k copies combined for 32 publishers and almost $5.5 million calculated dollars.
2020 Western Publishers
When I say “Western” here, I mean publishers/work from Europe and America, as opposed to Asia, not publishers of the genre of “western” comics!
 NPD BookScan itself does not try to control how data gets initially logged (or changed), leaving that all to publishers. I think that I understand this reasoning: the publisher is the customer, and they should have some level of control over how they are represented, but as a person who tries to decipher the data each year, I know that I would prefer some sort of internally-consistent (and externally-petionable!) method of categorizing titles that doesn’t seem to change in some fashion from year-to-year – Books will appear and disappear, almost seemingly willy-nilly, and it makes showing you anything even resembling consistent data staggeringly difficult. All of this is a function of how publishers assign BISACs and in what order – please please read the long section below on how the sausage is made!
I’d also like to continue to give you a top-level reminder that back in 2008 there was some sort of behind-the-scenes recategorization in what got sent to me – I now know this is probably a change in BISAC codes! – and most of the “cartoon-strip humor” books like “Calvin & Hobbes” and “The Far Side” suddenly disappeared, so there’s kind of a not-strictly apples thing going on with the pre-2008 numbers here. Do keep that in mind when making comparisons both in the Top 750 chart, as well as the Long Tail.
Another observation I have to repeat is that NPD BookScan tracks (theoretically at least, since again, publishers set their own BISACs) Adult reading distinctly from YA and Kids. I don’t. Part of this is that I’m a bookseller, and I’m rather agnostic about who specifically buys books as a result. But I have to be certain to make this point as clearly as I can: the market for who is buying comics is changing, and it is changing for the wider and the better. The eight year old who is inhaling Dav Pilkey in 2020 is going to be the comics-literate adult of 2033 (or whatever), which is going to change what comics readers in the ‘30s will want or expect from comics. The kids reading comics in 1965 totally imagined what the 1980’s comics scene could and would be, which is why we’re where we are today, but the shape of the Western industry in the future is absolutely what today’s children read and see.
Ignore this at your deadliest of perils: the future is always shaped by the present.
OK, enough editorializing, let’s look at the market!
Here’s the Western Top 750 over time:
| Year | # of placing titles | Unit sales | Calculated Retail price |
| 2003 | 304 | 2,133,618 | $32,360,644 |
| 2004 | 233 | 1,467,535 | $22,713,802 |
| 2005 | 142 | 1,315,920 | $21,537,155 |
| 2006 | 174 | 1,689,571 | $29,314,852 |
| 2007 | 175 | 1,746,962 | $33,247,187 |
| 2008 | 236 | 2,710,175 | $48,327,594 |
| 2009 | 299 | 3,219,748 | $52,147,410 |
| 2010 | 314 | 3,297,317 | $54,515,605 |
| 2011 | 358 | 3,068,593 | $77,254,870 |
| 2012 | 383 | 3,530,143 | $68,593,986 |
| 2013 | 435 | 3,988,864 | $74,805,932 |
| 2014 | 479 | 4,910,846 | $90,166,989 |
| 2015* | 471 | 6,729,449 | $115,035,044 |
| 2016* | 439 | 7,338,541 | $123,594,588 |
| 2017 | 466 | 7,846,357 | $117,761,519 |
| 2018 | 451 | 9,114,745 | $129,929,990 |
| 2019 | 418 | 11,998,489 | $176,470,137 |
| 2020 | 392 | 12,825,951 | $196,604,939 |
2020 NPD BookScan’s Top 750 is looking fine: Up almost 7% in pieces, up 11% in calculated retail dollars (which, please remember is a purely fictional number because we have no way of know what a book actually sold for!), and the highest absolute number that we’ve ever seen, even while the actual number of placing books has its fourth year of decline. Now, the Manga growth is closer to 50%, and this appears to be because Manga growth was spread evenly and broadly, while Western comics have a few truly massive hits at the top, while the middle is softer, and even in decline in a few places. This is worth keeping an eye on, especially the midline performance of traditional “Direct Market” publishers (DC, Marvel, Image, etc) going forward.
If we were to look at the entirety of all of NPD BookScan’s reported numbers for the total 31,893 “Western” comics, things look generally like this – there are 1678 publishers listed in the 2020 chart, but only 14 of them manage to capture 1% or more of the market.
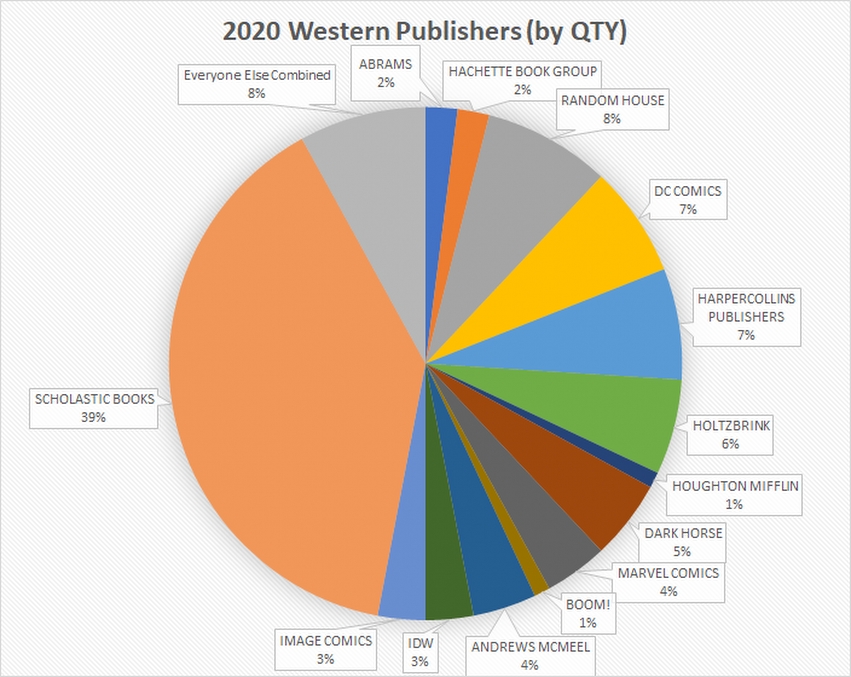
This is not quite as lopsided as the Manga chart…. But it is still a bit staggering that one publisher (Scholastic) is very nearly 40% of all graphic novels sold.
Let’s start with a look at the Long Tail for Western publishers collectively. As you see the comparison against the Top 750 is starting to get super unbalanced – the best-selling 750 books sell around two-thirds of the volume of all graphic novels sold in 2020 as reported to NPD BookScan, and about five-eighths of the calculated dollars sold. Please pay attention: the “other” thirty-one thousand-plus books really don’t sell all that well. This is how books work.
| Year | # of listed items | % Change | Total Pieces | % Change | Calculated Retail Value | % Change | Av. Sale per title | Av $ per title |
| 2007 | 6950 | — | 3,029,039 | — | $74,595,605 | — | 436 | $10,733 |
| 2008 | 9728 | 39.97% | 5,368,678 | 77.24% | $98,233,459 | 31.69% | 552 | $10,098 |
| 2009 | 10,936 | 12.30% | 5,946,595 | 10.76% | $107,263,294 | 9.19% | 544 | $9,808 |
| 2010 | 13,229 | 20.97% | 5,890,507 | -0.01% | $105,342,577 | -0.02% | 445 | $7,963 |
| 2011 | 14,954 | 13.04% | 6,001,731 | 1.89% | $112,823,763 | 7.10% | 401 | $7,545 |
| 2012 | 17,031 | 13.89% | 6,052,179 | 0.84% | $123,471,753 | 9.44% | 355 | $7,250 |
| 2013 | 17,468 | 2.57% | 6,637,420 | 9.67% | $131,767,547 | 6.72% | 380 | $7,543 |
| 2014 | 19,524 | 11.77% | 7,905,939 | 19.11% | $156,040,431 | 18.21% | 405 | $7,992 |
| 2015* | 18,019 | -7.71% | 10,689,116 | 34.44% | $197,553,909 | 26.60% | 593 | $10,964 |
| 2016* | 16,328 | -9.38% | 11,516,867 | 7.74% | $212,698,759 | 7.67% | 705 | $13,027 |
| 2017 | 25,183 | 54.23% | 12,544,715 | 8.92% | $217,360,776 | 2.19% | 498 | $8,631 |
| 2018 | 27,583 | 9.53% | 13,865,209 | 10.53% | $230,924,408 | 6.24% | 503 | $8,372 |
| 2019 | 30,816 | 11.72% | 17,233,606 | 24.29% | $288,745,613 | 25.04% | 559 | $9,370 |
| 2020 | 31,893 | 3.49% | 18,495,127 | 7.3% | $318,796,963 | 10.41% | 580 | $9,996 |
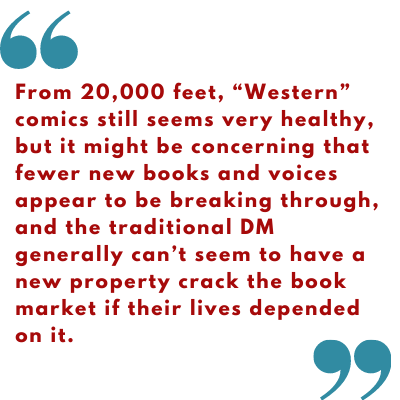
This is a great collective performance, but the growth slowed down this year compared to last… not that we shouldn’t be pleased with 7% growth in pieces on 3.5% growth of SKUs in the face of a global pandemic, but note that Manga was up by more than 40%, comparatively. From 20,000 feet, “Western” comics still seems very healthy, but it might be concerning that fewer new books and voices appear to be breaking through, and the traditional Direct Market establishment generally can’t seem to have a new property crack the book market if their lives depended on it.
Next, we’ll survey each of the publishers, and their best-selling titles, ranking them by the number of pieces they sold this year with the Top 750 of NPD BookScan. We’ll also look at the “long tail” for each entry discussing the entirety of NPD BookScan.
It is now the sixth year in the row that our #1 Western publisher in the NPD BookScan Top 750 is Scholastic. Given that they only started “doing” comics in 2005, and in that time they’ve grown to almost 40% of the market with under three hundred and fifty SKUs… well, you have to take your hat off for that. And at the end of the day, the current landscape makes me think they’re unlikely to get supplanted anytime soon unless kids collectively decide that they don’t like Raina and Dav, all at once.
Within the Top 750, Scholastic sells 6.9 million copies, from 84 placing books, which is excellent to be certain, however as year-over-year growth goes it’s actually a little anemic as 2019 sold 6.7m copies in the Top 750 from 77 books. It’s possible that Scholastic is starting to peak, though I would want another few data points before asserting that.
Every number reported here is only from retail sales through NPD BookScan reporters – this doesn’t count what I will assume are much larger numbers of copies that happen via the incredibly successful Scholastic Book Fairs, direct to students. Nor does this count any sales that are being done to elementary and middle school libraries, numbers that likely exceed retail sales. Possibly by a multiple?
Also consider that the next largest publisher sold a combined 1.07m copies in the Top 750, or only about a seventh of Scholastic’s volume. Or, how about this: if you combine the Top 750 performance of all of the Diamond Comic “Premiere” publishers (Boom!, Dark Horse, DC, Dynamite, IDW, Image and Marvel) those combined best-sellers only amount to under 1.5 million books, or well under a quarter of Scholastic alone. Scholastic, quite simply, dominates.
Scholastic has several imprints – besides the Graphix imprint, they also publish as AFK, Arthur A. Levine and Blue Sky, as well as “Scholastic”, itself (although most of the action is at Graphix)
In alphabetical order by imprint:
AFK gets one book into the Top 750, almost 6200 copies of “Bendy: Crack-Up Comics Collection” which is apparently material from the 1930s and 1940s
Arthur A. Levine places one book into the Top 750 just as they have for years, and it’s exactly the same book: just over 6200 copies of “The Arrival” by Shaun Tan.
Blue Sky is also just one book in the Top 750, and again it’s a perennial repeat – Dav Pilkey’s “Ook & Gluk, Kung-Fu Cavemen” shifting 12k copies, much of that you can assume being slipstream off the success of “Dog Man”.
The Graphix imprint has 66 placing titles, for just nearly 6.6m in sales, and is where the big hits live: the aforementioned “Dog Man” and all of Raina Telgemeier’s books, all of which are discussed up top. Thirteen volumes of Pilkey’s “Dog Man” (and spinoff “Cat Kid”) alone shifts just over 4 million books, to recap. Telgemeier sells “only” 1.1m. Every single book in the Scholastic Top Ten is from one of those two authors. As are sixteen of the Top Twenty. If Scholastic dominates for Publishers, then Raina and Dav dominate for authors. Nine of the Scholastic top ten are Pilkey books, with Telgemeier’s “Guts” at #5 being the sole thing standing between total domination at almost 300k sold.
The post-Telgemeier “Baby Sitter’s Club” continues great without her – “Karen’s Witch” from the spinoff “Baby-Sitters Little Sister” line, by Katy Farina, is #14 for Scholastic, with 138k sold, while “Karen’s Roller Skates” is #20 with 102k sold. The three Gale Galligan-adapted books sell more than 242k copies combined, with “Boy Crazy Stacey” (111k) being the #17 seller for Scholastic, with the other two pulling in well over 63k each.
The only other line in the Scholastic Top 20 is the adaptations of the “Wings of Fire” books: “The Dragonet Prophecy” (109k) comes in at #18.
While not in the Top 20 for them, Graphix also does fantastic with the new “I Survived” line, where “Titanic 1912” does almost 49k copies, and “Shark Attacks of 1916” brings in more than 42k. “Nat Enough” by Maria Scrivan does almost 40k of v1, and Kazu Kibuishi’s “Amulet” brings in nearly 34k with v1 (“The Stonekeeper”) and 21k with v2 (“The Stonekeeper’s Curse”). Also over the 20k mark is Jennifer Holm’s “Sunny Rolls the Dice” at 26k
Scholastic also publishes as “Scholastic”, straight up, and they place 15 more titles that way. The big hit is the first “Five Nights at Freddy’s” book, “The Silver Eyes) which sells almost 172k copies, which would make it #12 overall for Scholastic (the company), while in the over-20k category is what appears to be an adaptation of a “Super Diaper Baby” TV special, “The Horrifyingly Haunted Hack-a-Ween” at almost 24k, while Pilkey’s “Adventures of Super Diaper Baby” itself comes in just over 20k.
The Long Tail for Scholastic looks like this – they’re doing pretty well, even if growth is slowing a lot:
| Year | # of listed items | Percent Change | Total Unit Sold | Percent Change | Calculated Retail price | Percent Change | Av. Sale per title | Av $ per title |
| 2007 | 28 | —— | 203,900 | —— | $2,018,694 | —– | 7282 | $72,096 |
| 2008 | 39 | 39.29% | 346,134 | 69.76% | $3,498,012 | 73.28% | 8875 | $89,693 |
| 2009 | 52 | 33.33% | 432,070 | 24.83% | $4,654,686 | 33.07% | 8309 | $89,513 |
| 2010 | 60 | 15.38% | 361,086 | -16.43% | $4,084,718 | -12.25% | 6018 | $68,079 |
| 2011 | 72 | 20.00% | 419,010 | 16.04% | $4,708,860 | 15.28% | 5819 | $65,401 |
| 2012 | 76 | 5.56% | 325,088 | -22.42% | $3,955,249 | -16.00% | 4277 | $52,043 |
| 2013 | 91 | 19.74% | 437,590 | 34.61% | $5,365,921 | 35.67% | 4809 | $58,967 |
| 2014 | 97 | 6.59% | 846,277 | 93.39% | $10,204,175 | 90.17% | 8725 | $105,198 |
| 2015* | 140 | 44.33% | 1,449,296 | 71.26% | $17,170,714 | 68.27% | 10,352 | $122,648 |
| 2016* | 131 | -6.43% | 1,940,760 | 33.91% | $23,919,704 | 39.31% | 14,815 | $182,593 |
| 2017 | 166 | 26.72% | 2,823,345 | 45.55% | $33,884,541 | 41.66% | 17,008 | $204,124 |
| 2018 | 224 | 34.94% | 4,623,212 | 63.75% | $54,645,209 | 61.27% | 20,639 | $243,952 |
| 2019 | 270 | 20.54% | 6,868,794 | 48.57% | $88,878,195 | 62.65% | 25,440 | $329,179 |
| 2020 | 343 | 27.03% | 7,164,029 | 4.30% | $95,638,289 | 7.61% | 20,886 | $278,829 |
Scholastic has one book over a million copies (!), another over 700k, one more over 500k, another six over 250k, seven more over 100k, seven more over 50k, fourteen more over 20k, and another staggering sixteen over 10k. Whew! Any other publisher would be satisfied with a tiny fraction of that (as you will see if you keep reading along)
Scholastic seems more and more like an unstoppable juggernaut to me: the vast majority of their portfolio is extremely likely to go on to “perennial seller” status. And I continue to dream about what might happen if they decided to do two streams of revenue and serialized first before eventual collection.
Growing a slot to #2 is the first of the traditional “Big Five” book publishers: Penguin Random House. They land forty-three titles, selling 1.05 million copies for just over $16m in calculated gross sales.
Like a lot of the “big five” book publishers, these companies have lots and lots of imprints built up over decades of publishing books. Penguin Random House, as best as I can tell, has twelve distinct imprints that appear in the Top 750 list for 2020 – Alfred A. Knopf, Ballantine, Del Rey, Dial, Nan A. Talese, One World, Pantheon, Random House Books For Younger Readers, Random House Graphic, Triangle, Tundra, and Viking Books For Young Readers.
They’re also, in the long tail: (deep breath!) Ace, Bantam, Berkley, Blue Snake, Broadway Books, Clarkson N. Potter, Crown, Doubleday, Dutton, Emblem, Golden, Gotham Books, G.P. Putnam & Sons, Grossett & Dunlap, Hudson Street, InkLit, Knopf, McClelland & Stewart, Montena, New American Library, One World, Penguin, Philomel, Plume, Price Stern Sloan, Puffin, Putnam, Razorbill, Riverhead, Rodale, Schocken, Schwartz & Wade, Tarcherperigee, Ten Speed, Three Rivers, Villard, Waterbrook, Watson-Guptill and Yearling. (whew!) However, they are not (Brian writes down here so he remembers this research next year) the PRH-distributed-only Angry Robot, Beacon, Campfire, Charlesbridge, Dragonfly, Fawcett, Frog In Well, Library of America, New York Review, Nobrow, North Atlantic, Overlook Press, Powerhouse, Quirk, Rizzoli, Sasquatch, Seven Stories Press, Shambhala, Smithsonian, Soft Skull, Sunday Press, Universe, or Verso (I am sure I missed a few!!)
Looking at those imprints in alphabetical order, within the Top 750:
Alfred A. Knopf Books For Younger Readers places three books into the Top 750, Beginning with 20k copies of “White Bird: A Wonder Story”,which places as #14 for Penguin Random House overall. This is followed by #19, “Doodleville” by Chad Sell for 13k. They also sell the usual 6k copies of the perennial “Lunch Lady and the Cyborg Substitute”
Ballantine places three titles in the Top 750: They are all different “Garfield Fat Cat 3-Pack” sets ranging from 6700-7500 copies each.
Del Rey publishes the Dave Wenzel adaptation of “The Hobbit” for about 15k copies, and is #17 overall for PRH. This is another solid, steady perennial volume that had placed for years and years.
Dial places three books, all by Victoria Jamieson: “When Stars Are Scattered” (#7 for PRH) at almost 43k copies, “Roller Girl” (#15) at about 20k, and “All’s Faire in Middle School” with 8k.
Nan A. Talese sells about 8700 copies of the adaptation of “The Handmaid’s Tale”.
One World does 7800 copies of “Good Talk: A Memoir in Conversations”
Pantheon is their “literary” comics wing, and has some of PRH’s steadiest-sellers. There are seven placing in 2020, including Marjane Satrapi’s “Persepolis” (#5 for PRH overall) which sells 51k of volume 1. As always surprises me with Pantheon books, way way less people read v2, only about a tenth at 5200 copies, not even making it into the Top 750! But the Complete edition (#13) does 21k. Similarly, Art Spiegelman’s “Maus” continues its multi-decade success with 22k copies of v1 (#12), 9100 of v2, and 25k copies of the Complete edition (#10). Pantheon also does well with almost 8100 copies of the adaptation of “Anne Frank’s Diary”.
Random House Books For Younger Readers (Catchy imprint name!) places twelve titles into the Top 750, led by Judd Winick’s “Hilo”, where v6 (#8 for PRH overall) does 34k, v1 (#20 overall) does 13k, v5 does 11k, v2 and v4 essentially tie at 10k, and v3 comes in at 9400 copies. They also do great with “Real Pigeons Fight Crime” by Andrew McDonald (#16) at 18k, “Pizza and Taco: Who’s the Best?” by Stephen Shaskan (#18) at 13k, and the adaptation of “City of Ember” over 10k. Bringing up the back is three volumes of “5 World”, ranging from 6k to 7900.
Random House Graphic (which on some level is a rebrand for the previous imprint) launches Lucy Knisley’s “Stepping Stones” at 12k, and Sophie Escabasse’s “Witches of Brooklyn at 6800)
Triangle brings us “Sex is a Funny Word: A Book About Bodies, Feelings, and You” by Cory Silverberg which sells about 7k
Tundra has six placing books with Ben Clanton’s “Narwahl: Unicorn of the Sea” series, another juvie-aimed title. “Narwhal’s Otter Friend” (#4 for PRH overall) sells an impressive 55k in paperback, while also selling 13k in hardcover, the first volume, “Unicorn of the Sea” (#6 overall) sells 47k in paper, and 8k in hardcover, “Peanut Butter and Jelly” (#9) sells 32k, while “Super Narwhal and Jelly Jolt” (#11) does about 23k
And finally, Viking Books For Young Readers has Penguin Random House’s best-selling books in 2020, “The Last Kids on Earth” by Max Brallier, with “June’s Wild Flight” (#1) selling almost 145k, “The Skeleton Road” (#2) selling 129k, and “The Midnight Blade” (#3) sliding just over the line of 100k. That’s a real big launch.
Penguin Random House formed out of a merger in 2013 – prior to that they were separate publishers Penguin and Random House. Here’s what the Long-Tail for the combined Penguin Random House looked like in 2019:
| Year | # of listed items | % Change | Total Pieces | % Change | Calculated Retail Value | % Change | Av. Sale per title | Av $ per title |
| 2013 | 282 | ——- | 447,174 | ——- | $7,259,364 | ——- | 1,586 | $25,742 |
| 2014 | 252 | -10.64% | 428,634 | -4.15% | $7,415,712 | 2.15% | 1,701 | $29,427 |
| 2015* | 450 | 78.57% | 513,611 | 19.83% | $8,517,761 | 14.49% | 1,141 | $18,928 |
| 2016* | 293 | -34.88% | 435,877 | -15.13% | $7,150,087 | -16.06% | 1,488 | $24,403 |
| 2017 | 409 | 39.59% | 664,858 | 52.53% | $10,136,224 | 41.76% | 1,626 | $24,783 |
| 2018 | 613 | 49.88% | 760,314 | 14.36% | $11,136,058 | 9.86% | 1,240 | $18.166 |
| 2019 | 635 | 3.59% | 1,013,092 | 33.25% | $15,745,448 | 41.39% | 1,595 | $24,796 |
| 2020 | 551 | -13.23% | 1,380,328 | 36.25% | $21,157,243 | 34.37% | 551 | $38,398 |
However, I’m not willing to pull an “We’ve always been at war with Eastasia” moment, so let’s look at the individual pieces of the past. This is what Penguin Putnam (Ace, Berkley Books, Dial, Dutton, Gotham Books, Grossett & Dunlap, Hudson Street, InkLit, New American Library, Penguin, Philomel, Plume, Price Stern Sloan, Puffin, Putnam, Razorbill, Riverhead and Viking) used to look like alone)
| Year | # of listed items | % Change | Total Pieces | % Change | Calculated Retail Value | % Change | Av. Sale per title | Av $ per title |
| 2007 | 18 | —— | 13,545 | —— | $178,260 | —— | 753 | $9,903 |
| 2008 | 28 | 55.56% | 28,606 | 111.19% | $310,856 | 74.38% | 1022 | $11,102 |
| 2009 | 39 | 39.29% | 40,288 | 40.84% | $444,928 | 43.13% | 1033 | $11,408 |
| 2010 | 45 | 15.38% | 50,628 | 25.67% | $623,650 | 40.17% | 1125 | $13,859 |
| 2011 | 53 | 17.78% | 123,749 | 144.43% | $1,576,161 | 152.73% | 2335 | $29,739 |
| 2012 | 60 | 13.21% | 121,769 | -1.60% | $1,499,660 | -4.85% | 2029 | $24,994 |
This is what Random House (Alfred A. Knopf, Ballantine, Bantam, Broadway, Crown, Del Rey, Doubleday, Pantheon, Random House, Schocken, and Three Rivers) looked like alone:
| Year | # of listed items | % Change | Total Pieces | % Change | Calculated Retail value | % Change | Av. Sale per title | Av $ per title |
| 2007 | 74 | — | 216,580 | — | $2,890,347 | — | 2,927 | $39,059 |
| 2008 | 77 | 5.47% | 383,105 | 76.89% | $5,698,922 | 97.17% | 4,975 | $74,012 |
| 2009 | 109 | 41.56% | 405,598 | 5.87% | $5,398,890 | -5.26% | 3,721 | $49,531 |
| 2010 | 132 | 21.10% | 389,410 | -3.99% | $5,831,814 | 8.02% | 2,950 | $44,180 |
| 2011 | 144 | 9.09% | 397,143 | 1.99% | $6,356,212 | 8.99% | 2,760 | $44,140 |
| 2012 | 185 | 28.47% | 375,254 | -5.51% | $7,124,794 | 12.09% | 2,028 | $38,512 |
Penguin Random House has three titles over 100k, another two titles over 50k, nine additional books over 20k, and another twelve books over 10k.
Just barely slipping back a step to the #3 largest Western comics publisher in NPD BookScan Top 750 in 2020 is another of the traditional “big five” book publishers: HarperCollins. Just 6512 copies separated Penguin Random House and HarperCollins this year. Harper places twenty-nine books into the Top 750 for a total of 1.07 million copies sold, and a calculated retail cover price of $17 million. There’s a lot of imprints with the word “Harper” in the title in the Long Tail (Harper, Harper Paperbacks, Harper Teen, Harper Festival, Harper Teen, and so on), and Harper is also Blazer & Bray, Quill Tree and William Morrow (in the Top 750); as well as Amistad, IT books and Zondervan (out of the Top 750)
At Balzer & Bray they place seven titles into the Top 750, and it’s mostly all about Terri Libenson. “Becoming Brianna” in paperback is the #4 book for Harper overall), and sells a reported 73k. It also does another 16k in hardcover (#15). “Just Jamie” (#7) sells 48k, “Invisible Emmie” (#8) sells 40k, “Positively Izzy” (#11) sells 25k, and they even score with a box set of “Emmie” and “Izzy” (#19) that sells about 9500 copies. In addition to the Libenson stampede, they launch Robin Ha’s “Almost American Girl” to 9k.
At the various Harper-named imprints, their biggest hit is from gaming stars from YouTube. FGTeev’s “Into the Game!” (#2 for Harper overall) sells 176k copies. “Minecraft”-inspired PopularMMOs is also hefty, with 28k copies of “Zombies’ Day Off” (#9), “A Hole New World” (#10) shifts 26k, while “Enter The Mine” (#14) sells 16k
Harper also does well with “Sapiens: A Graphic History” (#12) which sells 19k in paperback, and another 7700 copies in hardcover, the adaptation of “To Kill A Mockingbird” (#13) which sells 18k copies, and the “Warriors” series, where the best-seller, “A Shadow in Riverclan” (#17) sells 12k. Another four “Warriors” books also place in the Top 750, selling between 6100 and 7200 copies.
The Quill Tree imprint has an enormous smash hit with Jerry Craft’s “New Kid” with 222k sold in paperback (HarperCollins #1 best-seller), and another 9500 in hardcover (#20). Craft’s “Class Act” (#6) also does well with 53k sold. And Noelle Stevenson’s perennial “Nimona” (#16)
Finally, the William Morrow imprint continues to do excellent with Nathan Pyle’s “Strange Planet” strip (#3) which sells 119k, “Stranger Planet” (#5) which sells 70k, and the forever perennial “Understanding Comics” by Scott McCloud (#18), which sells 12k copies.
Nothing else is over 10k, so here is the Long Tail:
| Year | # of listed items | Percent Change | Total Unit Sold | Percent Change | Calculated Retail value | Percent Change | Av. Sale per title | Av $ per title |
| 2007 | 18 | —— | 36,940 | —— | $600,540 | —– | 2052 | $33,363 |
| 2008 | 36 | 100.00% | 48,264 | 30.66% | $863,808 | 43.84% | 1341 | $23,995 |
| 2009 | 42 | 16.67% | 81,774 | 69.43% | $1,308,891 | 15.53% | 1947 | $31,164 |
| 2010 | 41 | -2.38% | 64,429 | -21.21% | $719,328 | -45.04% | 1571 | $17,545 |
| 2011 | 50 | 21.95% | 75,394 | 17.02% | $1,083,609 | 50.64% | 1508 | $21,672 |
| 2012 | 80 | 60.00% | 159,573 | 111.65% | $2,113,744 | 95.07% | 1995 | $26,422 |
| 2013 | 68 | -15.00% | 197,595 | 23.83% | $2,667,933 | 26.22% | 2906 | $39,234 |
| 2014 | 115 | 69.12% | 158,193 | -19.94% | $2,398,836 | -10.09% | 1376 | $21,042 |
| 2015* | 109 | -5.22% | 188,181 | 18.96% | $2,646,378 | 10.32% | 1726 | $24,279 |
| 2016* | 108 | -0.09% | 261,183 | 38.79% | $4,473,589 | 69.05% | 2418 | $41,422 |
| 2017 | 107 | -0.09% | 357,972 | 37.06% | $5,530,994 | 23.64% | 3346 | $51,692 |
| 2018 | 148 | 38.32% | 517,800 | 44.65% | $7,506,751 | 35.72% | 3499 | $50,721 |
| 2019 | 154 | 4.05% | 891,701 | 72.21% | $13,894,052 | 85.09% | 5790 | $90,221 |
| 2020 | 220 | 42.86% | 1,219,785 | 36.79% | $19,396,157 | 39.60% | 5544 | $88,164 |
Harper has one book over 200k, two over 100k, one over 75k, two more over 50k, a further five books over 20k, and another seven more over 10k
Coming in at #4 is Holtzbrinck, which owns Macmillan, another of the “big five”, and is also one of those publishers with lots and lots (and lots) of imprints: FirstSecond, and Square Fish are the only three to make the Top 750, but there are others down into the Long Tail as well – I have also identified Feiwel & Friends, Henry Holt, Hill + Wang, Metropolitan, Picador, Roaring Brook, Rodale Press, St. Martins Griffin, Times books, and Tor. Holtzbrinck also distributes several other publishers they don’t own (including Bloomsbury, Drawn & Quarterly, Papercutz, and Seven Seas) Holtzbrinck-owned companies placed 30 titles in the Top 750, for about 648k and about a calculated $9.6m gross combined.
By imprint, we start alphabetically with Farrar Straus Giroux which has a single book in the Top 750: Coming in as the #19 overall seller for Holtzbrinck, “Agent Moose” by Mo O’Hara sells about 9300 copies.
FirstSecond is their strongest imprint, with 27 books placing into the Top 750, and where they score their biggest hit with Shannon Hale’s juvie-focused “Best Friends” (#1 overall) with 123k. This is a sequel to “Real Friends” (#4) which pulls in 45k. This is followed closely by John Patrick Green’s “Investigators” (#2) which racks and impressive 76k sold, while the sequel, “Take The Plunge” (#7) sells 32k.
The for-adults “The Adventure Zone” comes next, where “Petals to the Metal in softcover (#3) sells 47k, with an addition 24k in hardcover (#8), “Murder on the Rockport Limited!” (#9) at 21k, and “Here There Be Gerblins” (#10) sells barely twenty-nine fewer copies than that.
Jen Wang’s “Stargazing” (#6) sells 33k, while her “The Prince and The Dressmaker” (#12) sells 14k. Gene Luen Yang’s “Dragon Hoops” (#11) shoots a respectable 17k. Rainbow Rowell’s “Pumpkinheads” (#13) rolls in with 12k, Vera Brosgol’s “Be Prepared” (#14) sells just one single copy less than the previous, and Kat Leyh’s “Snapdragon” (#15) is within a hundred copies of both of them. The back of FirstSecond’s pack has Ben Hatke’s “Mighty Jack & Zita the Space Girl” (#16) at 11k, and just “Mighty Jack” by himself (#17) at 9600. While book #20 is “Go With The Flow” by Karen Schneemann at 9200 copies.
Square Fish’s deal is cheaper repackaging from other imprints (I don’t personally get this business model – the successful books woulda sold fine at full price!) and has just two placing titles. Gene Yang’s “American Born Chinese” (#5 overall) does just over 37k, while Hope Larson’s adaptation of “A Wrinkle In Time” (#18) brings in just over 9300 sold.
Here’s Holtzbrinck’s Long Tail (again, I might have missed an imprint somewhere – trying to tease them all out from their Byzantine org chart is a difficult task).
| Year | # of listed items | Percent Change | Total Unit Sold | Percent Change | Calculated Retail value | Percent Change | Av. Sale per title | Av $ per title |
| 2007 | 39 | —— | 31,452 | —— | $559,681 | —– | 806 | $14,351 |
| 2008 | 66 | 69.23% | 63,473 | 101.81% | $1,132,767 | 102.40% | 962 | $17,163 |
| 2009 | 88 | 33.34% | 84,090 | 32.48% | $1,438,044 | 26.95% | 956 | $16,341 |
| 2010 | 108 | 22.73% | 68,599 | -18.42% | $1,085,311 | -24.53% | 635 | $10,049 |
| 2011 | 139 | 28.70% | 114,243 | 66.54% | $1,794,084 | 65.31% | 822 | $12,907 |
| 2012 | 165 | 18.71% | 126,745 | 10.94% | $2,077,143 | 15.78% | 768 | $12,589 |
| 2013 | 187 | 13.33% | 142,375 | 12.33% | $2,395,569 | 15.33% | 761 | $12,811 |
| 2014 | 222 | 18.72% | 190,682 | 33.93% | $3,096,858 | 23.27% | 859 | $13,950 |
| 2015* | 104 | -53.15% | 99,223 | -47.96% | $1,804,001 | -41.75% | 954 | $17,346 |
| 2016* | 272 | 161.54% | 272,668 | 174.80% | $4,240,075 | 135.04% | 1,002 | $15,589 |
| 2017 | 336 | 23.53% | 437,258 | 60.36% | $6,616,130 | 56.04% | 1,301 | $19,691 |
| 2018 | 427 | 27.08% | 723,096 | 65.37% | $11,701,046 | 76.86% | 1,693 | $27,403 |
| 2019 | 494 | 15.70% | 946,680 | 30.92% | $15,814,819 | 35.16% | 1,916 | $32,014 |
| 2020 | 552 | 11.74% | 1,022,598 | 8.02% | $16,455,419 | 4.05% | 1,853 | $29,811 |
Holtzbrinck has one book over 100k, one over 75k, eight more over 20k, and eight others over 10k.
It’s a massive surge forward in the Western Top 10 up for our first “Direct Market” publisher: Dark Horse Comics is now at #5 (up from #7) They place 48 titles into the Top 750 for 632k, and $13.3m in calculated retail value.
This is an excellent level of growth for Dark Horse, and comes from a well-mixed lineup of products. At the top of the list is the “Minecraft” licensed comics – the first volume (#1 for Dark Horse overall) sells 47k while the second launches at about 6200 copies. There’s also “Wither Without You” which sells around 7800 copies.
Dark Horse’s second big property is the creator-owned “The Umbrella Academy” written by Gerard Way where the first volume, “Apocalypse Suite” (#2) sells about 43k in paperback, while the larger hardcover sells around 10k copies. In addition, v3 “Hotel Oblivion” (#4) sells 31k, while v2 “Dallas” sells just under at 30k in paperback (#5) and some 6100 copies in hardcover.
 But the real MVP for Dark Horse in 2020 is “Avatar: The Last Airbender”, which comes in up to three formats for each storyline, most of which are placing at the top. For example, “The Promise” has an Omnibus edition (#3) which sells 33k, as well as the Library Edition hardcover (#11) which sells 17k. But those books are comprised of three thinner paperbacks which also do great, including v1 (#12) selling 14k, v2 (#18) selling 12k, and v3 selling 10k. All combined, that one storyline sold about 86k copies in 2020. But there’s also “The Search”, whose Omnibus (#6) sells 22k, Hardcover (#9) sells 18k, but component v1 (#19) sells almost 11k, v2 sells 7k, and v3 sells 6400, as well as “The Lost Adventures” in hardcover (#14) and softcover (#16) both for around 12k, and “Imbalance” which knocks out 18k in hardcover (#8) where the component volumes shift between 6200 and 6700 copies each. And there are still five more volumes
in the Top 750, which sell between 7k and very nearly 10k copies each. This is Dark Horse’s steadiest current property – though I would strongly urge them to go and fix their metadata because there is flatly no consistency in how the titles are named and what and how to read them, and I suspect they are selling fewer copies as a result.
Another creator-driven book comes up next with “Critical Role”, where “Origins Volume I” (#7) sells 18k, and “Origins Volume II” (#10) sells 17k, and the combined hardcover shifts around 9600 copies.
Then it is back to licensed books through the end of Dark Horse’s Top Twenty – “Plants Vs Zombies”, where v1 (#13) sells almost 13k, and v15 (#15) sells around 12k. A little deeper in v2 sells about 8400 copies, while v3 does 6400. And there is also “The Legend of Korra”, which like “Avatar: TLA” there are also multiple formats – the most successful storyline is “Ruins of the Empire” where v3 (#17) sells about 12k, v1 (#20) sells about 11k, and v2 shifts about 9700 copies, while the hardcover of that same material is a tiny hair over 10k. “Turf Wars” does a little less (all under 9k), but places four more editions in the Top 750 NPD BookScan charts. And the final property in the over-10k club is “The Witcher Omnibus” which sells eleven copies over that line.
Here’s what Dark Horse’s Western performance looks like in the Long Tail. It’s a giant boom for them, with a more than doubling of the bottom line!
| Year | # of listed items | Percent Change | Total Unit Sold | Percent Change | Calculated Retail value | Percent Change | Av. Sale per title | Av $ per title |
| 2007 | 597 | —— | 413,022 | —— | $7,607,264 | —– | 692 | $14,745 |
| 2008 | 734 | 22.95% | 552,815 | 33.85% | $9,329,828 | 22.64% | 753 | $12,711 |
| 2009 | 798 | 8.72% | 455,924 | -17.53% | $7,757,240 | -16.86% | 571 | $9,721 |
| 2010 | 955 | 19.67% | 445,248 | -2.34% | $7,852,063 | 1.22% | 466 | $8,222 |
| 2011 | 1025 | 7.33% | 389,514 | -12.52% | $7,102,710 | -9.54% | 380 | $6,929 |
| 2012 | 1133 | 10.54% | 377,322 | -3.13% | $6,907,772 | -2.74% | 333 | $6,097 |
| 2013 | 1238 | 9.27% | 383,391 | 1.61% | $7,391,831 | 7.01% | 310 | $5,971 |
| 2014 | 1420 | 14.70% | 421,708 | 9.99% | $8,982,411 | 21.52% | 297 | $6,326 |
| 2015* | 947 | -33.31% | 376,231 | -10.78% | $8,120,937 | –9.59% | 397 | $8,575 |
| 2016* | 877 | -7.39% | 461,297 | 22.61% | $9,076,526 | 11.77% | 526 | $10,350 |
| 2017 | 1598 | 82.21% | 478,658 | 3.76% | $9,256,795 | 1.99% | 300 | $5,793 |
| 2018 | 1615 | 1.06% | 485,919 | 1.52% | $9,410,362 | 1.66% | 301 | $5,827 |
| 2019 | 1612 | -0.18% | 459,996 | -5.33% | $9,617,364 | 2.20% | 285 | $5,966 |
| 2020 | 1686 | 4.59% | 971,551 | 111.21% | $20,408,830 | 112.21% | 576 | $12,105 |
In the Long Tail Western Dark Horse has its best year ever yet again.
Dark Horse’s Manga offerings are up in that section. Dark Horse is one of the rare publishers that does a significant business in both Eastern and Western comics, and I’m sure they’d prefer all of their numbers to be represented together. In which case, their Long Tail actually looks like this:
| Year | # of listed items | Percent Change | Total Unit Sold | Percent Change | Calculated Retail value | Percent Change | Av. Sale per title | Av $ per title |
| 2007 | 938 | —— | 662,965 | —— | $10,936,728 | —– | 707 | $11,660 |
| 2008 | 1075 | 14.61% | 801,796 | 20.94% | $12,506,698 | 14.36% | 746 | $11,634 |
| 2009 | 1253 | 16.56% | 682,421 | -14.89% | $10,672,933 | -14.66% | 545 | $8,518 |
| 2010 | 1428 | 13.97% | 639,742 | -6.25% | $10,485,140 | -1.76% | 448 | $7,343 |
| 2011 | 1522 | 6.58% | 578,843 | -9.52% | $9,704,940 | -7.44% | 380 | $6,376 |
| 2012 | 1626 | 6.83% | 489,695 | -15.40% | $8,538,810 | -12.02% | 301 | $5,251 |
| 2013 | 1759 | 8.18% | 486,929 | -0.56% | $9,070,394 | 6.23% | 277 | $5,157 |
| 2014 | 1979 | 12.51% | 522,602 | 7.33% | $10,599,661 | 16.86% | 264 | $5,356 |
| 2015* | 1250 | -36.84% | 511,675 | -2.09% | $10,359,104 | -2.27% | 409 | $8,287 |
| 2016* | 1102 | -11.84% | 635,595 | 24.22% | $11,367,881 | 9.74% | 577 | $10,316 |
| 2017 | 2125 | 92.83% | 716,747 | 12.77% | $20,624,676 | 81.43% | 337 | $9,706 |
| 2018 | 2146 | 0.99% | 709,929 | -0.09% | $12,989,497 | -37.02% | 331 | $6,053 |
| 2019 | 2023 | -5.73% | 977,155 | 37.64% | $19,467,752 | 49.87% | 483 | $9,623 |
| 2020 | 2158 | 6.67% | 1,402,313 | 43.51% | $31,520,184 | 61.91% | 650 | $14,606 |
Dark Horse, on the Western charts, has six titles over 20k, and eighteen more over 10k. Combined with Manga, it would be seven over 20k, and twenty-six over 10k.
Next in the Top 750 at #6 publisher is Andrews McMeel. Andrews is a publisher that sometimes has frustrated me by how they’ve been represented by NPD BookScan – as I noted, it used to be that “humor” books like “Far Side” and “Calvin & Hobbes” used to rule the NPD BookScan charts. Until, one day, poof! Almost of those books disappeared entirely from the dataset I was given, throwing off a whole lot of my comparables. And, for the most part, comic strip reprints have stayed out of these charts for half a decade. But, they’ve started creeping back into the listings for the last few years. I’m actually fine with comic strips and comic books co-existing in the same places – at least they’re both comics – but the inconsistency just drives me nucking futz.
I found 28 titles from Andrews in the Top 750 in 2018, for 500k copies and $11.1 million in calculated dollars, but clearly that number would scale up to some large degree if it listed all of the strip collections they publish. What’s interesting about Andrews McMeel is that, for the most part, their “graphic novels” are reformatted/repackaged newspaper strips. In other words, this is basically the other paid-for way one can serialize work: through syndicated newspaper pages
2020’s big star for Andrews McMeel continues to be Dana Simpson’s “Pheobe and Her Unicorn” where v1 is the #1 overall best-seller for them, and sells just over 58k copies. V10 (#3) sells 34k, v11 (#4) sells 31k, v2 (#6) sells 24k, v12 (#8) sells 19k, the Omnibus of v1 & v2 combined (#9) sells 19k, a boxed set of the first four (#10) also sells 19k, v4 (#13) sells 15k, v3 (#14) sells 14k, v5 (#18) sells 12k, with v6 (#19) at around 11k and v8 (#20) selling 9400 copies. That’s a whole lot of unicorns!
Also succeeding for Andrews McMeel are Catana Chetwynd’s “Snug” (#2), selling 55k, Sarah Andersen’s “Fangs” (#7) selling 22k, an adaptation of “Anne of Green Gables” (#12) with almost 17k, and a fair amount of Lincoln Peirce’s “Big Nate”, where v18 (#15) sells around 13k, and v19 (#17) does around 12k. There are six more “Big Nate” books in the Top 750, but none of the rest sell more than 8k copies.
And then finally in the “traditional newspaper strip” category, at #5 for Andrews McMeel is 28k copies of “The Complete Calvin and Hobbes” as a boxed set (because of that $125 cover price that works out to be the #8 book of all of NPD BookScan by dollars), a “Doonesbury” book (“Lewser!”) (#11) with 17k, and the boxed set of “The Complete Far Side” (#16) with 13k sold – again, by dollars that would be the #26 best-selling book on all of NPD BookScan because of the price. But most of the various components of those boxed sets, or other “Doonesbury” books are not on the list I was given. Frustrating!
Andrews McMeel’s Long Tail chart is just about the most useless one of all because they publish a whole lot of comics (humor strips, like “Calvin & Hobbes”) where the BISAC changed to something we’re having a hard time properly getting – almost certainly they’re doing several times better than this chart would suggest because of those books. Further, things appear and disappear in a way I’ve never been able to make sense of – it might be them changing BISACs after the fact. Most of my comparatives are terrible and counterproductive here, and I really apologize for the crappiness of my data in this specific instance.
| Year | # of listed items | Percent Change | Total Unit Sold | Percent Change | Calculated Retail Value | Percent Change | Av. Sale per title | Av $ per title |
| 2007 | 22 | —— | 29,835 | —— | $461,238 | —– | 1,356 | $20,965 |
| 2008 | 20 | -9.09% | 25,115 | -15.82% | $388,965 | -15.67% | 1,256 | $19,448 |
| 2009 | 21 | 5.00% | 26,205 | 4.34% | $401,982 | 3.35% | 1,248 | $19,142 |
| 2010 | 19 | -9.52% | 47,181 | 80.05% | $544,852 | 35.54% | 2,483 | $28,676 |
| 2011 | 17 | -10.53% | 116,850 | 147.66% | $1,222,171 | 124.31% | 6,874 | $71,892 |
| 2012 | 31 | 82.53% | 225,546 | 93.02% | $2,737,935 | 124.02% | 7,276 | $88,320 |
| 2013 | 43 | 38.71% | 343,681 | 52.38% | $3,747,799 | 36.88% | 7,993 | $87,158 |
| 2014 | 59 | 37.21% | 373,713 | 8.74% | $4,387,252 | 17.06% | 6,334 | $74,360 |
| 2015* | 76 | 28.81% | 502,061 | 34.34% | $5,950,368 | 35.63% | 6,606 | $78,294 |
| 2016* | 85 | 11.84% | 472,145 | -5.96% | $5,147,673 | -13.49% | 5,555 | $60,561 |
| 2017 | 140 | 64.71% | 520,554 | 10.25% | $5,644,031 | 9.64% | 3,718 | $40,315 |
| 2018 | 273 | 95.00% | 735,184 | 41.23% | $11,862,349 | 210.18% | 2,693 | $43,452 |
| 2019 | 277 | 1.46% | 611,784 | -16.79% | $11,078,977 | -6.60% | 2,209 | $39,996 |
| 2020 | 288 | 3.97% | 644,390 | 5.33% | $13,539,999 | 22.21% | 2,237 | $47,014 |
Andrews McMeel has two books over 50k, five more over 20k, and twelve others over 10k.
Coming in as the #7 publisher in the Top 750 is DC Entertainment. DC spent a really long time as the #1 Western publisher before losing it to Scholastic, and was at least #2 until 2018. That they’re beaten in the book market by Dark Horse is pretty surprising to me, but they’re having a hard time adapting to the new realities of the wider book market.
In 2020 they placed just 29 titles in the Top 750, for 442k units, and $10.3 million in calculated retail price. DC has four charting imprints: plain “DC” itself, DC Black Label, DC Ink and Vertigo. Deep in the long tail we can still track America’s Best Comics, Mad, Wildstorm, Paradox, Minx and CMX – makes you wonder how stores still have those handful of copies to sell of imprints that in some cases have been defunct for two decades now!
Here’s a year-to-year comparison chart of the Top 750 (Because I started from my first NPD BookScan survey with a Direct Market bias, but I hate throwing away data):
| Year | # of placing titles | Unit sales | Calculated Retail price |
| 2003 | 74 | 336,569 | $6,151,258 |
| 2004 | 39 | 179,440 | $3,135,983 |
| 2005 | 42 | 298,484 | $5,440,001 |
| 2006 | 59 | 551,160 | $10,246,082 |
| 2007 | 58 | 487,467 | $9,953,976 |
| 2008 | 71 | 1,015,864 | $19,805,098 |
| 2009 | 93 | 1,223,733 | $24,061,834 |
| 2010 | 96 | 648,403 | $12,523,128 |
| 2011 | 107 | 660,706 | $13,083,378 |
| 2012 | 104 | 688,870 | $14,811,979 |
| 2013 | 130 | 767,686 | $15,620,981 |
| 2014 | 131 | 931,239 | $19,207,755 |
| 2015* | 119 | 1,074,304 | $21,701,088 |
| 2016* | 117 | 1,234,047 | $23,203,071 |
| 2017 | 101 | 827,544 | $15,234,525 |
| 2018 | 47 | 360,414 | $7,810,753 |
| 2019 | 33 | 413,923 | $9,691,574 |
| 2020 | 29 | 442.163 | $10,332,226 |
2020 has the lowest number of DC books placing in the Top 750, since we’ve ever tracked this.
DC’s #1 book is the more recent paperback edition of “Watchmen” at 52k – and there are some 1200 copies of the cheaper $19.99 version of the paperback that also sold in 2020. They also sell about 9800 copies of the hardcover (#19). Alan Moore, a writer who vowed to never work with the company ever again since 1989, is also responsible for the #10 best-seller (“V For Vendetta” – 16k), as well as #8 (“Batman: The Killing Joke” – 17k). Imagine if he hadn’t felt they betrayed him and he was still producing work for them? All of these books are well over thirty years old at this point. The kind-of sequel by Geoff Johns, “Doomsday Clock” comes in at 12k for v2 (#17), and just over 9k for v1 (and 6800 copies of the ”complete edition”)
DC’s #2 book is from what was formerly known as the DC Ink (young adult) imprint – “Teen Titans: Raven”, which shifts 40k copies. This is followed closely by “Teen Titans: Beast Boy” (#3) with 28k
A few more recent and modern (and mostly Batman-related) books come next: “Harleen” by Stjepan Sejic (#4) with 24k sold, “Batman: Three Jokers” by Geoff Johns (#5) with 23k, The Scott Snyder penned “The Batman Who Laughs” (#7) and “Batman: Last Knight on Earth” (#9) both around 17k, “DCeased” by Tom Taylor (#14), “Batman: White Knight” by Sean Murphy (#16) at 12k, and “Batman: Damned” by Brian Azzarello (#18) just over 10k. I would argue that almost every one of this tranche is more creator-driven then character, per se. Feel free to argue.
In a marketplace where all of the strongest books are aimed at middle readers, DC’s first success here comes at #6 with the Shannon Hale penned “Diana: Princess of the Amazons” selling 19k copies. There’s also a genuinely rare success introducing a brand-new character with the debut of “Primer” (#15) which sells 12k copies. Bringing up the back of DC’s Top Twenty is a boxed set of “Teen Titans Go!” (#20) selling about 9500 copies. I am a little surprised that the superb “Superman Smashes the Klan” by Gene Yang and Gurihiru only sells a hair over 8k in its first round. That’s it for Middle Readers from DC in the NPD BookScan Top 750.
And filling out DC’s best sellers are more multiple-decades-old books: “Batman: The Long Halloween” (#11) which sold almost 15k, and “Batman: Year One” (#13) with 13k – surprising to me, “Batman: The Dark Knight Returns” doesn’t make the top 20, and only sells around 9400 copies. And as the sole original Vertigo title, “Sandman: Preludes & Nocturnes” comes in at #12 with 14k sold. I will expect this will rocket up once the Netflix adaptation comes along in 2022.
Nothing else from DC cracked 10k in 2020.
Here’s DC’s Long Tail – at least the raw bleeding has finally stopped.
| Year | # of listed items | % Change | Total Pieces | % Change | Calculated Retail Value | % Change | Av. Sale per title | Av $ per title |
| 2007 | 1644 | — | 1,181,218 | — | $22,033,212 | — | 719 | $13,402 |
| 2008 | 2057 | 25.12% | 1,719,330 | 45.56% | $33,609,704 | 52.54% | 836 | $16,339 |
| 2009 | 2264 | 10.06% | 1,902,181 | 10.64% | $37,816,864 | 12.52% | 840 | $16,704 |
| 2010 | 2442 | 7.86% | 1,320,262 | -30.59% | $25,982,910 | -31.29% | 541 | $10,640 |
| 2011 | 2423 | -0.07% | 1,323,630 | 0.26% | $27,130,811 | 4.42% | 546 | $11,197 |
| 2012 | 2452 | 1.20% | 1,206,198 | -8.87% | $26,729,997 | -1.48% | 492 | $10,901 |
| 2013 | 2551 | 4.04% | 1,369,850 | 13.57% | $29,881,153 | 11.79% | 537 | $11,714 |
| 2014 | 2746 | 7.64% | 1,638,901 | 19.64% | $35,388,570 | 18.43% | 597 | $12,887 |
| 2015* | 1690 | -38.46% | 1,997,577 | 21.89% | $43,031,546 | 21.60% | 1182 | $25,462 |
| 2016* | 1214 | -28.17% | 2,262,888 | 13.82% | $47,963,215 | 11.46% | 1864 | $39,508 |
| 2017 | 3152 | 259.64% | 1,948,037 | -13.91% | $42,921,514 | -10.51% | 618 | $13,617 |
| 2018 | 3364 | 6.73% | 1,333,836 | -31.53% | $31,844,186 | -25.81% | 397 | $9,466 |
| 2019 | 3229 | -4.01% | 1,303,807 | -2.25% | $33,428,626 | 4.98% | 404 | $10,353 |
| 2020 | 3668 | 13.59% | 1,338,405 | 2.65% | $36,315,104 | 8.63% | 365 | $9,901 |
DC has just one book over 50k, four more over 20k, and thirteen more that come in over 10k.
In a small surprise to me, the #8 publisher in the NPD BookScan Top 750 in 2020 is IDW Publishing which places fifteen books for a total of 263k sold, and a bit over $6m in calculated dollars. We’ve never seen them in the top of books sold before, and they beat out both Image and Marvel (!)
There is a major surge forward in sales of the late Representative John Lewis’ “March” trilogy – Book One (IDW’s #1 seller) tops 57k (it sold about 28k in 2019), while Book Two (#4) and Book Three (#5) both sell 22k within ninety copies of each other. And the boxed set of all three books (#3) sells another 26k on top of that. And rounding out the Top Five is George Takei’s “They Called Us Enemy” (#2) selling 43k, a much smaller drop that one would expect in its sophomore frame (it sold 54k in year one).
Of course, IDW isn’t all historical biography, they also publish licensed comics. The biggest is “Sonic The Hedgehog” and v1 (#6) races through nearly 16k copies. With v3 (#8) selling about 9700 copies and v2 (#10) around 8k. V4 and v5 also make the Top 750, but both sell less than 7k. IDW also does well with the Patrick Rothfuss/Jim Zub written left field crossover of “Rick and Morty vs Dungeons & Dragons” (#9) which sells about 9400 copies.
If that’s not enough, the first volume of the great “Locke & Key” (#7) does around 15k, v2 does 7k, and $100 boxed set of the whole series sells an impressive 6300 copies, while the kids focused “Surfside Girls: The Secret of Danger Point” sells around 6500 copies.
Here is IDW’s Long Tail:
| Year | # of listed items | Percent Change | Total Unit Sold | Percent Change | Calculated Retail value | Percent Change | Av. Sale per title | Av $ per title |
| 2007 | 233 | —— | 102,118 | —— | $2,090,647 | —– | 438 | $8,973 |
| 2008 | 335 | 43.78% | 146,125 | 43.09% | $2,766,505 | 32.33% | 436 | $8,258 |
| 2009 | 477 | 42.39% | 215,907 | 47.76% | $4,346,836 | 57.12% | 453 | $9,113 |
| 2010 | 623 | 30.61% | 161,578 | -25.16% | $3,653,680 | -15.95% | 259 | $5,865 |
| 2011 | 785 | 26.00% | 206,136 | 27.58% | $4,884,606 | 33.69% | 263 | $6,222 |
| 2012 | 937 | 19.36% | 162,599 | -21.12% | $4,329,973 | -11.35% | 174 | $4,621 |
| 2013 | 1059 | 13.02% | 180,694 | 11.13% | $4,443,372 | 2.62% | 171 | $4,196 |
| 2014 | 1134 | 7.08% | 228,895 | 26.68% | $5,309,992 | 19.50% | 200 | $4,641 |
| 2015* | 959 | -15.43% | 310,512 | 35.66% | $6,478,023 | 22.00% | 324 | $6,755 |
| 2016* | 978 | 1.98% | 343,197 | 10.53% | $8,194,098 | 26.49% | 351 | $8,378 |
| 2017 | 1639 | 67.59% | 346,368 | 0.92% | $8,278,617 | 1.03% | 211 | $5,051 |
| 2018 | 1811 | 10.05% | 279,435 | -19.32% | $6,525,696 | -21.17% | 154 | $3,603 |
| 2019 | 1817 | 0.33% | 330,051 | 18.11% | $7,443,310 | 14.06% | 182 | $4,096 |
| 2020 | 1906 | 4.90% | 527,405 | 59.80% | $12,365,146 | 66.12% | 277 | $6,487 |
IDW has one book over 50k, four more over 20k, and another two over 10k.
Also a bit of a surprise surge for our #9 publisher this year. While not considered one of the book world’s “Big Five”, Harry N. Abrams is not also considered a traditional Direct Market publisher, either. They publish as Abrams Comicarts, Harry N. Abrams, as well as Amulet Books. They distribute, but do not publish, U.K. publisher SelfMadeHero. Abrams places fifteen books that they publish, selling 238k copies for $3.7m in calculated dollars.
Their best-selling book continues to be Cece Bell’s “El Deafo” (#1) which does just swell at 38k. They also do well with the adaptation of “Dune” (#4) at 19k sold, and Thi Bui’s “The Best We Could Do” (#9) at 14k
The rest of their best sellers are all from Nathan Hale’s “Hazardous Tales” line of great, kid-oriented, historical retellings – and all ten of them make the Top 750! The best-selling volume, v9 “Major Impossible” (#2), sells almost 24k, but even the two that do the worst (v3 and v6) both sell right around 10k.
Here is your long-tail; solid performance:
| Year | # of listed items | Percent Change | Total Unit Sold | Percent Change | Calculated Retail value | Percent Change | Av. Sale per title | Av $ per title |
| 2008 | 3 | —— | 10,031 | —— | $148,675 | —— | 3,344 | $49,558 |
| 2009 | 25 | 733.33% | 24,116 | 140.41% | $640,635 | 330.90% | 965 | $25,625 |
| 2010 | 41 | 64.00% | 48,240 | 100.03% | $1,109,444 | 73.18% | 1,177 | $27,060 |
| 2011 | 49 | 19.51% | 31,846 | -33.98% | $731,054 | -34.11% | 650 | $14,919 |
| 2012 | 62 | 26.53% | 37,522 | 17.82% | $756,650 | 3.50% | 605 | $12,204 |
| 2013 | 70 | 12.90% | 72,538 | 93.32% | $3,278,063 | 333.23% | 1,036 | $46,829 |
| 2014 | 88 | 25.71% | 74,083 | 2.13% | $2,324,820 | -29.10% | 842 | $26,418 |
| 2015* | 92 | 4.55% | 145,633 | 96.58% | $1,898,267 | -18.35% | 1,583 | $20,633 |
| 2016* | 112 | 21.74% | 177,127 | 21.63% | $2,326,956 | 22.58% | 1,581 | $20,776 |
| 2017 | 124 | 10.71% | 248,580 | 40.34% | $3,449,807 | 48.25% | 2,005 | $27,821 |
| 2018 | 138 | 11.29% | 258,334 | 3.92% | $3,776,138 | 9.46% | 1,872 | $27,363 |
| 2019 | 148 | 7.25% | 265,300 | 2.70% | $4,089,631 | 8.30% | 1,791 | $27,633 |
| 2020 | 152 | 2.70% | 306,087 | 15.37% | $4,891,229 | 19.60% | 2,014 | $32,179 |
Harry N. Abrams has three books over 20k, and nine more over 10k in 2020.
And bringing up the rear of the pack at #10 of the Western Publishers in the Top 750, is another of the “Big Five”: Hachette, which includes the imprints of Grand Central, Jimmy Patterson, JY, and Little Brown in the Top 750, as well as Black Dog & Leventhal, Nation Books, and Running Press in the Long Tail. In the Top 750 they place fourteen books, selling 232k copies and $2.9m. They also publish manga as Yen which is up above in the previous section.
The Grand Central imprint just has a single book in the Top 750: “Parasite: A Graphic Novel in Storyboards” by Bong Joon Ho It is the #10 overall best seller for Hachette and sells about 9k copies.
Jimmy Patterson is a kid’s book imprint for James Patterson (who knew?), and they place one book, as well, but it’s Hachette’s #1 book of the year on the comics charts, an adaptation of “Jacky Ha-Ha”, and it does fantastic at 48k copies sold.
The JY imprint is home to Svetlana Chmakova’s “Awkward” (#3) which sells 22k, “Crush” (#4), which sells 16k, “Brave” (#6) which does 13k, and “The Weirn Books” where v1 (#8) sells 11k.
Little, Brown places eight books into the Top 750. The biggest hit is “Meg, Jo, Beth and Amy: A Modern Retelling of Little Women” (#2), which brings in sales of 47k. The “Catstronauts” books fill out the chart, where “Mission Moon” (#5) is at 16k, “Race to Mars” (#7) sells 11k, and “Space Station Situation” (#10) sells about 9500 copies.
None of their other imprints manage to score any titles at 10k or over.
Here’s the Long Tail of just the Western books for Hachette.
| Year | # of listed items | Percent Change | Total Unit Sold | Percent Change | Calculated Retail value | Percent Change | Av. Sale per title | Av $ per title |
| 2007 | 15 | —— | 39,181 | —— | $689,383 | —— | 2,612 | $45,959 |
| 2008 | 18 | 20.00% | 37,519 | -4.24% | $596,609 | -13.46% | 2,084 | $33,145 |
| 2009 | 18 | —— | 40,172 | 7.07% | $642,935 | 7.76% | 2,232 | $35,719 |
| 2010 | 19 | 5.56% | 160,992 | 300.76% | $3,097,996 | 381.85% | 8,473 | $163,052 |
| 2011 | 24 | 26.32% | 88,131 | -45.26 | $1,273,500 | -58.89% | 3,672 | $53,063 |
| 2012 | 28 | 16.67% | 110,897 | 25.83% | $1,565,744 | 22.95% | 3,961 | $55,919 |
| 2013 | 24 | -14.29% | 39,093 | -65.75% | $584,783 | -62.65% | 1,629 | $24,366 |
| 2014 | 32 | 33.33% | 38,853 | -0.61% | $593,667 | 1.52% | 1,214 | $18,552 |
| 2015* | 30 | -0.63% | 61,539 | 58.39% | $830,047 | 39.82% | 2,051 | $27,668 |
| 2016* | 56 | 86.67% | 81,648 | 32.68% | $1,654,511 | 99.33% | 1,458 | $29,545 |
| 2017 | 78 | 39.29% | 220,591 | 170.17% | $2,998,501 | 81.23% | 2,828 | $38,442 |
| 2018 | 203 | 260.26% | 363,575 | 64.82% | $4,541,954 | 51.47% | 1,791 | $22,374 |
| 2019 | 152 | -25.12% | 356,334 | -1.99% | $4,469,594 | -1.59% | 2,344 | $29,405 |
| 2020 | 216 | 42.11 | 359,018 | 0.75% | $5,141,443 | 15.03% | 1,662 | $23,803 |
And if you add the Manga from Yen, the combined total looks like this:
| Year | # of listed items | Percent Change | Total Unit Sold | Percent Change | Calculated Retail value | Percent Change | Av. Sale per title | Av $ per title |
| 2007 | 25 | —— | 52,077 | —— | $836,832 | —– | 2,083 | $33,473 |
| 2008 | 108 | 332.00% | 147,645 | 183.51% | $1,834,469 | 119.22% | 1,367 | $16,986 |
| 2009 | 229 | 112.04% | 371,134 | 151.37% | $4,340,048 | 132.78% | 1,621 | $18,952 |
| 2010 | 363 | 58.52% | 721,975 | 94.53% | $9,748,867 | 124.63% | 1,999 | $26,856 |
| 2011 | 484 | 33.33% | 852,256 | 18.05% | $11,227,466 | 15.17% | 1,761 | $23,197 |
| 2012 | 576 | 19.01% | 758,845 | -10.96% | $10,301,009 | -8.25% | 1,317 | $17,884 |
| 2013 | 678 | 17.71% | 731,473 | -3.61% | $10,300,204 | —– | 1,079 | $15,192 |
| 2014 | 808 | 19.17% | 720,988 | -1.43% | $10,579,169 | 2.71% | 892 | $13,093 |
| 2015* | 742 | -8.17% | 994,407 | 37.92% | $14,304,955 | 35.22% | 1,340 | $19,279 |
| 2016* | 849 | 14.42% | 1,153,656 | 16.01% | $17,174,718 | 20.06% | 1,359 | $20,229 |
| 2017 | 1481 | 74.44% | 1,199,553 | 3.98% | $16,865,176 | -1.80% | 810 | $11,388 |
| 2018 | 1940 | 30.99% | 1,253,803 | 4.52% | $17,593,705 | 4.32% | 646 | $9,069 |
| 2019 | 1998 | 2.99% | 1,240,930 | -1.03% | $17,477,769 | -0.66% | 621 | $8,748 |
| 2020 | 2226 | 11.41% | 1,449,020 | 16.77% | $20,939,201 | 19.80% | 651 | $9,407 |
Hachette has three titles over 20k, and five others over 10k, on the Western charts.
That is it for the top ten publishers, but there’s a few more publishers it’s worth singling out for attention because they have a historical value, they are significant for either the book or comics markets, they are growing, or there is otherwise something of note about them!
Since this is a report on bookstore sales, let’s start with the last of the mainstream book world’s “Big Five”: Simon & Schuster. They manage to place six titles into this year’s Top 750, but missed the cutoff for Top Ten Publishers (They would be #14). These six titles place 59k copies, for about $917k in calculated dollar sales.
Simon has several imprints, including Aladdin, Atria, Atheneum, Free Press, Margaret K. Elderberry, Gallery 13, Pocket, Scribner, and Touchstone, though not all of those imprints made it into the Top 750.
In alphabetical order, the Aladdin imprint also holds their #1 book – “The Okay Witch”, which sells almost 15k copies. That’s Okay!
Atheneum also just places one title, “Long Way Down”, (#3) which sells about 9700 copies.
Gallery 13 has two best-sellers, both comics from Stephen King – “Cycle of the Werewolf” (#4) sells almost 7500 copies, while “Creepshow” (#6) does about 6500.
And finally, Simon & Schuster For Young Readers also has two placers: The first, “Becoming RBG: Ruth Bader Ginsburg’s Journey to Justice” (#2) sells a bit over 13k, while “Fake Blood” (#5) moves about 6900
Here is Simon & Schuster’s Long Tail, which includes the imprints that I’m aware of.
| Year | # of listed items | % Change | Total Pieces | % Change | Calculated Retail Value | % Change | Av. Sale per title | Av $ per title |
| 2007 | 12 | — | 8,317 | — | $158,014 | — | 693 | $13,168 |
| 2008 | 26 | 116.67% | 14,917 | 79.36% | $211,798 | 34.04% | 574 | $8,146 |
| 2009 | 41 | 57.69% | 109,558 | 634.45% | $1,430,544 | 575.43% | 2,672 | $34,891 |
| 2010 | 46 | 12.20% | 214,828 | 96.09% | $2,660,094 | 85.95% | 4,670 | $57,828 |
| 2011 | 62 | 34.78% | 187,531 | -12.71% | $2,383,491 | -10.40% | 3,025 | $38,443 |
| 2012 | 63 | 1.61% | 165,831 | -11.57% | $2,844,453 | 19.34% | 2,632 | $45,150 |
| 2013 | 67 | 6.35% | 258,931 | 56.14% | $4,165,350 | 46.44% | 3,865 | $62,169 |
| 2014 | 71 | 5.97% | 383,878 | 48.25% | $6,520,821 | 26.55% | 5,407 | $91,843 |
| 2015* | 75 | 5.63% | 910,341 | 237.14% | $13,386,461 | 205.29% | 12,138 | $178,486 |
| 2016* | 75 | —— | 618,922 | -32.01% | $9,477,798 | -29.20% | 8,252 | $126,371 |
| 2017 | 89 | 18.67% | 449,243 | -27.42% | $6,788,432 | -28.38% | 5,048 | $76,275 |
| 2018 | 88 | -1.12% | 38,804 | -91.36% | $739,664 | -89.10% | 441 | $8,405 |
| 2019 | 100 | 13.64% | 80,795 | 108.21% | $1,502,286 | 103.10% | 808 | $15,023 |
| 2020 | 128 | 28.00% | 93,785 | 16.08% | $1,841,672 | 22.59% | 733 | $14,388 |
[Almost all of that 2018 drop was my reconsidering hybrid-prose books like Rachel Renee Russell’s “Dork Diaries” as properly being “comics”, so that was on me, not them!]
Simon & Schuster has two books over 10k this year.
While not one of the “Big Five”, there are several other publishers that I would consider both “significant” as well as bookmarket-first who did well in the Top 750. In straight alphabetical: Candlewick (5 placing titles in 2020), Houghton Mifflin Harcourt (7), and Hyperion/Disney Press (7), and Skyhorse (2)
First up is Candlewick, which places five titles, for almost 76k combined. The best-selling is “Flora & Ulysses” which is mostly prose, but does have a significant enough comics section in it to be on “this side” of the line for the category. It sells 28k copies. They also place four volumes of “Timmy Failure”: the first, “Mistakes Were Made” Sells almost 25k, with “Now Look What You’ve Done” a bit over 10k. The other two move 6800 and 6300 copies. Not much of a failure, that!
Here’s a Long Tail:
| Year | # of listed items | Percent Change | Total Unit Sold | Percent Change | Calculated Retail value | Percent Change | Av. Sale per title | Av $ per title |
| 2008 | 6 | — | 5,034 | — | $56,024 | — | 839 | $9,337 |
| 2009 | 18 | 200.00% | 9,688 | 92.45% | $103,287 | 84.36% | 538 | $5,738 |
| 2010 | 24 | 33.33% | 14,857 | 53.35% | $202,687 | 96.24% | 619 | $8,445 |
| 2011 | 29 | 20.83% | 19,158 | 28.95% | $286,615 | 41.41% | 661 | $9,883 |
| 2012 | 30 | 3.45% | 15,884 | -17.09% | $221,438 | -22.74% | 529 | $7,381 |
| 2013 | 31 | 3.33% | 18,710 | 17.79% | $282,320 | 27.49% | 604 | $9,107 |
| 2014 | 28 | -9.68% | 19,780 | 5.72% | $301,845 | 6.92% | 706 | $10,780 |
| 2015* | 48 | 71.43% | 57,018 | 188.26% | $652,681 | 116.23% | 1188 | $13,598 |
| 2016* | 39 | -18.75% | 28,318 | -50.33% | $436,806 | -33.08% | 726 | $11,200 |
| 2017 | 41 | 5.13% | 46,024 | 62.53% | $503,622 | 15.30% | 1123 | $12,283 |
| 2018 | 51 | 24.39% | 66,313 | 44.08% | $622,460 | 23.60% | 1300 | $12,205 |
| 2019 | 52 | 1.96% | 74,733 | 12.70% | $705,396 | 13.32% | 1437 | $13,565 |
| 2020 | 55 | 5.77% | 90,378 | 20.93% | $993,089 | 40.79% | 1643 | $18,056 |
Candlewick has two books over 20k, and one more over 10k.
Houghton Mifflin Harcourt publishes comics as Clarion, Etch, HMH and Mariner. They place seven titles into the Top 750 that total about 209k, and they are the #11 publisher in NPD BookScan Top 750 in 2020.
Their best-sellers are at Etch, where the top three slots are swept by Kayla Miller, with “Camp” at 61k, “Act” at 43k, while her “Click” sells 40k copies.
As their self-named imprint, HMH sells 35k copies of Kwame Alexander’s “The Crossover” (#4), as well as 6400 copies of the adaptation of Lois Lowry’s “The Giver”, and 6k copies of the adaptation of “Animal Farm”.
Alison Bechdel’s “Fun Home” (#5) continues to sell at Mariner, with 17k copies going out the door.
The Long Tail:
| Year | # of listed items | Percent Change | Total Unit Sold | Percent Change | Calculated Retail value | Percent Change | Av. Sale per title | Av $ per title |
| 2007 | 4 | —— | 20,474 | —— | $434,495 | —— | 5119 | $108,624 |
| 2008 | 6 | 50.00% | 14,183 | -30.73% | $307,019 | -29.34% | 2363 | $51,170 |
| 2009 | 14 | 233.33% | 24,568 | 73.22% | $436,328 | 42.12% | 1755 | $31,166 |
| 2010 | 17 | 21.43% | 29,163 | 18.70% | $532,539 | 22.05% | 1715 | $31,326 |
| 2011 | 18 | 5.88% | 24,239 | -16.88% | $450,536 | -15.40% | 1347 | $25,030 |
| 2012 | 21 | 16.67% | 23,562 | -2.79% | $402,575 | -10.65% | 1122 | $1,9170 |
| 2013 | 29 | 38.10% | 44,558 | 89.11% | $687,920 | 70.88% | 1536 | $23,721 |
| 2014 | 27 | -6.90% | 32,751 | -26.50% | $552,884 | -19.63% | 1213 | $20,477 |
| 2015* | 33 | 22.22% | 78,357 | 239.25% | $1,214,786 | 219.72% | 2374 | $36,812 |
| 2016* | 38 | 15.15% | 60,359 | -22.97% | $943,188 | 22.36% | 1588 | $24,821 |
| 2017 | 27 | -28.95% | 42,963 | -28.82% | $710,481 | -24.67% | 1591 | $26,314 |
| 2018 | 60 | 222.22% | 41,596 | -3.18% | $701,891 | -1.21% | 693 | $11,698 |
| 2019 | 59 | -1.67% | 192,157 | 361.96% | $2,909,580 | 314.53% | 3257 | $49,315 |
| 2020 | 75 | 27.12% | 253,602 | 31.98% | $3,611,395 | 24.12% | 3381 | $48,152 |
Houghton Mifflin Harcourt has one book over 50k, three more over 20k, and one other over 10k.
Hyperion/Disney Press is, like Marvel, also owned by Disney. Technically, that probably means I should fold them together like I do with the various individual companies that make up a Penguin Random House, but I resist, how I resist (largely because they are distributed separately). But I have to point out that for the first time since I have tracked these charts, Hyperion/Disney Press did better than Marvel did – Hyperion would be the #12 publisher in the Top 750, while Marvel is down at #16 (!)
Hyperion has seven placing titles, doing 117k combined. The best-selling title is almost 50k copies of “Gravity Falls: Lost Legends”, but they also shift 21k copies of the adaptation of “Percy Jackson: The Lightning Thief” and 11k copies of “Sea of Monsters”
| Year | # of listed items | Percent Change | Total Unit Sold | Percent Change | Calculated Retail value | Percent Change | Av. Sale per title | Av $ per title |
| 2007 | 10 | —– | 39,121 | —– | $336,771 | —– | 3912 | $33,677 |
| 2008 | 19 | 90.00% | 41,005 | 4.82% | $409,051 | 21.46% | 2158 | $21,529 |
| 2009 | 24 | 26.32% | 23,301 | -43.18% | $234,078 | -42.78% | 971 | $9,753 |
| 2010 | 26 | 8.33% | 30,860 | 32.44% | $314,067 | 34.17% | 1187 | $12,080 |
| 2011 | 29 | 11.54% | 46,553 | 50.85% | $392,652 | 25.02% | 1605 | $13,540 |
| 2012 | 31 | 6.90% | 33,105 | -28.89% | $376,735 | -4.05% | 1068 | $12,153 |
| 2013 | 33 | 6.45% | 102,537 | 209.73% | $1,298,672 | 244.72% | 3107 | $39,354 |
| 2014 | 38 | 15.15% | 77,045 | -24.86% | $1,015,188 | -21.83% | 2028 | $26,715 |
| 2015* | 57 | 50.00% | 63,290 | -17.85% | $831,477 | -18.10% | 1110 | $14,587 |
| 2016* | 36 | -36.84% | 61,730 | -2.46% | $926,504 | 11.43% | 1715 | $25,736 |
| 2017 | 41 | 13.89% | 99,589 | 61.33% | $1,592,970 | 71.93% | 2429 | $38,853 |
| 2018 | 54 | 31.71% | 132,623 | 33.17% | $2,228,412 | 39.89% | 2456 | $41,267 |
| 2019 | 63 | 16.67% | 158,896 | 19.81% | $2,473,413 | 10.99% | 2522 | $39,261 |
| 2020 | 49 | -22.22% | 149,565 | -5.82% | $2,362,499 | -4.48% | 3052 | $48,214 |
Hyperion has two books over 20k, and one more over 10k
Skyhorse (placing two books for right about 14k total) is here on the strength of screencap fumetti comics taken from “Minecraft” published in their Sky Pony imprint. All of these comics are “unofficial”, however, as they’re not licensing the Minecraft brand or engine to do so. However no individual book manages even selling 8k.
Here’s their long tail:
| Year | # of listed items | Percent Change | Total Unit Sold | Percent Change | Calculated Retail value | Percent Change | Av. Sale per title | Av $ per title |
| 2012 | 2 | — | 180 | — | $2,331 | — | 90 | $1,166 |
| 2013 | 4 | 100.00% | 1,227 | 681.67% | $15,897 | 681.98% | 307 | $3,974 |
| 2014 | 4 | — | 458 | -62.67% | $6,191 | -61.06 | 115 | $1,548 |
| 2015* | 5 | 25.00% | 14,011 | 3059.17% | $168,332 | 2718.98% | 2,802 | $33,666 |
| 2016* | 6 | 20.00% | 51,833 | 369.95% | $622,000 | 369.51% | 8,639 | $103,667 |
| 2017 | 26 | 433.33% | 81,366 | 56.98% | $1,144,071 | 83.93% | 3,129 | $44,003 |
| 2018 | 35 | 34.62% | 87,021 | 6.95% | $1,326,292 | 15.93% | 2,486 | $37,894 |
| 2019 | 40 | 14.30% | 57,866 | -33.50% | $843,109 | -36.43% | 1,447 | $21,078 |
| 2020 | 47 | 17.5% | 64,471 | 11.41% | $866,390 | 2.76% | 1,372 | $18,835 |
Skyhorse has no books over 10k.
Outside of those bookstore-native publishers, we’ve got several Direct Market-native publishers who placed more than two titles into the Top 750. We’ll rank them by number of titles placed, and those would be: Image (6), Marvel (6), Dynamite (4), Boom (2), Drawn & Quarterly (2), and Oni (2)
Starting from the top:
Image Comics was the #9 publisher in the NPD BookScan Top 750 last year, but in 2020, they have fallen sharply to #15 Western publisher via NPD BookScan reporters; Image has just 6 titles placing within the Top 750 in 2020, that sell 56k copies. That’s a big drop from last year’s 224k, and the year before 405k.
Because Image is a primarily Direct Market retailer, we’ve always built a special year-by-year chart for them in the Top 750 (Hey! I have my own biases!), and this is what Image’s performance has looked like for the last seventeen years:
| Year | # of placing titles | Unit sales | Calculated
Retail Value |
| 2003 | 1 | 2,328 | $30,148 |
| 2004 | 1 | 402 | $5,206 |
| 2005 | 3 | 8,699 | $100,236 |
| 2006 | 1 | 5,311 | $113,465 |
| 2007 | 4 | 28,349 | $344,026 |
| 2008 | 9 | 55,033 | $830,574 |
| 2009 | 11 | 78,874 | $1,210,094 |
| 2010 | 22 | 289,044 | $6,479,930 |
| 2011 | 27 | 367,265 | $8,670,917 |
| 2012 | 33 | 701,050 | $20,389,762 |
| 2013 | 38 | 651,390 | $19,371,269 |
| 2014 | 47 | 691,804 | $17,554,492 |
| 2015 | 71 | 878,262 | $22,587,672 |
| 2016 | 72 | 908,655 | $22,917,758 |
| 2017 | 52 | 556,196 | $11,092,960 |
| 2018 | 42 | 402,584 | $7,611,777 |
| 2019 | 26 | 223,569 | $5,446,399 |
| 2020 | 6 | 55,711 | $1,927,993 |
Yeah, big drop. This is what happens when your best-sellers end without any obvious replacements.
Image’s #1 best-seller on the Top 750 charts is Robert Kirkman and Charlie Adlard’s “The Walking Dead”, with the fourth and final big thick Compendium doing just over 18k, while the first Compendium (#5) sells a modest 7k copies. Because of the cover price, far more than half of the calculated dollar volume for Image’s Top 750 is that one book.
Coming in at #2 is the first volume of “Old Guard: Opening Fire” by Greg Rucka and Leandro Fernandez, presumably off of the strength of the Netflix movie – but even with that, it is only around 8800 copies sold.
Brian K Vaughan and Fiona Staples’ “Saga” is #3, with v1 moving around 8200 copies, a big drop from the days when the book was still being serialized – it is my fervent hope that this will come roaring back when the book resumes serialization for its second half. Before the end of the year, please please comics gods?
And then at #4 is the first volume of “Monstress” by Majorie Liu and Sana Takada with 7200 copies. Showing perfect “hammock” behavior, v5 is #6 and sells 6200 copies.
Image is super-hungry for new “hits” – “Old Guard” is the “youngest” book that Image sells to the bookstores in the Top 750, and that was pub-dated 2017.
Here’s what Image’s Long Tail looks like: just like from the top, it’s yet another brutal cut this year. While I understand that Image has a couple of structural challenges (“The Walking Dead” TV show drove a lot of sales… until it didn’t; Best-selling periodical “Saga” has been on hiatus for more than three years now), but given the performance of the market as a whole, I have to say that I objectively think that four years of losses like this, I start to get genuinely concerned; they are getting close to a ten year low. And I have to say, that I absolutely don’t think Diamond’s brief shut down in March 2020 is the culprit (Diamond Book Distributors is Image’s distro to the bookstore market), because other DBD clients are up in 2020.
| Year | # of listed items | Percent Change | Total Unit Sold | Percent Change | Calculated Retail Value | Percent Change | Av. Sale per title | Av $ per title |
| 2007 | 438 | —— | 116,015 | —— | $2,313,477 | —– | 265 | $5,282 |
| 2008 | 515 | 17.58% | 121,001 | 4.30% | $2,445,765 | 5.72% | 235 | $4,749 |
| 2009 | 571 | 10.87% | 156,466 | 29.31% | $3,207,033 | 31.13% | 274 | $5,617 |
| 2010 | 642 | 12.43% | 359,238 | 229.59% | $8,152,806 | 254.22% | 560 | $12,699 |
| 2011 | 749 | 16.66% | 466,637 | 29.90% | $11,041,187 | 35.43% | 623 | $14,741 |
| 2012 | 868 | 15.89% | 794,419 | 70.24% | $22,797,279 | 106.47% | 915 | $26,264 |
| 2013 | 994 | 14.52% | 776,507 | -2.25% | $22,085,860 | -3.12% | 781 | $22,219 |
| 2014 | 1006 | 1.21% | 830,735 | 6.98% | $20,309,973 | -8.04% | 826 | $20,189 |
| 2015* | 842 | -16.30% | 1,070,299 | 28.84% | $26,175,438 | 28.88% | 1271 | $31,087 |
| 2016* | 876 | 4.04% | 1,187,316 | 10.93% | $28,267,847 | 7.99% | 1355 | $32,269 |
| 2017 | 1531 | 174.77% | 938,991 | -20.91% | $18,564,975 | -34.32% | 613 | $12,126 |
| 2018 | 1706 | 11.43% | 769,180 | -18.08% | $14,923,335 | -19.62% | 451 | $8,748 |
| 2019 | 1757 | 2.99% | 641,353 | -16.62% | $14,305,501 | -4.14% | 365 | $8,142 |
| 2020 | 1844 | 4.95% | 511,927 | -20.18% | $11,432,907 | -20.08% | 278 | $6,200 |
Image has just one title over 10k.
In another pretty humiliating performance, Marvel Comics doesn’t even make the Top Ten publishers, and, in fact would come in at #16, behind Image. Marvel. The brand. The loyalty, The pop culture demand. And they appear not to be able to shift books to save their life (while, y’know, DC is up in the Long Tail in 2020), and this is in an environment in which comics are up massively as a category. Marvel places just 6 titles for under 50k copies and $1.3m of calculated retail. This is Marvel’s worst performance in the Top 750…. Well, ever.
Here is how Marvel looks in the Top 750 because I am Direct Market-centric and have always kept these for our top three publishers:
| Year | # of placing titles | Unit sales | Calculated
Retail value |
| 2003 | 73 | 455,553 | $8,428,962 |
| 2004 | 50 | 227,985 | $3,756,764 |
| 2005 | 26 | 153,317 | $2,459,027 |
| 2006 | 33 | 294,852 | $5,702,307 |
| 2007 | 37 | 376,918 | $7,599,057 |
| 2008 | 38 | 303,639 | $6,446,359 |
| 2009 | 34 | 226,541 | $5,019,216 |
| 2010 | 33 | 206,273 | $4,979,323 |
| 2011 | 27 | 128,364 | $3,303,496 |
| 2012 | 32 | 141,145 | $3,872,683 |
| 2013 | 39 | 187,598 | $4,229,242 |
| 2014 | 53 | 342,706 | $8,341,787 |
| 2015* | 63 | 478,076 | $10,611,981 |
| 2016* | 60 | 555,715 | $12,088,278 |
| 2017 | 50 | 378,689 | $7,840,198 |
| 2018 | 44 | 363,360 | $7,885,015 |
| 2019 | 27 | 220,845 | $4,151,908 |
| 2020 | 6 | 49,838 | $1,292,944 |
Despite some people thinking to the contrary, I genuinely never want to be unkind to publishers, but hokey smokes, how are the people running the backlist for Marvel still employed?
I know I say this part year after year, but Marvel is literally synonymous with the very idea of “comics” for a meaningful percentage of the American population, they utterly dominated pop culture for multiple years here, and the source material of comics is actually usually better realized than the various bits stolen by the adaptations. Plus, on top of that, they have “Star Wars” (and also all of the 20th Century Fox library now) – it is absolutely incomprehensible to this observer that they are not entirely dominating the sales of western comics to adults. And yet, they can’t even sell 10k copies of a single book into the bookmarket, and are massively down in the Long Tail in an up market.
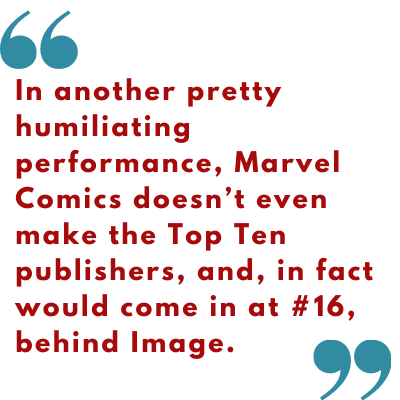 But Marvel’s backlist is scattershot and very poorly maintained. Books go out of print with insane regularity, and reading order, branding and packaging is haphazard. The books are usually extremely expensive, given that their creation costs have been amortized, they’re not especially “new reader friendly” in any meaningful way, and the books themselves are thin, expensive, and have poor “hand feel”. Backlist is treated as an afterthought by Marvel, and the numbers show how well that is working: the overall market (as shown in the Long Tail) for Western comics has more than tripled in the last eight years, and Marvel is somehow selling fewer comics than they did in 2012, despite having a third more SKUs. It seems blatant that millions of dollars, if not tens of millions, are being left on the ground: sales that should be nearly trivial for Marvel grow if they gave any meaningful thought to how they package, produce and market their book collections. I know they certainly don’t care about my approval, but watching this performance, year after year, and I have nothing to be but disappointed.
As I said, nothing from Marvel cracks even 10k in the bookstore market for the first time that I can recall, so it seems at least slightly possible that many bookstores are not bothering to even stock most of their books at this time. And most of Marvel’s best-sellers are not even “Marvel Comics” – instead they are “Star Wars”, with the #1 best-selling being the 9700 copies of “The Rise of Kylo Ren”. This is followed by the #2 book being the based-on-the-new-ride volume of “Galaxy’s Edge” (9300 copies), which makes me think that the book stores at Disneyland almost certainly have to be NPD BookScan reporters – it’s very very difficult to see how that specific a book could be broadly popular more than either #5 or #6, both of which are “Darth Vader” “volume 1”’s – see, I told you their packaging and promotion is highly confusing! – the Kieron Gillen-penned “Vader” sells about 7300 copies, while the Charles Soule-led “Dark Lord of the Sith” is about 6900 copies. That last one sold almost 9600 copies the year before.
The remaining two books are proper Marvel properties — #3 is the hardcover of “House of X / Powers of X” which does 8700 copies in its second frame, while #4 is the closest thing Marvel has to a perennial, “Infinity Gauntlet” which sells a bit over 8k copies (this is down substantially from 27k copies sold in 2019 and 54k in 2018)
That’s it.
Here is Marvel’s Long Tail, and it is disheartening, I feel.
| Year | # of listed items | % Change | Total Pieces | % Change | Calculated Retail value | % Change | Av. Sale per title | Av $ per title |
| 2007 | 1230 | — | 1,034,023 | — | $19,947,737 | — | 841 | $16,218 |
| 2008 | 1559 | 26.75% | 1,032,394 | -0.01% | $20,128,825 | 0.01% | 662 | $12,911 |
| 2009 | 2067 | 32.58% | 954,335 | -7.56% | $19,608,696 | -2.58% | 462 | $9,487 |
| 2010 | 2551 | 23.42% | 870,597 | -8.77% | $19,485,662 | -0.06% | 352 | $7,638 |
| 2011 | 2852 | 11.80% | 852,187 | -2.11% | $20,225,728 | 3.80% | 299 | $7,092 |
| 2012 | 3083 | 8.10% | 726,542 | -14.74% | $18,848,013 | -6.81% | 236 | $6,114 |
| 2013 | 3203 | 3.89% | 730,826 | 0.59% | $17,820,299 | -5.45% | 228 | $5,564 |
| 2014 | 3352 | 4.65% | 918,595 | 25.69% | $24,369,961 | 36.75% | 274 | $7,270 |
| 2015* | 1882 | -43.85% | 1,114,414 | 21.32% | $28,021,290 | 14.98% | 592 | $14,889 |
| 2016* | 1841 | -2.18% | 1,277,046 | 14.59% | $31,402,330 | 12.07% | 694 | $17,057 |
| 2017 | 3578 | 94.35% | 1,142,061 | -10.57% | $28,201,535 | -10.19% | 319 | $7,882 |
| 2018 | 3662 | 2.35% | 1,180,202 | 3.34% | $29,651,745 | 5.14% | 322 | $8,097 |
| 2019 | 3692 | 0.82% | 1,064,633 | -9.79% | $26,249,715 | -11.47% | 288 | $7,110 |
| 2020 | 4375 | 18.50% | 785,201 | -26.25% | $20,798,624 | -20.77% | 179 | $4,754 |
Marvel has zero books over 10k, as reported by NPD BookScan reporters.
With four placing books in 2020, Dynamite is the next largest publisher in this survey. These four books sell just over 40k copies.
This success is almost solely driven by “The Boys”, which is turn is largely driven by the success of the TV show, where v1 sells 17k, v2 moves 10k, v3 does 7k, and v4 sells 6100. And, if this were a “Top 752” list, v5 and v6 woulda made the recitation as well
Here is the Long Tail for Dynamite:
| Year | # of listed items | Percent Change | Total Unit Sold | Percent Change | Calculated Retail value | Percent Change | Av. Sale per title | Av $ per title |
| 2007 | 21 | —– | 1,082 | —– | $17,861 | —– | 52 | $851 |
| 2008 | 71 | 238.10% | 7,300 | 574.68% | $138,083 | 673.10% | 103 | $1,945 |
| 2009 | 124 | 74.65% | 23,748 | 225.32% | $485,272 | 251.44% | 192 | $3,913 |
| 2010 | 177 | 42.74% | 31,194 | 31.35% | $660,904 | 36.19% | 176 | $3,734 |
| 2011 | 246 | 38.98% | 57,801 | 85.30% | $1,300,079 | 96.71% | 235 | $5,285 |
| 2012 | 288 | 17.07% | 38,798 | -32.88% | $887,083 | -31.77% | 135 | $3,080 |
| 2013 | 347 | 20.49% | 32,296 | -16.76% | $799,021 | -9.93% | 93 | $2,303 |
| 2014 | 405 | 16.71% | 31,528 | -2.38% | $788,130 | -1.36% | 78 | $1,946 |
| 2015* | 192 | -52.59% | 31,452 | -0.24% | $797,977 | 1.25% | 164 | $4,156 |
| 2016* | 174 | -9.38 | 42,280 | 34.43% | $997,956 | 25.06% | 243 | $5,735 |
| 2017 | 552 | 217.24% | 38,053 | -10.00% | $868,682 | -12.95% | 69 | $1,574 |
| 2018 | 630 | 14.13% | 50,538 | 32.81% | $1,227,967 | 41.36% | 80 | $1,949 |
| 2019 | 654 | 3.81% | 81,198 | 60.67% | $2,112,720 | 72.05% | 124 | $3,230 |
| 2020 | 682 | 4.28% | 100,008 | 23.17% | $2,735,911 | 29.50% | 148 | $4,012 |
Dynamite has two books over 10k.
Our final three pubs all placed two books each into the Top 750, so in alphabetical order:
Boom! Sells two titles into the Top 750, for almost 15k. Boom! uses the imprints Archaia, Boom, Boom Box, Boom Town, and Kaboom. The top-seller for Boom! is the first volume of “Lumberjanes” (8300 copies), while the other is the adaptation of “Slaughterhouse Five” (about 6200), which instantly went out-of-stock for multiple months upon release, so probably could have done better if there was inventory to sell.
The Long tail for Boom!:
| Year | # of listed items | Percent Change | Total Unit Sold | Percent Change | Calculated Retail value | Percent Change | Av. Sale per title | Av $ per title |
| 2007 | 21 | —– | 10,462 | —– | $246,984 | —— | 498 | $11,761 |
| 2008 | 44 | 109.52% | 10,943 | 4.60% | $394,361 | 59.67% | 249 | $8,963 |
| 2009 | 93 | 111.36% | 25,378 | 131.91% | $485,485 | 23.11% | 273 | $5,220 |
| 2010 | 202 | 117.20% | 64,770 | 155.22% | $1,140,019 | 134.82% | 321 | $5,644 |
| 2011 | 253 | 25.25% | 75,472 | 16.52% | $1,435,514 | 25.92% | 298 | $5,674 |
| 2012 | 307 | 21.34% | 59,758 | -20.82% | $1,160,894 | -19.13% | 195 | $3,781 |
| 2013 | 347 | 13.03% | 86,637 | 44.98% | $1,650,374 | 42.16% | 250 | $4,756 |
| 2014 | 388 | 11.82% | 108,504 | 25.24% | $1,894,658 | 14.80% | 280 | $4,883 |
| 2015* | 295 | -23.97% | 126,029 | 16.15% | $2,159,071 | 13.96% | 427 | $7,319 |
| 2016* | 309 | 4.75% | 134,386 | 6.63% | $2,313,502 | 7.15% | 435 | $7,488 |
| 2017 | 633 | 104.85% | 171,133 | 27.34% | $2,983,775 | 28.97% | 270 | $4,714 |
| 2018 | 768 | 21.33% | 198,773 | 16.15% | $3,659,046 | 22.63% | 259 | $4,764 |
| 2019 | 825 | 7.42% | 228,120 | 14.76% | $4,344,256 | 18.74% | 277 | $5,266 |
| 2020 | 951 | 15.27% | 236,779 | 3.80% | $4,634,903 | 6.69% | 951 | $4,874 |
Boom! has no books over 10k.
Drawn & Quarterly places two books into the Top 750, for about 16k copies. Their best-seller is 9800 copies of “Making Comics” by Lynda Barry, while Adrian Tomine’s “The Loneliness of the Long-Distance Cartoonist” sells about 6100 copies.
A Long Tail for D&Q:
| Year | # of listed items | Percent Change | Total Unit Sold | Percent Change | Calculated Retail value | Percent Change | Av. Sale per title | Av $ per title |
| 2007 | 62 | — | 24,689 | — | $500,764 | — | 398 | $8,077 |
| 2008 | 82 | 32.26% | 42,038 | 70.27% | $912,774 | 82.28% | 513 | $11,131 |
| 2009 | 107 | 30.49% | 42,957 | 2.19% | $920,014 | 0.79% | 401 | $8,598 |
| 2010 | 126 | 17.76% | 44,737 | 4.14% | $1,009,387 | 9.71% | 355 | $8,011 |
| 2011 | 145 | 15.08% | 62,286 | 39.23% | $1,399,793 | 38.68% | 430 | $9,654 |
| 2012 | 155 | 6.90% | 43,098 | -30.81% | $926,233 | -33.83% | 278 | $5,976 |
| 2013 | 189 | 21.94% | 41,887 | -2.81% | $893,905 | 3.49% | 222 | $4,730 |
| 2014 | 205 | 8.47% | 46,030 | 9.90% | $1,032,032 | 15.45% | 225 | $5,034 |
| 2015* | 219 | 6.83% | 73,471 | 59.62% | $1,680,878 | 62.87% | 335 | $7,675 |
| 2016* | 233 | 6.39% | 57,326 | -21.97% | $1,266,170 | -24.67% | 246 | $5,434 |
| 2017 | 247 | 6.01% | 68,087 | 18.77% | $1,548,813 | 22.32% | 276 | $6,271 |
| 2018 | 285 | 15.38% | 79,765 | 17.15% | $2,055,019 | 32.68% | 280 | $7,211 |
| 2019 | 303 | 6.32% | 80,084 | 4.32% | $2,112,455 | 2.79% | 264 | $6,972 |
| 2020 | 329 | 8.59% | 80,384 | 0.37% | $2,302,356 | 8.99% | 244 | $6,177 |
Drawn & Quarterly has no books over 10k.
Oni Press is our final publisher, with two placing books for about 14k total. Their biggest success in 2020 is volume two of the odd “Rick and Morty vs. Dungeons & Dragons” crossover (with IDW – where you can find v1) co-written by Jim Zub – that sells about 7400 copies, while Brenna Thummler’s “Sheets” sells almost 6600 copies.
Here’s Oni’s Long Tail
| Year | # of listed items | Percent Change | Total Unit Sold | Percent Change | Calculated Retail value | Percent Change | Av. Sale per title | Av $ per title |
| 2007 | 125 | —— | 11,294 | —— | $141,829 | —– | 90 | $1,135 |
| 2008 | 138 | 10.40% | 21,843 | 93.40% | $320,799 | 126.19% | 158 | $2,325 |
| 2009 | 149 | 7.97% | 51,584 | 136.13% | $713,121 | 122.30% | 346 | $4,786 |
| 2010 | 156 | 4.70% | 446,791 | 866.14% | $5,882,247 | 824.86% | 2864 | $37,707 |
| 2011 | 177 | 13.46% | 162,275 | -63.68% | $2,786,438 | -52.63% | 917 | $15,743 |
| 2012 | 171 | -3.39% | 80,560 | -50.36% | $1,594,016 | -42.79% | 471 | $9,322 |
| 2013 | 195 | 14.04% | 68,140 | -15.42% | $1,401,748 | -12.06% | 349 | $7,188 |
| 2014 | 213 | 9.23% | 61,584 | -9.62% | $1,303,069 | -7.04% | 289 | $6,118 |
| 2015* | 165 | -22.54% | 65,254 | 5.96% | $1,478,997 | 11.35% | 395 | $8,964 |
| 2016* | 191 | 15.76% | 90,222 | 38.26% | $1,992,643 | 34.73% | 472 | $10,433 |
| 2017 | 283 | 48.17% | 117,950 | 30.73% | $2,847,629 | 42.91% | 417 | $10,062 |
| 2018 | 323 | 14.13% | 108,897 | -7.68% | $2,595,362 | -8.86% | 337 | $8,035 |
| 2019 | 378 | 17.03% | 129,934 | 19.32% | $2,786,185 | 7.35% | 344 | $7,371 |
| 2020 | 460 | 21.69% | 125,464 | -3.44% | $2,599,092 | -6.72% | 460 | $5,650 |
Oni has no books over 10k.
After this, I am left with seven remaining books in the Top 750 that aren’t at one of the above publishers in 2020.
In sales order, then, the best-seller of this final tranche of books is “The Fantastic Flatulent Fart Brothers Big Book of Farty Facts” which sells, if you can believe this, almost 38k copies. It is published by Top Floor Books, and, as it is distributed by Lightning Source, this in theory makes this a print-on-demand book.
Following closely at almost 33k copies sold is “The Action Bible: God’s Redemptive Story”, published by David C Cook.
Another print-on-demand title from Lightning Source, “Noise: A Graphic Novel Based on a True Story”, independently published by Kathleen Raymundo, sells a bit over 19k.
The self-published single volume edition of the black-and-white version of Jeff Smith’s “Bone” sells almost 9500 copies.
Capstone Press finally breaks the Top 750 with a licensed-from-“Sports Illustrated” book of “Quarterback Rush”, which sells about 8300 copies. Capstone mostly does licensed books and public domain adaptations in library-binding hardcovers. I suspect strongly they do exceptionally well in the academic market, but we can’t see any of those sales as NPD BookScan is retail-only.
Insight Comics also makes the Top 750 for the first time, with Michael Allred’s wonderful bio “Bowie: Stardust, Rayguns & Moonage Daydreams” which sells about 7200 copies.
And finally, from NBM/Papercutz, is “The Loud House 3-in-1: There will be Chaos…” which does a bit over 7100 copies.
Whew!
A few final bits of number-crunching for fun before we go for the year!
First and foremost: for those of you whom have actually seen a NPD BookScan chart, I’m sure you noticed that one of the columns is listed as “publishers”. I’ve never been able to understand why: that column is clearly the distributor column, with the (very very) weird exception of DC Comics. DC (and Dark Horse, and IDW, and others) are distributed by Random House in the bookstore market, not Diamond. Marvel is distributed by Hachette. Boom! and Viz are distributed by Simon, and so on. Now most analysis that I do I get fairly rigorous about going in and fixing problems, but this is a simple top level search where I’m just going to accept what it tells me without question. So who are the leaders for distribution, over the breadth of the entire NPD BookScan list? This is by pieces sold, of all 29 million books sold in 2020 that NPD BookScan reported. There are two hundred and twenty four different distributors for books.
Turns out it looks like this in 2020:
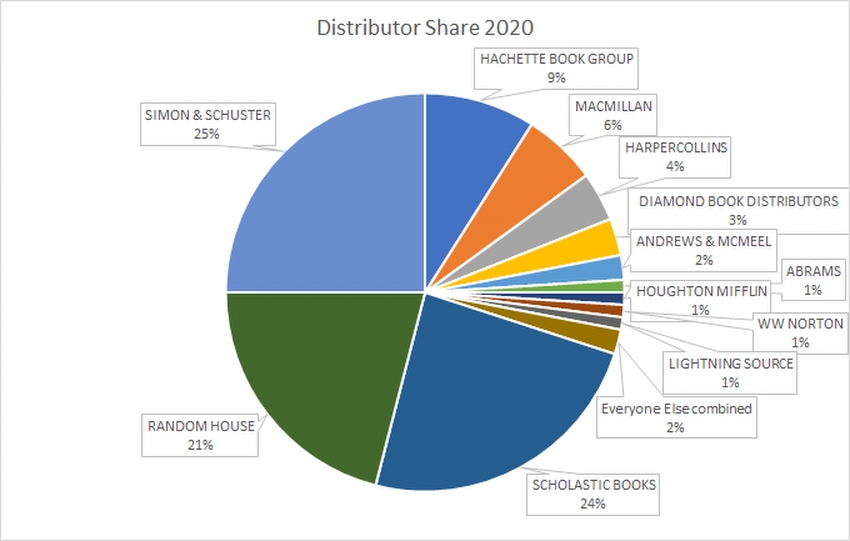
Not what you pictured in your head, was it? This chart is one of the reasons why it was always hard to call Diamond a true “monopoly”, despite their once domination of the Direct Market – they are just 3% of sales in the book market.
Lastly: if we look at the entirety of the 44k-long “Long Tail” NPD BookScan list, how do the publishers (all 1777 of them) stack up in 2020? This is everything, including both “east” and “west” comics, and we’ll sort it by Calculated Retail Value, and rounding everything to the nearest hundred-thousand just for ease of presentation. This is a list of any publisher on a quick sort that generated $1m or more in Calculated Dollar Sales. Please remember, just because I can calculate what the dollars should be, there is zero evidence that these books were actually sold at full retail price. Certainly, the existence of Amazon alone throws that deeply into doubt!
Scholastic is the biggest publisher in the Book stores, followed very very closely by Viz, then distantly followed by DC and Dark Horse. Those top four publishers together are larger than the bottom 1773 publishers combined!
| #1 | SCHOLASTIC BOOKS | $95.6 |
| #2 | VIZ MEDIA | $94.8 |
| #3 | DC COMICS | $36.3 |
| #4 | DARK HORSE | $31.5 |
| #5 | KODANSHA COMICS | $21.3 |
| #6 | HACHETTE BOOK GROUP | $21.0 |
| #7 | MARVEL COMICS | $20.8 |
| #8 | RANDOM HOUSE | $20.5 |
| #9 | HARPERCOLLINS PUBLISHERS | $19.4 |
| #10 | MACMILLAN | $16.4 |
| #11 | ANDREWS MCMEEL PUBLISHING | $13.5 |
| #12 | IDW PUBLISHING | $11.6 |
| #13 | IMAGE COMICS | $11.4 |
| #14 | SEVEN SEAS | $9.9 |
| #15 | ABRAMS | $4.9 |
| #16 | BOOM! STUDIOS | $4.6 |
| #17 | VERTICAL | $3.2 |
| #18 | HOUGHTON MIFFLIN HARCOURT | $3.1 |
| #19 | FANTAGRAPHICS BOOKS | $2.9 |
| #20 | DYNAMITE ENTERTAINMENT | $2.7 |
| #21 | ONI PRESS | $2.6 |
| #22 | HYPERION BOOKS | $2.4 |
| #23 | DRAWN & QUARTERLY | $2.0 |
| #24 | SIMON & SCHUSTER | $1.9 |
| #25 | TITAN COMICS | $1.2 |
| #26 | DAVID C COOK | $1.0 |
And that’s pretty much what NPD BookScan in 2020 looks like to these eyes.
How does it look to you?
* * * * * * * * * *
How Does The Sausage Get Made???
I like methodology, so here is entirely too much detail on what I do, and how I do it each year.
“Direct Market” stores (also known as “your Local Comics Shop”) buy much of their material for resale from Diamond Comics Distributors (though, not, by any means, all of the material your LCS has for sale – many DM stores are also buying from book-market wholesalers, or directly from publishers and have been for years). While many DM stores have Point-of-Sales (POS) systems, because our market typically buys non-returnable what we track in our side of the industry is what sells-in to the store, not what sells-through to the eventual consumer. In a very real way, this means that the DM store owner is the actual customer of the publisher, as opposed to the end consumer.
The bookstore market, however, buys their material semi-returnable, where they can send back some portion of titles that don’t sell (but not, usually, all unsold product). Because of this, sell-through is the data that is tracked and trended. Bookstores that have POS systems are able to report their sales to NPD BookScan, a subsidiary of The NPD Group (they bought it from Nielsen).
NPD BookScan tracks the specific sales to consumers through its client stores. I had several well trained spies who have, for many years, provided me with access to the NPD BookScan reports at the end of each year. However, I am very excited to say that we are now getting the NPD BookScan reports directly from The NPD Group, with no filter or middleman! This is our third year of doing so.
However, getting “official” detail has brought a major change as of last year: NPD Group no longer wants us releasing the actual data, even the pretty tight “Top 750” as has been our historical practice. I am fairly certain that, if you know how to search the internet, you could probably turn up previously published links from 2003 through 2017, but going forward, you will have to trust my abstract of the charts, rather than seeing the charts themselves. So sorry!
(For points of comparison, try these links to the earlier pieces:
2019: My Analysis
2018: My Analysis
2017: My Analysis
2016: My Analysis
2015: My Analysis
2014: My Analysis
2013: My Analysis
2012: My Analysis
2011: My Analysis
2010: My Analysis
2009: My Analysis
2008: My Analysis
2007: My Analysis
2006: My Analysis
2005: My Analysis
2004: My Analysis
2003: My Analysis)
For some historical context, we have three “eras” of data: 2003-2005 numbers are “what is YTD sold, IF it made the chart in the last week of the year?”
2006-2016: the full “here’s everything that sold throughout the entire year”, but filtered through a leaker – almost certainly accurate, but absolutely missing some bits due to methodology changes and differences, even year-by-year. Important: in 2015 and 2016 I received lists that appeared to be lightly edited, potentially down to “books that are in print at the publisher level only” (obviously, there’s still stock out there on the shelves of stores and in warehouses that is not “in print” per se). Those two years are asterisked to reflect that!
2017-now: “Everything” sold in the calendar year, with no filter. (Though see further notes below!)
Just bear this all in mind if you compare the various “eras” against one another. These are not inherently apples-to-apples comparisons as a result! Moving forward there should be a much deeper consistency of data.
The biggest and most obvious difference when doing straight comparisons will be in the lower ends of the chart. This year, the “worst selling” book in the Top 750 is just about 4700 copies (up significantly from about 3800 copies last year) In ’03-‘05 there would be many items that didn’t have YTD sales in anything like that amount.
Also of major note is that starting in 2007, I have had the “full and entire” NPD BookScan listing, down to books that have only one copy sold YTD. However, I’ve never tried to really analyze that entire list because that’s too much data, even for a data-junkie like myself. I’ve cut the list off at 750 items because that’s what we’ve historically reported. Still, I have the deeper data, and I’ll summarize it as we go along. As long as I continue to get that much data going forward, I should be able to tell you a few things about “The Long Tail”. In 2018, I possess data on 40,755 items! (for 2018 this was 38,422 items) We’ll talk more about this later in some depth, including the methodology of how these are generated.
This is important, however: this is not a list of every book that sold through every book store – the report is limited to those stores that report to NPD BookScan. According to NPD BookScan, more than 7500 venues report to them, but this still leaves many venues that don’t.
Neilsen claimed in 2013 that approximately 85% of retail, physical book sales are tracked through them, though this number appears very much in doubt as an actionable percentage for any specific individual book. A quick internet search can find any number of cases of authors saying that NPD BookScan numbers show half or less of their royalty statements. There’s some really excellent discussion on why and by how much NPD BookScan numbers might be off right here.
NPD BookScan says “Barnes & Noble, Amazon, Costco, General Independents, Hastings, Target, BJ’s, K-Mart, Hudson Group, Meijers, Follett Books, Books-A-Million, CEO Read, Powells, Toys R Us, Shoprite, SuperValu, Sam’s Club and Walmart are among our many data providers.”
What sales do NPD BookScan not track? Among others, this would include libraries, schools, specialty stores (like comic book stores!) and book clubs and fairs. NPD BookScan does not track sales at most independent bookstores. For many books those are very very important sales channels, and thus, NPD BookScan under-reports by some potentially significant degree, and don’t, in any way, represent all physical book sales or even all “book stores” selling comic book material.
There’s also a certain amount of miscategorization going on. As an example, for the last sixteen years the purely-prose novel Bloody Crown of Conan appears on my list, while other books (see; Dork Diaries in a few paragraphs) might appear one year, and disappear another. I do not know what the actual extent of miscategorization might be and how it would impact any of the general data analysis! There are simply too many potential data points to possibly connect them all together in the time I have to assemble this column.
I’ve done the best I can to try and root out any items “of significance” that should be on the chart that I’m given, but are not – for example, I have to have The Complete Persepolis and Maus manually pulled for me every year because of how BISAC codes work. Because this relies on me catching these titles to get them on to the list this means there’s almost certainly comics material missing that I didn’t catch. If you can think of a book I might have missed, please email me, and I’ll try to track down the sales for it, and update my listings for the future! Even with my multiple safeguards, the datastream is too wide for me to not make mistakes. I make constant mistakes, as you’ll see further down in the body of the column.
Either way, what I’m trying to get across to you is that this really is entirely unreliable data in terms of the absolute and total number of books sold, and is only able to give the broadest possible outline of what’s happening in book stores, based upon the data-set that I’m being given, which is in no way comprehensive. I still think that’s much much better than having no information, so I persevere in writing this each year. Also, now that I am getting directly from the NPD Group, I feel much more confident that I at least know where the potential problems generally are.
Again, I want to stress that I’m doing my primary analysis on the Top 750 items: the reason for this is that is all that I was able to get in the first four years of this analysis, and otherwise the percentage changes I’m discussing will be even more wrong than they would be otherwise. The Top 750 represents more than half of the total of the full list, and has consistently for years – in 2019 the Top 750 was roughly 15.5 million books sold; the bottom forty thousand-ish represents just about 9.2 million books sold. While there are significant sales below the Top 750, the Top 750 probably represents the majority of items you’d be able to “easily” find on the shelf of a bookstore in America. I’d love to analyze the full “long tail” list, but I’m afraid that this might take these little essays to triple their current size, and keeping your attention just through this seems hard enough to me! Maybe if someone paid me by the word…!
Finally, it is probably worth mentioning that although I’m analyzing primarily units sold, I also have some calculations that are purely my own of dollars that they would have been if they were sold at full retail. NPD BookScan does not report on the price that a book actually sold for, so the extrapolation of dollars that I made could be dramatically overstated. More than “could be”: it probably is… because Amazon sells so many books, often at crazy steep discounts. In no way should you take any “Calculated Retail Value” as TRUE – these are just to provide a series of benchmarks, and to help you see the impact and differences that “cover price” can make in sales.
If it was not obvious, this only counts physical books, and does not include any digital sale of any kind; it does however, include physical books sold through Amazon.
One of the things I really never talk about is how I get this data each year. I certainly don’t have a NPD BookScan account (they’re pretty expensive!), so I have historically dependent on leaks from industry sources. But this means that the methodology with which the data was generated may actually be very different from year to year. The thing is, since I don’t generate these, NPD BookScan methodology is still largely a Black Box to me. For a guy who writes these reports for 17 (!) years, I still have only really a passing knowledge of how things work. I am learning, slowly, though!
Now that the NPD Group is directly providing us data, we can assume that the methodology itself will not change going forward, yay!
A Bunch of Information about BISAC codes and how this report is generated!
Here’s where we learn a little bit about the Book Industry Standards and Communications (or “BISAC”) codes. It turns out that the publishers assign them themselves, and that publishers are allowed to assign up to four different BISAC codes per item. For example: “Diary of a Wimpy Kid” is classified as “Juvenile Fiction: Humorous Stories”; “Juvenile Fiction: Comics & Graphic Novels: General”; and “Juvenile Fiction: Social Issues: General”. But the kicker is that NPD BookScan reports will only spit out for the first BISAC listed for any given book. That is why “Diary of a Wimpy Kid” never ever showed on any of our previous reports, because the “comics” designation of the BISAC is listed second for that series! Conceptually I could also ask for “Juvenile Fiction: Humorous Stories” report, too – but that’s going to have thousands and thousands of prose-only, not-even-slightly-comics items on it, and working to cut those would quintuple the hours I spend on this (no thanks!) This is also why I have to manually ask for titles like “Maus” or “Persepolis” or “Understanding Comics” each and every year – not because they don’t contain the BISAC for comics (“CGN00xxxx” are the primary ones, for the record), but because that BISAC isn’t listed first!
Now, historically, this has really been opaque to me, to the point where I didn’t even really know what BISAC was what, but The NPD Group has been incredibly forthcoming, and I’m learning enough that I almost understand it. First and foremost, we’re now having the report generated using the codes for “Comics & Graphic Novels” (CGN), as well as the “comics” portions of “Juvenile” fiction (JUV) and nonfiction (JNF), and Young Adult Fiction (YAF) and non-fiction (YAN). Please note that the J and Y series of codes extend far past “comics”, but our search is for the narrower section. In addition to that, the NPD Group pulled records for three prominent authors that seldom showed up without intervention: Art Spiegelman, Marjane Satrapi, and Scott McCloud (As well as a small handful of books that I crosschecked against my own best sellers)
So you know, there are more than seventy-five “main” BISACs that we’re pulling in full.
Again, the publishers are the ones who assign the BISACs, and they can assign up to four per book. But reports can only generate (for now) from what the first BISAC code is listed – The NPD Group tells me they’re working on fixing that, but it’s a limitation of the current tools. That’s why they pulled by Author for Art Spiegelman – and look at how MAUS breaks down: the first individual volume has a primary BISAC of HIS022000 (“History: Jewish”), while the complete hardcover is BIO006000 (“Biography: Historical”). But the box set of the two paperbacks is BIO000000 (“Biography: General”), and METAMAUS (the book, with supporting documentation) for some reason is categorized as LIT017000 (“Literary: Comics & Graphic Novels”) which I’m not at all certain how that is different from CGN006000 (“Comics & Graphic Novels: Literary”) – but my point is that you have essentially one book that the publisher itself doesn’t really know what the “primary” BISAC should be.
There’s also more than a few dumb-ass choices, like how JUV008010 (Juvenile Fiction: Comics & GNs/Manga) features a not-even-slightly “manga” HILO by Judd Winick. These kinds of categorization problems pepper the entire database.
Additionally, only (apparently) the publishers can change BISACs, so even if I find errors year after year (god damn that BLOODY CROWN OF CONAN!!!), it’s very very difficult to convince folks that it matters enough to devote man-hours to fixing up, even if the folks at The NPD Group agree.
If you want to learn more about the theory and practice of BISAC codes, you can go and follow this link. (It’s a trap!)
The main thing to know is that while BISAC is a pretty good system for categorizing books because it is solely in the publisher’s hands it has some pretty extreme limitations when creating reports with it as the sole basis. There is not, however, any other way to generate this data without using those limitations, to the best of my knowledge.
Either way, prior to 2017 numbers, the exact methodology from my leakers was slightly different every year and sometimes we got weird spikes and discrepancies. For example, as far as I can tell, in 2014 and prior we were always getting every book that sold one copy anywhere, then in 2015, and slightly in 2016, we’re getting a lightly edited list that only listed in-print books from some (but not all!) publishers. I put an asterisk on 2015 and 2016 because it was missing several thousand data points… But those very strongly appeared to be datapoints that may not materially affect the actual bottom-line health of dollars and pieces the charts (you’ll see this year, I think). Either way, I really must once again urge you to treat every datapoint presented here as only part of the possible picture!
Hopefully this gave you a good understanding of methodology and such!
**************************
Brian Hibbs has owned and operated Comix Experience in San Francisco since 1989, was a founding member of the Board of Directors of ComicsPRO, has sat on the Board of the Comic Book Legal Defense Fund, and has been an Eisner Award judge. Feel free to e-mail him with any comments. You can purchase two collections of the first Tilting at Windmills (originally serialized in Comics Retailer magazine) published by IDW Publishing, as well as find an archive of pre-CBR installments right here. Brian is also available to consult for your publishing or retailing program.


Too long, jerk! Also, some of my formatting (like breaks between individual publishers!) got dropped this year, whooops.
Thank you for writing this every year! I always enjoy the manga portions.
I’m super excited to see your 2021 report next year, considering that manga series regularly appear on the weekly Trade Paperback Frontlist on Bookscan through Publishers Weekly. Manga sales growth has skyrocketed this year to an incredible extent. I’ll be interested in seeing if another manga publisher will make it into the Top 750 next year or will be edged out by all of Viz sales. So many manga pubs are actually limited by the amount that they can print per printing – I can imagine how well newer series like Chainsaw Man or Jujutsu Kaisen would actually sell if they had printed more than 20-30k per initial printing.
It’s pretty pathetic to see how Marvel hasn’t invested at all in the future compared to DC, which seems to have gotten great returns on their young adult initiative with their #2 book selling 40k copies and #3 selling 28k. Marvel not selling over 10k copies in a book despite being a juggernaut in movies is really concerning.
Nice report. Raina’s books might be on top if she were faster, but I’m astounded that Dav Pilkey can produce so many pages a year. He’s like Jack Kirby on steroids. And unlike monthly floppies, his graphic novels (mostly) stay in print, and his sales keep snowballing. It confuses me that Image and Marvel focus on the tiny over-50 segment of the market (and Marvel offloads tweens to other companies). I know DC is trying to succeed in this space, but you need the right combination of character, writer, artist. If I were them, I’d hire top creators to work exclusively on Raina-format books: Yang, Shaner, Balthazar, Sen, Gurihiru, Simone, Frank, Johns, Tamaki, Conner, Waid.
amazing work, thank you brian!
It seems like Scholastic is probably the largest and most successful publisher of comics today, even when you add in direct market sales, right? Are Viz now bigger than the legacy “big 2” publishers?
I’m sure publishers are moving a lot of units via digital channels too; I know my kids have purchased a couple of Raina books via the Kindle app on our iPad.
Regardless, I agree that this is the beginning of a very promising trend for people who like sequential art. I can’t wait to see what the industry looks like in 10-15 years.
Marvel was over $200 million in the DM in 2019, and DC some ways back from that — and while both would have slid a bit in 2020, they’re surely above the level VIz is at once their other channels are included. Scholastic, I’m not sure you can say that about any more (especially since we know their book fair and other channels add a lot).
Still can’t help but question some numbers with bookscans.
Comments are closed.