

Sponsored by Battle Quest Comics
By Brian Hibbs
“There are three kinds of lies: Lies, Damned Lies, and Statistics”
Welcome to the 2022 Bookscan analysis – and it’s a doozy: the craziest, largest growth that we have ever seen in the Top 750 – with more comics material sold in 2021 than 2018 and 2019 combined.
Preposterously, this is the nineteenth annual report of something that is hard to exactly perceive and understand: the size and shape of the sales of graphic novels and trade paperbacks through the book store market, as seen through the prism of NPD BookScan.
There is a tremendous amount that goes into making these reports, and a whole lot of detail of how these lists get generated, but my wise editor believes that most folks just want to get to the numbers. So, if you are interested in how the sausage gets made, please go down to the bottom of the column for lots of lots of in-depth details.
I will summarize a few things top level concepts here, however: all sales reported here are generated by The NPD Group, which runs NPD BookScan. These reflect actual sales made through bookstores that report to NPD, which includes Amazon. NPD believes that some 85% or more of book sales are captured by them – so even best-case scenario, these are a little light. They also include a few comic book specialty stores via those stores that use the Comichub point-of-sale system, though it is extremely unclear just how much of comic store sales they are capturing. Comichub is absolutely no better than the #2 POS system, and they could be significantly smaller. (More comprehensive records of Direct Market purchases in 2021 can be found in the excellent reports by John Jackson Miller’s Comichron)
But this BookScan report obviously only includes books sold through the venues that report to NPD BookScan – it certainly doesn’t include sources of sales like, for example, school library purchases, or direct-to-consumer sales through things like the Scholastic book fairs. In some cases, those numbers could be many multiples of the retail trade. I certainly expect that something as broadly popular as Dog Man (the #1 book in 2021) is selling at least twice as many copies (and maybe much much more!) through academic channels. However, this is beyond the scope of this survey.
This also only includes physical books sold! No digital of any kind.
Also for a top-level note: I am myself a Direct Market (comic book store) retailer – while my individual focus is on book-format material, I have a lot of biases, both visible and invisible that I bring to these reports. Please bear these in mind as you read my analysis!
(For points of comparison, try these links to the earlier pieces:
2020: My Analysis
2019: My Analysis
2018: My Analysis
2017: My Analysis
2016: My Analysis
2015: My Analysis
2014: My Analysis
2013: My Analysis
2012: My Analysis
2011: My Analysis
2010: My Analysis
2009: My Analysis
2008: My Analysis
2007: My Analysis
2006: My Analysis
2005: My Analysis
2004: My Analysis
2003: My Analysis)
I have historically divided the data between the “Top 750” because a) that’s all the data I was initially leaked back in 2003, b) it’s a “manageable” chunk of data, and c) “as above, so below” – the top 750 represents about half of sales. However, since 2007, I’ve received the entire database, which now gives us a solid fifteen years of data to track. I refer to this as “the Long Tail”. This year’s “Long Tail” has more than 47k items! That’s a lot! And a whole lot of those books are selling copies that don’t even add up to one hundred copies sold in a year.
I also do a rough calculation by multiplying the number of copies sold (a firm number) against the cover price, in order to calculate a retail dollar sales figure (calculated retailer dollars or CRD on the charts.). This is not actually a real number, because a significant percentage of these books sold for less than cover price (thanks Amazon!)
The first thing that I have to do once I receive the report from NPD BookScan is to edit the data I am sent, removing all of the things that are not comics. I literally hand-checked thousands of items every YEAR against Amazon’s “Look Inside” feature” to say “is this a comic or not?” I defined “comics” like this: either a) it has multiple panels sequentially producing a narrative (those don’t have to be on ONE PAGE, so someone like Mo Williams is certainly comics) OR b) a single image that, taken solely by itself, provides a complete thought. So, The Far Side is comics, but, no, Diary of a Wimpy Kid is NOT (but very glad to see that number as a comparative)
Using these working definitions, starting in 2018 I decided to cut some items that had previously been included: chief among best-sellers would be Rachel Renee Russell’s Dork Diaries series – they have words, they have pictures, but they don’t work together in the way I’d think we’d commonly agree is “comics”. I also removed prose-driven books like DK Publishing’s Marvel Encyclopedia, which, while nominally about comics or comics culture, is factually an encyclopedic prose book with pictures. Or Wonder Woman: Warbringer which is a straight-up prose novel that happens to feature a comics character, or DC Super Heroes: My First Book of Girl Power which the Amazon “Look Inside” clearly shows is an illustrated reader for 2nd graders. There is clearly an enormous market for this kind of material – in fact, in many cases a larger market than for the actual comics themselves – it just isn’t the “comics” market, as I would define it.
[Editor’s Note: Bookscan lists the writer as the author, so artist’s names are not always included below – for that we apologize.]
With that out of the way, here’s the big picture for just the Top 750 in 2021:
| Year | Total Unit | Growth | Calculated Retail Value | Growth |
| 2003 | 5,495,584 | ——- | $66,729,053 | ——– |
| 2004 | 6,071,123 | 10.5% | $67,783,487 | 1.6% |
| 2005 | 7,007,345 | 15.4% | $75,459,669 | 11.3% |
| 2006 | 8,395,195 | 19.8% | $90,411,902 | 19.8% |
| 2007 | 8,584,317 | 2.3% | $95,174,425 | 5.3% |
| 2008 | 8,334,276 | -2.9% | $101,361,173 | 6.5% |
| 2009 | 7,634,453 | -8.4% | $93,216,014 | -8.0% |
| 2010 | 6,414,336 | -15.9% | $85,266,166 | -8.5% |
| 2011 | 5,696,163 | -11.2% | $79,961,951 | -6.2% |
| 2012 | 5,438,329 | -4.53% | $89,918,354 | 12.45% |
| 2013 | 5,654,351 | 3.97% | $96,062,709 | 6.83% |
| 2014 | 6,659,031 | 17.77% | $112,768,709 | 17.39% |
| 2015* | 8,762,983 | 31.60% | $141,226,518 | 25.24% |
| 2016* | 9,967,907 | 13.75% | $159,510,075 | 12.95% |
| 2017 | 10,310,682 | 3.44% | $154,026,517 | -3.44% |
| 2018 | 11,755,903 | 14.02% | $165,885,527 | 7.70% |
| 2019 | 15,537,520 | 32.17% | $226,370,566 | 36.46% |
| 2020 | 18,245,279 | 17.43% | $274,308,460 | 21.18% |
| 2021 | 30,698,081 | 68.25% | $443,735,058 | 61.76% |
Well: as mentioned above, this is the craziest, largest growth that we have ever seen in the Top 750! In 2021, comics thoroughly exploded in a way that almost defies rationality – not only was raw circulation up by nearly 70% (!), more comics material was sold in 2021 than 2018 and 2019 combined (!!) If we compare the 2021 sales to our first BookScan report in 2003, there’s more than a 558% growth in number of copies sold (!!!). If I didn’t see the numbers written in black & white, I’m not sure I’d even believe it.
But… there they are. Wow.
(I want to remind you that while I asterisk 2015-2016 because the sheer number of data points that I was getting was probably edited, it appears that the top 750 itself was fairly rock solid – there is more on this down below in the sausage making section)
The trend for print books in general (not just looking at comics) through bookstores in 2021, according to the NPD group and NPD BookScan appears to be a general rise of 8.9% in 2021, which does nothing but continue the now eight-year trend of comics-material being significantly stronger than the general curve – though this year’s level of growth is clearly unprecedented!
(For what it is worth, overall Top 4000 book [only] sales through Diamond in the Direct Market appear to be down by about 2%, (in dollars, Comichron isn’t calculating pieces here) so the book market performed incredibly better in the book category – however, I want to reiterate that “Direct Market” retailers are not necessarily buying their book stock from Diamond any longer. What’s curious is that book sales show as -2%, but Comichron calculates the overall sales of comics in the Direct Market as being up by 49%, which isn’t wildly out of line with the bookstores. Deep deep into the micro, my own individual sales were up about 33%, but San Francisco is having a very slow recovery from COVID, sadly)
As mentioned above, the top 750 represents about half of sales – looking at “the Long Tail”. Here’s what the sales of all comics NPD BookScan tracks in this category looks like – but, seriously, let me remind you that the dataset changes enough each year this can be an awkward set of comparisons! Even putting aside “the asterisk years”, prior to 2013 this didn’t include Walmart, for just one example (of scores) of the lack of direct comparison.
| Year | # of listed items | Percent Change | Total Unit Sold | Percent Change | Calculated Retail Value | Percent Change | Av. Sale per title | Av $ per title |
| 2007 | 13,181 | —– | 15,386,549 | —– | $183,066,142 | —– | 1167 | $13,888.64 |
| 2008 | 17,571 | 24.98% | 15,541,769 | 1.00% | $199,033,741 | 8.02% | 885 | $11,327.40 |
| 2009 | 19,692 | 12.07% | 14,095,145 | -9.31% | $189,033,736 | -5.02% | 716 | $9,599.52 |
| 2010 | 21,993 | 11.68% | 12,130,232 | -13.94% | $172,435,244 | -8.78% | 552 | $7,840.32 |
| 2011 | 23,945 | 8.88% | 11,692,058 | -3.61% | $175,634,490 | 1.86% | 488 | $7,334.91 |
| 2012 | 23,365 | -2.42% | 9,562,236 | -18.22% | $164,415,366 | -6.39% | 409 | $7,036.82 |
| 2013 | 24,492 | 4.82% | 10,153,628 | 6.18% | $176,419,370 | 7.30% | 415 | $7,325.63 |
| 2014 | 26,976 | 10.14% | 11,820,324 | 16.41% | $207,598,355 | 17.67% | 438 | $7,695.56 |
| 2015* | 22,431 | -16.85% | 15,269,550 | 29.18% | $259,807,532 | 25.15% | 681 | $11,582.52 |
| 2016* | 21,295 | -5.06% | 17,302,891 | 13.32% | $293,583,180 | 13.00% | 813 | $13,786.48 |
| 2017 | 35,338 | 65.95% | 18,385,086 | 6.25% | $302,300,435 | 2.97% | 520 | $8,554.54 |
| 2018 | 38,424 | 8.73% | 19,965,469 | 8.60% | $318,345,707 | 5.31% | 520 | $8,855.07 |
| 2019 | 40,745 | 6.06% | 24,694,686 | 23.69% | $399,322,754 | 25.44% | 606 | $9,800.53 |
| 2020 | 44,316 | 8.76% | 29,251,619 | 18.45% | $480,408,257 | 20.31% | 660 | $10,840.51 |
| 2021 | 47,630 | 7.48% | 51,822,538 | 77.16% | $826,280,847 | 72.00% | 1088 | $17,347.91 |
Overall, this is our topline conclusion for NPD BookScan 2021: Up nearly 7.5% in total number books listed, up an insane 77% in Units Sold, and up 72% in the “calculated retail value.” As you read through individual publisher listings, you can compare their “long tail” performance this year against those benchmarks to see if they overperformed or underperformed in the market.
As amazing as those topline numbers look, please remember that it really is largely “hits” that are driving the business – the “average” book still only sold approximately one thousand and eighty-eight, nationwide, in the entire year. Almost no one can earn a living from that (including book sellers!)
THE NPD BOOKSCAN 2021 TOP 20
Let’s take a look at the Top 20 best-selling items on the 2021 chart; it looks like this:
| Title | ` | Unit sales | |
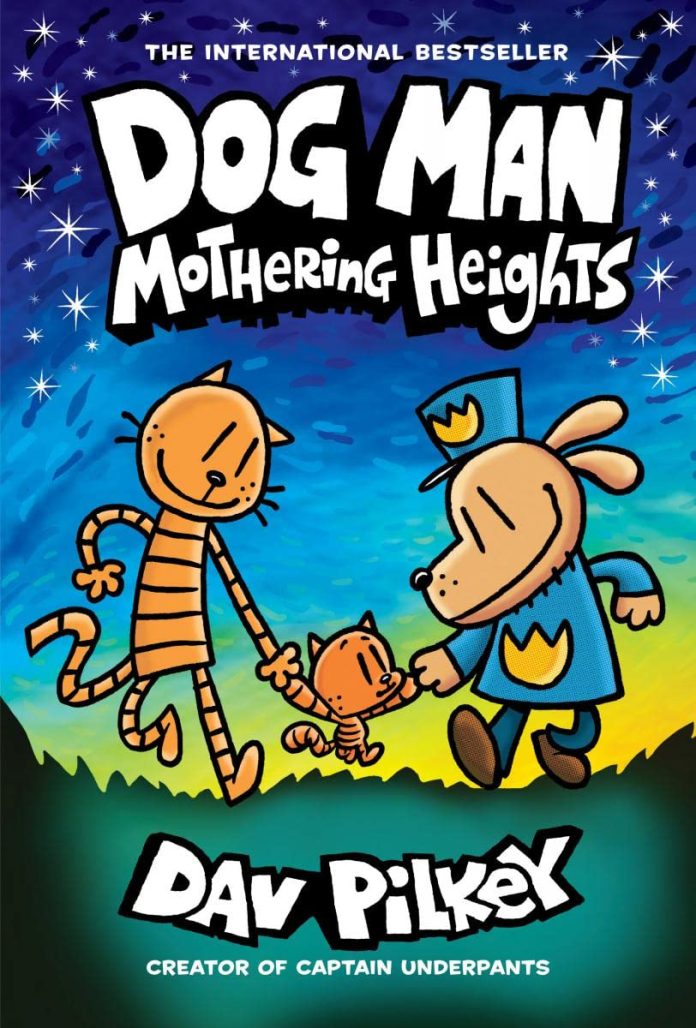
| 1 | DOG MAN: MOTHERING HEIGHTS: A GRAPHIC NOVEL (DOG MAN #10) | PILKEY, DAV | 1,295,470 |
| 2 | CAT KID COMIC CLUB: A GRAPHIC NOVEL (CAT KID COMIC CLUB #1) | PILKEY, DAV | 617,821 |
| 3 | DOG MAN: GRIME AND PUNISHMENT: A GRAPHIC NOVEL (DOG MAN #9) | PILKEY, DAV | 557,918 |
| 4 | CAT KID COMIC CLUB: PERSPECTIVES: A GRAPHIC NOVEL (CAT KID COMIC CLUB #2) | PILKEY, DAV | 424,094 |
| 5 | DOG MAN: FOR WHOM THE BALL ROLLS: A GRAPHIC NOVEL (DOG MAN #7) | PILKEY, DAV | 331,928 |
| 6 | CLAUDIA AND THE NEW GIRL: A GRAPHIC NOVEL (THE BABY-SITTERS CLUB #9) | EPSTEIN, GABRIELA | 313,092 |
| 7 | DOG MAN: FETCH-22: A GRAPHIC NOVEL (DOG MAN #8) | PILKEY, DAV | 291,461 |
| 8 | THE TWISTED ONES: AN AFK BOOK (FIVE NIGHTS AT FREDDY’S GRAPHIC NOVEL #2) | CAWTHON, SCOTT | 250,180 |
| 9 | WINGS OF FIRE: THE DARK SECRET: A GRAPHIC NOVEL (WINGS OF FIRE GRAPHIC NOVEL #4) | SUTHERLAND, TUI T. | 214,260 |
| 10 | THE SILVER EYES (FIVE NIGHTS AT FREDDY’S GRAPHIC NOVEL #1) | CAWTHON, SCOTT | 210,763 |
| 11 | GUTS: A GRAPHIC NOVEL | TELGEMEIER, RAINA | 188,937 |
| 12 | KRISTY AND THE SNOBS: A GRAPHIC NOVEL (THE BABY-SITTERS CLUB #10) | CHAU, CHAN | 172,402 |
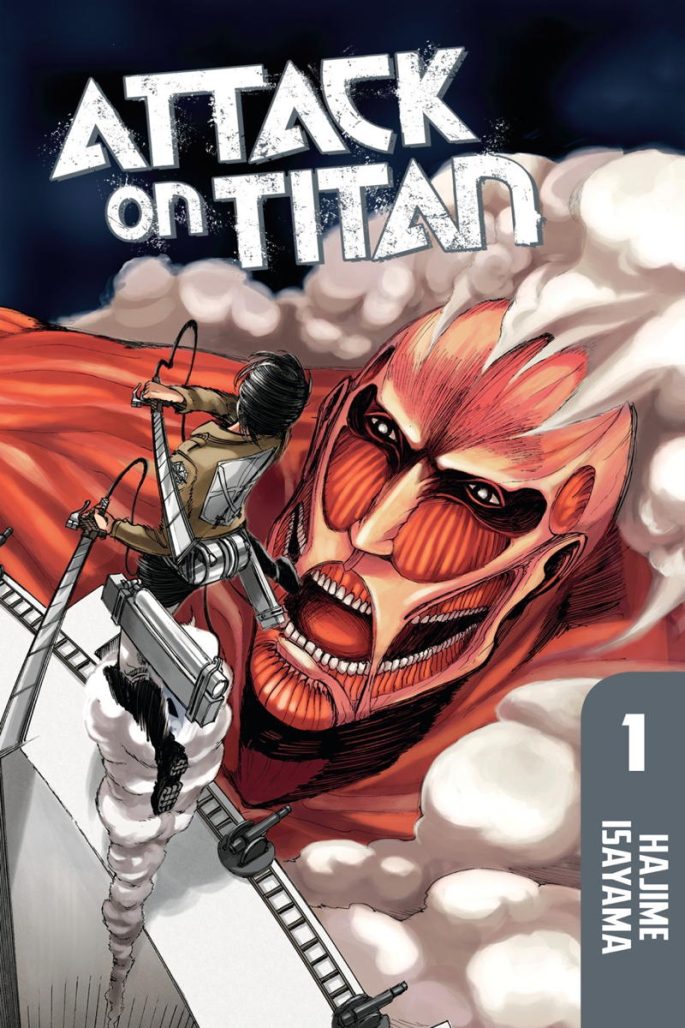
| 13 | ATTACK ON TITAN 1 | ISAYAMA, HAJIME | 169,582 |
| 14 | MY HERO ACADEMIA, VOL. 1 | HORIKOSHI, KOHEI | 162,949 |
| 15 | DOG MAN: BRAWL OF THE WILD: A GRAPHIC NOVEL (DOG MAN #6) | PILKEY, DAV | 161,084 |
| 16 | DEMON SLAYER: KIMETSU NO YAIBA, VOL. 1 | GOTOUGE, KOYOHARU | 158,292 |
| 17 | DOG MAN: A GRAPHIC NOVEL (DOG MAN #1) | PILKEY, DAV | 154,629 |
| 18 | FGTEEV SAVES THE WORLD! | FGTEEV | 154,222 |
| 19 | CHAINSAW MAN, VOL. 1 | FUJIMOTO, TATSUKI | 150,495 |
| 20 | LOGAN LIKES MARY ANNE!: A GRAPHIC NOVEL (THE BABY-SITTERS CLUB #8) | GALLIGAN, GALE | 150,128 |
Depending on your exact definitions of intended audiences, it appears that seventeen of the Top 20 is intended for children or middle readers. Four of the Top 20 are Manga, and if you are looking for a “Marvel / DC-style” comic, you are not even in the top hundred-and-fifty! In fact, the first DC comic to appear is at #164 with the middle reader aimed Teen Titans: Beast Boy (with Teen Titans: Beast Boy Loves Raven coming in at #200, and former best-selling Watchmen not showing up until #250) As for Marvel? Their very first appearance isn’t until (gulp) alllll the way down at #892 with Infinity Gauntlet – this means that Scholastic’s Miles Morales: Shock Waves radically outperforms any published-by-Marvel comic, coming in at #202 (We’ll talk more about this below)
Not a single book in the Top 20 sells less than 150k copies (it was 132k in 2020, and not even 100k in 2019), and the combined circulation of the Top 20 is over 6.1 million copies – nearly 8.5% of the unit sales of all 47k different graphic novels sold by BookScan reporters in 2021 were from just 20 books.
Children’s books have mostly taken over the top of the charts. Forty-four of the top 50 are aimed at an under-18 audience. Fifty-one of the top 100. Looking solely at non-Manga material, there are only three books in the Top 100 that aren’t aimed squarely at kids – Lore Olympus (in SC and HC), and They Called Us Enemy.
Clearly, Dav Pilkey and his Dog Man series are the current Rulers of comic sales in the bookstores – he is the Top Five, inclusive, and eight of the Top 20. What’s critical to remember about this is that Scholastic is also presumably selling a metric shedload of these books through the Scholastic Book Fairs, to elementary and middle school libraries, and any number of other places that don’t report to NPD BookScan [Editor’s note: although we don’t know how many of these were held in Year Two of Pandemic Schooling.] This continues to be probably just the tip of the iceberg.
Pilkey’s hold on the charts is strong: he takes six of the Top 10 and eight of the top 20). The #1 best-seller (“Dog Man v10: Mothering Heights”) sells a staggering 1.3 million copies to actual readers. That’s an incredible amount of copies.
At #2, Pilkey places the first volume of his meditation of creativity and just encouraging kids to make art (no greater goal, I think!), Cat Kid, which sells more than 600k copies. Then we have a little back and forth, with #3 being Dog Man v9 (560k), #4 being Cat Kid v2 (424k), and #5 being Dog Man v7 (332k). Then Pilkey falls back a little, with his next placement #7 with Dog Man v8 (291k), then #15 Dog Man v6 (161k), and #17 with the first volume, Dog Man v1 still selling 155k six years after its first publication.
Pilkey’s success is clearly not just a trend or a fluke – it is growing and long lasting, and shows no signs of abating. Each and every one of Pilkey’s comics place in the Top 750, and these 22 editions (including thing like various boxed set collections) sell an eye-popping 5.2 million copies combined in 2021 – up from “only” 3.8 mil in 2020 – which, just to underline how big of a deal Dav Pilkey is, he was just over ten percent of all comics sold in 2021 through NPD BookScan, within the largest year comics have ever seen in our history of tracking! There are voices that want to minimize the significance of the commerciality of Pilkey’s art. Those voices are stupid; don’t listen to them.
But the Top 20 is not only Dav Pilkey! What breaks his hold on the market? Why, it is a graphic novel based on Ann M. Martin’s The Baby-Sitters Club! The ninth entry, Claudia and the New Girl, now illustrated by Gabriela Epstein, places as the #6 best-selling comic, with 313k copies sold. Epstein is the third creator to do a The Baby-Sitters Club GN, and for it to launch stronger than ever is surely a good omen for Scholastic. Especially when Chan Chau’s tenth entry in the series,“Kristy and the Snobs places #12 (172k), while at #20, v8, Gale Galligan’s last, Logan Likes Mary Anne! sells 150k – this suggests that the series itself is what’s selling books, and not just the creators. The sage among us will remember that Comics Powerhouse Raina Telgemeier originally launched the series with the first four volumes, but there’s vast life beyond Raina.
Scholastic isn’t done with the Top 20 yet – at #8 is a Five Nights at Freddy’s book, v2, The Twisted Ones selling 250k copies. #9 is the fourth volume of Wings of Fire: The Dark Secret selling 214k, while #10 goes back to FNAF with v1 The Silver Eyes” at 211k.
The aforementioned Raina Telgemeier’s got a single Top 20 appearance this year: Guts comes in at #11 with 189k. All together, Scholastic takes fifteen of the Top 20 best-sellers in 2021. A remarkable result. Just for the math inclined among us, those fifteen books represent 5.3 million copies sold, or a bit over ten percent of the total of every single book of comics combined sold for the year. The best-seller drives the fortunes of publishing more than almost anything else.
The first place Scholastic’s hold on the Top 20 is broken is #13 with the first volume of Attack on Titan by Hajime Isayama, with almost 170k sold. This is our first piece of manga as well, which absolutely exploded in 2021. For example, last year’s manga best seller (the next book below!) sold 136k copies – that’s a year over-year increase of 25% right on the top! Also, I think, worthy of mention is that year’s top manga seller goes to Kodansha, and not the category winner, Viz.
Viz comes along seconds later, however, with #14 and v1 of My Hero Academia by Kohei Horikoshi, which racks 163k. This is followed at #16 by Demon Slayer: Kimetsu No Yaiba v1 by Koyoharu Gotouge with 158k sold.
#18 comes from a YouTuber, FGTeev Saves The World!, which is their second volume. It shifts 154k copies. HarperCollins publishes this, and the official credit on the cover is “illustrated by Miguel Diaz Rivas.”
Finally for this survey of the Top 20 of 2021 is #19 is v1 of Chainsaw Man by Tatsuki Fujimoto which sells over 150k. This is the place where I will observe that last year’s #20 was 129k – the floor rose 16%! Speaking of the bottom, in last year’s report, I was exultant that there were two not-Top 20 books with over 100k copies sold – well in 2021 there are an astonishing thirty-two not-Top 20 books that sold over 100k copies.
I want to really underline the fact that not one of these books was created “for” the traditional Direct Market audience, and that the DM (as purchased through Diamond at least) does a mediocre job stocking or selling any of these books – Now, to be fair, many DM stores are buying these books from non-Diamond sources (because Diamond uniformly has the worst wholesale pricing for each and every book in the Top 20), but clearly the model has seismically shifted.
How about if we sort things by author? There are 9989 different names on the entire NPD BookScan list for 2021. Here are people who sold more than 100k copies combined:
| 5,245,871 | PILKEY, DAV |
| 1,808,798 | HORIKOSHI, KOHEI |
| 1,586,009 | GOTOUGE, KOYOHARU |
| 1,320,674 | ISAYAMA, HAJIME |
| 1,038,420 | TELGEMEIER, RAINA |
| 928,326 | AKUTAMI, GEGE |
| 690,627 | SUTHERLAND, TUI T. |
| 656,037 | FUJIMOTO, TATSUKI |
| 623,807 | ITO, JUNJI |
| 620,160 | AIDAIRO |
| 603,276 | SHIRAI, KAIU |
| 532,174 | FURUDATE, HARUICHI |
| 496,068 | ISHIDA, SUI |
| 479,448 | CAWTHON, SCOTT |
| 469,543 | MIURA, KENTARO |
| 455,806 | ARAKI, HIROHIKO |
| 455,601 | ONE |
| 409,992 | TORIYAMA, AKIRA |
| 397,918 | FARINA, KATY |
| 381,164 | OHKUBO, ATSUSHI |
| 377,772 | ODA, EIICHIRO |
| 368,051 | ODA, TOMOHITO |
| 325,540 | YANG, GENE LUEN |
| 323,596 | GALLIGAN, GALE |
| 320,294 | PEIRCE, LINCOLN |
| 317,031 | KISHIMOTO, MASASHI |
| 315,893 | EPSTEIN, GABRIELA |
| 278,770 | FGTEEV |
| 274,606 | BRALLIER, MAX |
| 268,923 | MASHIMA, HIRO |
| 263,268 | TOGASHI, YOSHIHIRO |
| 253,576 | OHBA, TSUGUMI |
| 251,320 | HIMEKAWA, AKIRA |
| 246,554 | GREEN, JOHN PATRICK |
| 245,619 | KIRKMAN, ROBERT |
| 244,086 | CRAFT, JERRY |
| 243,668 | SIMPSON, DANA |
| 226,250 | HALE, SHANNON |
| 225,458 | ITAGAKI, PARU |
| 220,340 | ENDO, TATSUYA |
| 210,345 | CLANTON, BEN |
| 207,612 | FUJITA |
| 207,059 | TARSHIS, LAUREN |
| 205,791 | KUSAKA, HIDENORI |
| 204,620 | TABATA, YUKI |
| 204,295 | KIBUISHI, KAZU |
| 198,091 | LIBENSON, TERRI |
| 191,491 | MATSUI, YUSEI |
| 190,326 | MILLER, KAYLA |
| 187,372 | YUKIMURA, MAKOTO |
| 186,624 | HERO |
| 183,926 | TOBOSO, YANA |
| 183,621 | HARUBA, NEGI |
| 182,764 | TAKAYA, NATSUKI |
| 177,337 | OIMA, YOSHITOKI |
| 176,173 | CHAU, CHAN |
| 175,476 | NANASHI |
| 171,726 | HALE, NATHAN |
| 166,993 | SMYTHE, RACHEL |
| 166,735 | OONO, KOUSUKE |
| 164,185 | ARAKAWA, HIROMU |
| 158,373 | FURUHASHI, HIDEYUKI |
| 157,991 | MIYAJIMA, REIJI |
| 151,664 | GAIMAN, NEIL |
| 149,832 | SNYDER, SCOTT |
| 148,281 | TAKEUCHI, NAOKO |
| 145,672 | JAMIESON, VICTORIA |
| 143,776 | WATTERSON, BILL |
| 143,503 | FUSE |
| 141,746 | INAGAKI, RIICHIRO |
| 139,885 | KIZU, NATSUKI |
| 138,931 | CHUNSOFT, SPIKE |
| 133,388 | KODACHI, UKYO |
| 125,550 | MOORE, ALAN |
| 125,314 | OSHIMI, SHUZO |
| 125,226 | CHUGONG |
| 123,459 | GARCIA, KAMI |
| 122,482 | HAYASHIDA, Q. |
| 118,112 | CARIELLO, SERGIO |
| 117,439 | ADACHITOKA |
| 116,659 | KAKU, YUJI |
| 115,362 | ASAGIRI, KAFKA |
| 111,595 | SUZUKI, NAKABA |
| 110,659 | ASANO, INIO |
| 110,546 | MCELROY, CLINT |
| 107,401 | HOLM, JENNIFER L. |
| 106,691 | SAKISAKA, IO |
| 105,870 | VARIOUS |
| 104,959 | INOUE, TAKEHIKO |
| 104,621 | YAMADA, KINTETSU |
| 103,867 | LEWIS, JOHN |
| 102,758 | TOBIN, PAUL |
| 101,497 | HINODEYA, SANKICHI |
| 100,570 | ARII, MEMECO |
| 100,564 | YAMAGUCHI, TSUBASA |
These ninety-five people represent 64% of all sales of NPD BookScan-reported sales in 2021. This is a vast broadening of the talent pool – in 2020 it was only 51 people, who represented 61% of sales.
What you can take from this is that only a tiny number of creators drive the majority of the business in comics (and books in general, as far as I can tell); and conversely, this probably means that the numerical majority of comics aren’t actually significantly profitable any given year.
THE PUBLISHERS
Let’s now switch our attention to looking how publishers performed.
As a way to make the publisher breakdowns more readable, I split the chart into “eastern” (Manga) and “western” comics, because I think there are a few clear market distinctions between those categories. So, without further ado:
2021 Manga Sales
Overall sales are up incredibly for the manga category in 2021 – sales nearly tripled in pieces within the Top 750, and rose 280% in calculated dollars. That’s insane.
Here’s a year-to-year comparison chart for manga in the Top 750:
| Year | # of placing titles | Unit sales | Calculated Retail Value |
| 2003 | 447 | 3,361,966 | $34,368,409 |
| 2004 | 518 | 4,603,558 | $45,069,684 |
| 2005 | 594 | 5,691,425 | $53,922,514 |
| 2006 | 575 | 6,705,624 | $61,097,050 |
| 2007 | 575 | 6,837,355 | $61,927,238 |
| 2008 | 514 | 5,624,101 | $53,033,579 |
| 2009 | 451 | 4,414,705 | $41,068,604 |
| 2010 | 436 | 3,117,019 | $30,212,561 |
| 2011 | 392 | 2,627,570 | $27,017,081 |
| 2012 | 367 | 1,908,186 | $21,324,368 |
| 2013 | 315 | 1,665,487 | $21,256,777 |
| 2014 | 271 | 1,748,185 | $22,601,720 |
| 2015* | 279 | 2,033,534 | $26,191,474 |
| 2016* | 311 | 2,629,366 | $35,915,488 |
| 2017 | 284 | 2,427,380 | $35,433,489 |
| 2018 | 299 | 2,641,158 | $35,955,537 |
| 2019 | 332 | 3,539,031 | $49,900,429 |
| 2020 | 358 | 5,419,328 | $77,703,520 |
| 2021 | 495 | 15,945,960 | $218,310,280 |
All three indicators are up for the category in 2021, and this year would be the clearly best year for manga in terms of both units sold and calculated dollars since we’ve been able to track these things! Be clear, however, that calculated dollars is a pretty fictional measurement because no one anywhere knows how much any individual book is actually selling for. Interestingly, this powerful year-over-year growth was achieved despite a “North American Manga Shortage” that began as a result of COVID lockdowns, as well as massive paper shortages – and all indications are that this will continue to be the case through most of 2022.
It might also be worth observing that despite the record setting unit sales (seriously: the sales in 2021 are greater than the four years of 2017-2020 combined!) it is still NOT greatest number of titles placing – that was the 594 books back in 2005.
As is typical with manga, this is driven by the near-exclusive domination of popular series – when there’s not a strong anime driving sales, manga tankobon series start to perform more like periodicals than books (albeit over a wider horizon); rather than generally building a strong core backlist that sells forever, year-in-and-year out, manga tends instead to ebb and flow with culture and fashion (and especially what anime is airing currently!) – manga sales are broadly not about specific graphic novels, they’re all about the series.
While there are 496 individual volumes of manga placing in the Top 750 this year, those only represent 119 distinct properties. For example, the best-selling manga this year is Attack on Titan – there are 31 one different entries for this series (and it’s spinoffs Before the Fall and No Regrets) that place in the Top 750 – more than 6% of the manga best-sellers are a volume of Attack on Titan.
The #2 series is just the same: My Hero Academia has 39 entries. #3 is Demon Slayer: Kimetso No Yaiba, which has 24 entries, #4 is Chainsaw Man with eight, and #5 is Toilet-Bound Hanuko-Kun with 11 – those five series alone represent almost 23% of the best-selling placing manga series, and only leave space in the Top 20 for two additional series: Jujutsu Kaiden and Death Note.
Manga, as a category, has a “long tail”, where we’re looking at all sales for the year, and not just within the Top 750:
| Year | # of listed items | Percent Change | Total Unit Sold | Percent Change | Calculated Retail Value | Percent Change | Av. Sale per title | Av $ per title |
| 2007 | 6231 | —— | 11,323,487 | —— | $108,770,537 | —– | 1817 | $17,456 |
| 2008 | 7842 | 20.54% | 10,173,091 | -11.31% | $100,800,283 | -7.91% | 1297 | $12,854 |
| 2009 | 8756 | 11.66% | 8,148,490 | -19.90% | $81,770,442 | -18.78% | 931 | $9,339 |
| 2010 | 8764 | —— | 6,239,725 | -23.42% | $67,092,668 | -17.95% | 712 | $7,655 |
| 2011 | 8991 | 2.59% | 5,690,327 | -8.80% | $62,810,728 | -6.38% | 633 | $6,986 |
| 2012 | 6332 | -29.57% | 3,510,057 | -38.32% | $40,943,613 | -34.81% | 554 | $6,466 |
| 2013 | 7024 | 10.93% | 3,516,208 | 0.01% | $44,651,823 | 9.06% | 501 | $6,357 |
| 2014 | 7452 | 6.09% | 3,914,385 | 11.32% | $51,557,925 | 15.47% | 525 | $6,919 |
| 2015* | 4412 | -40.79% | 4,580,434 | 17.02% | $62,253,624 | 20.75% | 1038 | $14,110 |
| 2016* | 4968 | 12.60% | 5,821,892 | 27.10% | $81,314,479 | 30.62% | 1172 | $16,368 |
| 2017 | 10,248 | 106.8% | 5,865,412 | 0.75% | $85,581,224 | 5.25% | 572 | $8,351 |
| 2018 | 10,839 | 5.77% | 6,100,260 | 4.00% | $87,421,299 | 2.15% | 563 | $8,065 |
| 2019 | 9928 | -8.40% | 7,461,077 | 22.31% | $110,577,066 | 26.49% | 752 | $11,138 |
| 2020 | 12,423 | 25.13% | 10,766,492 | 44.30% | $161,611,294 | 46.15% | 867 | $13,009 |
| 2021 | 13,006 | 4.69% | 27,717,479 | 157.44% | $396,260,629 | 145.19% | 2131 | $30,468 |
Fantastic general “Long-Tail” growth in the category overall – number of books available hits a new record at over 13k items, while both units sold and calculated dollars are staggeringly up into the 150% growth range. This is a lot of books sold!
When you start breaking down the manga portion of the chart by publisher, there’s really not any contest at all: there’s a two-ton gorilla, and then a bunch of smaller houses struggling in their shadow. This chart represents all 13,006 books that are “manga” in NPD BookScan in 2021, and represents “the long tail” of the charts:
Viz, very obviously, is the dominant player, selling 57% of all manga sold in 2021. This is actually down from 63% last year, but it’s still an enormous percentage.
If we look solely within the Top 750, the picture is very similar: The #1 publisher is Viz who takes 308 of the 495 manga spots in the Top 750, keeping them as the overwhelmingly dominant player with 62% of the placing titles! Within the Top 750, Viz (and their Yaoi sub-imprint Sublime) charted about 10.8 million pieces, for more than $134.5 million of calculated retail dollars – this is yet another year of strong growth for Viz, up roughly 152% from the previous year in pieces placed!
Viz controls the manga charts as they have for a very long time now. It is nearly impossible envisioning anyone really challenging them substantially for that role because they are more than three times larger than their nearest competitor in their segment
Viz’s #1 Best-seller is My Hero Academia V1 shifts nearly 163k copies, with five volumes in Viz’s Top 10. All 29 volumes of the main series chart within the Top 750, and nothing from that main series sells under 19k (volumes 13-15 are the lowest part of the “hammock”). MHA has several spinoff series, as well: Smash, which places one of its five entries in the Top 750 (v1 at 14k), Team-Up Missions, which just has a single volume, selling 44.6k, and Vigilantes which has seven of its eleven entries in the Top 750 – v1 sells 27k. All told, all volumes of MHA combined to sell just over two million copies, up huge from 1.2m last year.
(The “Hammock Principle”, briefly stated, is books in a series generally sell in a sales pattern that looks like a hammock if you chart it out: the first few volumes and the last few volumes sell the best, with the ends running down into the middle volumes which have the lowest sales, like the sagging part of a hammock. The problem with this is that stores don’t have infinite rack space, and publishers need a certain volume and velocity to keep things in print, so that sagging middle becomes unsustainable for most series over time, and many stores start to only carry the first and last few volumes. This is less of a problem for a major hit like MHA, but the gap between v1 at 163k and v19 at 19k is pretty vast, and when you get down to not much over 8k for the lowest selling issues of Vigilantes certainly a lot of venues are not going to carry that spin-off)
Demon Slayer: Kimetsu No Yaiba continues to be Viz’s second most popular property in 2021, with two volumes placing in their top ten (v1 shifts 158k, while v2 sells nearly 130k), and all 23 volumes (and the box set – 31k copies sold!) place in the manga top 750. Combined this property shifts 1.6 million units – up from 557k units in 2020.
Chainsaw Man is Viz’s third best-seller, where v1 does just over 150k. All eight volumes place in the Top 750, for combined sales of 623k. V1 only sold 18k copies in 2020, so that’s a real explosion in popularity.
Jujutsu Kaisen is the last title placing in Viz’s Top Ten, with v1 shifting 143k copies, and fourteen volumes in the Top 750 for a combined 928k.
Other strong series for Viz outside of their Top Ten include Death Note with v1 of the Black edition selling 91k, Uzumaki by Junji Ito – who is more or less the only Viz creator selling significantly as stand-alone graphic novels – 87k, compared to 62k last year – while with over 50k copies sold each Ito also scores with Tomie, Smashed, Remina, and Sensor), Tokyo Ghoul (v1 shifts 85k), Haikyu!! (v1 selling nearly 79k), The Promised Neverland (v1 is almost 77k), Komi Can’t Communicate (68k for v1), Hunter X Hunter (65k for v1), Spy X Family (v1 is 59k), The Way of the Househusband (58k for v1), Assassination Classroom (56k for v1), One Punch Man (53k for v1), and Black Clover which comes in fifty copies under 50k. Both the depth and the breadth of Viz’s best-sellers in unprecedented. Last year I was writing about series that had just crossed 25k!
For Viz’s Yaoi imprint, Sublime, the best-seller (and the only series to crack the Top 750) is Given, where v1 shifts almost 35k.
Let’s take a look at the “long tail” of Viz? This is their sales of all products sold for the entire year, whether or not it made the Top 750
| Year | # of listed items | Percent Change | Total Unit Sold | Percent Change | Calculated Retail Value | Percent Change | Av. Sale per title | Av $ per title |
| 2007 | 2018 | —— | 6,249,324 | —— | $55,123,347 | —– | 3097 | $27,316 |
| 2008 | 2447 | 21.26% | 5,536,286 | -11.41% | $50,311,791 | -8.97% | 2263 | $20,561 |
| 2009 | 2793 | 14.14% | 4,819,407 | -12.95% | $44,310,790 | -11.93% | 1726 | $15,865 |
| 2010 | 3088 | 10.56% | 3,576,671 | -25.79% | $35,041,305 | -20.92% | 1158 | $11,348 |
| 2011 | 3393 | 9.88% | 3,276,297 | -8.40% | $32,766,960 | -6.49% | 966 | $9,657 |
| 2012 | 3518 | 3.68% | 2,099,560 | -35.92% | $22,433,721 | -31.54% | 597 | $6,377 |
| 2013 | 3636 | 3.35% | 1,853,211 | -11.73% | $21,586,923 | -3.77% | 510 | $5,937 |
| 2014 | 3765 | 3.55% | 1,855,161 | 0.11% | $22,732,074 | 5.30% | 493 | $6,038 |
| 2015* | 2264 | -39.87% | 2,150,656 | 15.93% | $28,134,971 | 23.77% | 950 | $12,427 |
| 2016* | 2405 | 6.23% | 2,811,978 | 30.75% | $38,854,681 | 38.10% | 1169 | $16,156 |
| 2017 | 4443 | 84.74% | 2,958,351 | 5.21% | $41,594,729 | 7.80% | 666 | $9,362 |
| 2018 | 4637 | 4.37% | 3,184,274 | 7.64% | $44,423,434 | 6.80% | 687 | $9,580 |
| 2019 | 4702 | 1.40% | 4,329,369 | 35.96% | $60,817,993 | 36.91% | 921 | $12,934 |
| 2020 | 4856 | 3.28% | 6,614,179 | 52.77% | $94,768,000 | 55.82% | 1362 | $19,516 |
| 2021 | 5183 | 6.73% | 15,804,613 | 138.95% | $208,440,832 | 119.95% | 3049 | $40,216 |
Viz is in a truly fantastic place by their long-tail – They added about 7% to the number of SKUs they sell, yet they’re up significantly more than double in pieces and dollars, and had the single biggest year of both circulation and dollars that we’ve ever tracked for them – basically bigger than the previous three years combined. That’s simply incredible business! Viz in 2021 has 10 books over 100k, 55 more over 50k, another 57 over 30k, an additional 64 over 20k, and a staggering 122 others over 10k. They are a very, very, very strong publisher, in short, and they completely blow past the scales we’ve invented to describe other publishers.
In a steady second place among manga publishers, we have Kodansha Comics, which places 110 titles within the top 750, with almost 3 million in units sold (compared to 451k in sales in 2020), and $40.6 million in calculated retail dollars ($5.9m in 2020). Kodansha growth in the Top 750 in 2021 (more than six-fold) is significantly higher than either their main competitor of Viz, or the category of manga as a whole.
Kodansha’s licenses formerly were both the original backbone of Tokyopop, as well as being the majority of Del Rey Manga. Kodansha pulled Tpop’s license in March of ’09 and Del Rey in October of ’10. You may want to look at those publisher’s listings below to get a better historical overview.
To show that I’m learning new things every year, last year I found out (from librarian Matthew Murray!) that Kodansaha actually purchased Vertical in 2011, and fully merged with them in 2020.
Kodansha’s current #1 best-seller, and now the best-seller for Manga in general, is Attack on Titan, with v1 shifting nearly 170k units in 2021 – this was only 32k in 2020, so that’s crazy growth, especially for a book first released in 2012. Attack on Titan takes nine of the 10 top spots for Kodansha, and within the Top 750, volumes 1 through v12, and v22 through v34 all place (v13 through v21 represent “the hammock”). There’s also the first omnibus (16k), two boxed sets (30k and 13k), and the spinoffs: two volumes of No Regrets (28k and 23k), and v1 of Before the Fall (20k). All told there are thirty-one volumes of AoT in the top 750, selling a combined 1.2 million copies.
Also within the Top Ten for Kodansha is the first volume of Wotakoi: Love is Hard for Otaku which sells an impressive 74k copies, up massively from 13k in 2020.
Kodansha has a couple of other hits that are not in their Top Ten: Fire Force, where v1 sells 51k (20k the previous year), and Vinland Saga where v1 sells a bit over 50k.
The best-seller of the Vertical imprint is Don’t Toy With Me, Miss Nagatoro, where v1 sells 36k
These Long Tail figures are for Kodansha-published titles, and they reflect that Kodansha itself first started publishing in 2010. I have adjusted the figures from 2011 on to now include Vertical as well – but we’re pretty much going to throw out the 2007-2010 Vertical figures because they’re not really large enough to be significant:
| Year | # of listed items | Percent Change | Total Unit Sold | Percent Change | Calculated Retail Value | Percent Change | Av. Sale per title | Av $ per title |
| 2010 | 9 | —— | 13,291 | —— | $322,717 | —— | 1477 | $35,857 |
| 2011 | 192 | 2033.33% | 246,083 | 1751.50% | $3,236,474 | 902.88% | 1282 | $16,857 |
| 2012 | 364 | 89.58% | 369,853 | 50.30% | $4,697,856 | 45.52% | 1016 | $12,906 |
| 2013 | 479 | 31.59% | 563,460 | 52.35% | $7,427,739 | 58.11% | 1176 | $15,507 |
| 2014 | 629 | 31.32% | 904,610 | 60.55% | $11,972,992 | 61.19% | 1438 | $19,035 |
| 2015* | 617 | -1.91% | 965,519 | 6.73% | $12,894,698 | 7.70% | 1565 | $20,899 |
| 2016* | 772 | 25.12% | 1,154,178 | 19.54% | $15,527,849 | 20.42% | 1495 | $20,114 |
| 2017 | 1164 | 50.78% | 1,098,812 | -4.80% | $16,795,188 | 8.16% | 944 | $14,429 |
| 2018 | 1399 | 20.19% | 1,033,780 | -5.92% | $15,396,607 | -8.33% | 739 | $11,005 |
| 2019 | 1564 | 11.79% | 1,152,720 | 11.51% | $18,674,181 | 21.29% | 737 | $11,940 |
| 2020 | 1740 | 11.25% | 1,548,349 | 34.32% | $24,524,651 | 31.33% | 890 | $14,095 |
| 2021 | 1975 | 13.51% | 5,655,992 | 265.29% | $84,299,372 | 243.73% | 2864 | $42,683 |
In 2021, Kodansha has one book selling over 100k, twelve more over 50k, another dozen over 30k, thirty-one more over 20k, and ninety-three more titles that sell over 10k – this is a wildly healthy performance, coming close to tripling their number of units they sold this year; that’s faster growth than Viz’s giant performance!
The #3 publisher of Manga in the Top 750 in 2021 continues to be Yen Press, which places 38 titles, for about 1.3 million copies sold (up insanely from 267k copies sold the previous year), and nearly $19.2 million of calculated retail gross (up from $3.9 million retail gross the previous year). Yen is a division of Hachette (more on them later).
Yen’s major hit is Toilet-Bound Hanako-Kun, which takes five of their ten best-selling spots. V1 (their #1 best-seller) sells an impressive 147k copies in 2021 – up from 48k the previous year, while v2 (#2) pulls in 83k, v3 (#3) racks up 62k. They also place v5 (#6 and 51k) while v6 sells about 45k copies at position #8.
Yen’s Top Ten is fleshed out by (#4) Solo Leveling where v1 sells almost 62k, #5 is v1 of Black Butler selling 52k, #7 is v1 of Horimiya (48k), #9 is v1 of Fruits Basket (44k), and #10 is Bungo Stray Dogs where v1 sells almost 43k.
In the Long Tail, Yen sales nearly triple this year!
| Year | # of listed items | Percent Change | Total Unit Sold | Percent Change | Calculated Retail Value | Percent Change | Av. Sale per title | Av $ per title |
| 2007 | 10 | —— | 12,896 | —— | $147,449 | —– | 1,290 | $14,745 |
| 2008 | 90 | 800.00% | 110,126 | 753.95% | $1,237,860 | 739.52% | 1,224 | $13,754 |
| 2009 | 211 | 134.44% | 330,962 | 200.53% | $3,697,113 | 198.67% | 1,569 | $17,522 |
| 2010 | 344 | 63.03% | 560,983 | 69.50% | $6,650,871 | 79.89% | 1,680 | $19,334 |
| 2011 | 460 | 33.72% | 764,125 | 36.21% | $9,953,966 | 49.66% | 1,661 | $21,639 |
| 2012 | 548 | 19.13% | 647,948 | -15.20% | $8,735,264 | -12.24% | 1,182 | $15,940 |
| 2013 | 654 | 19.34% | 692,380 | 6.86% | $9,715,421 | 11.22% | 1,059 | $14,855 |
| 2014 | 776 | 18.65% | 682,135 | -1.48% | $9,985,502 | 2.78% | 776 | $12,868 |
| 2015* | 649 | -16.37% | 917,620 | 34.52% | $13,248,445 | 32.68% | 1414 | $20,414 |
| 2016* | 793 | 22.19% | 1,072,008 | 16.82% | $15,520,207 | 17.15% | 1352 | $19,572 |
| 2017 | 1403 | 76.92% | 928,962 | -13.34% | $13,866,675 | -10.65% | 662 | $9,884 |
| 2018 | 1737 | 23.81% | 890,228 | -4.17% | $13,051,751 | -5.88% | 513 | $7,514 |
| 2019 | 1846 | 6.28% | 884,596 | -0.63% | $13,008,175 | -0.33% | 479 | $7,047 |
| 2020 | 2010 | 8.88% | 1,090,002 | 23.22% | $15,797,758 | 21.44% | 542 | $7,860 |
| 2021 | 2147 | 6.82% | 3,018,454 | 176.92% | $43,696,021 | 176.60% | 1406 | $20,352 |
Yen Press in 2021 has one book over 100k, five titles over 50k, thirteen more over 30k, another five selling over 20k copies, and twenty more that place over 10k. Like all Manga, this is a great performance.
The #4 manga publisher in the Top 750 in 2021 remains Dark Horse. They place 25 titles in the Top 750, whose combined sales represent 596k copies sold (up huge from 206k in 2020) and almost $19m in calculated retail value (up from $7.2m)
The best-selling DH series continues to be Berserk with the $50 hardcover editions outselling the softcovers. The HC of v1 (#1 for Dark Horse) racked up 57k sold, which is impressive at a $50 base price – this is up from 33k last year. V2 (#2) sells nearly 38k, while the new v7 (#4) does 32k. v4 (#7) and v3 (#8) each sell around 27k, while at #10 is v8 with 26k sold. But it doesn’t end there, because the cheaper paperback of v1 (shorter page count to the HC) is Dark Horse’s #3 best-seller with almost another 39k sold.
Other than Berserk, Dark Horse does well with Mob Psycho 100 where v1 (#5) sells almost 32k – it was only about 11k last year! The rest of the Top Ten is filled by Danganronpa, with the long-titled Danganronpa 2: Ultimate Luck and Hope and Despair v1 (#6) selling almost 29k, while Danganronpa: The Animation v1 (#9) sells about 26k
Looking at the Long Tail, this is what Dark Horse’s (manga only!) recent performance looks like – like all manga in 2021, it’s up big! There is much more on Dark Horse down below in the “Western Publishers” section.
| Year | # of listed items | Percent Change | Total Unit Sold | Percent Change | Calculated Retail Value | Percent Change | Av. Sale per title | Av $ per title |
| 2007 | 341 | —— | 249,943 | —— | $3,329,464 | —– | 733 | $14,745 |
| 2008 | 420 | 23.17% | 248,981 | -0.38% | $3,176,870 | -4.58% | 593 | $7,564 |
| 2009 | 455 | 8.33% | 226,497 | -9.03% | $2,915,693 | -8.22% | 498 | $6,408 |
| 2010 | 473 | 3.96% | 194,494 | -14.13% | $2,633,077 | -9.69% | 411 | $5,567 |
| 2011 | 497 | 5.07% | 189,329 | -2.66% | $2,602,230 | -1.17% | 381 | $5,236 |
| 2012 | 493 | -0.80% | 112,373 | -40.65% | $1,631,038 | -37.32% | 228 | $3,308 |
| 2013 | 521 | 5.68% | 103,538 | -7.86% | $1,678,563 | 2.91% | 199 | $3,222 |
| 2014 | 559 | 7.29% | 100,894 | -2.60% | $1,617,251 | -3.65% | 180 | $2,893 |
| 2015* | 303 | -45.80% | 135,444 | 34.24% | $2,238,167 | 38.39% | 447 | $7,387 |
| 2016* | 225 | -25.74% | 174,298 | 28.69% | $2,291,355 | 2.38% | 775 | $10,184 |
| 2017 | 527 | 234.22% | 238,089 | 36.60% | $3,795,506 | 65.64% | 452 | $7,202 |
| 2018 | 531 | 0.76% | 224,010 | -5.91% | $3,579,135 | -5.70% | 422 | $6,740 |
| 2019 | 384 | -27.68% | 329,034 | 46.88% | $7,280,058 | 103.40% | 857 | $18,958 |
| 2020 | 472 | 22.92 | 430,762 | 30.92% | $11,111,354 | 52.63% | 913 | $23,541 |
| 2021 | 431 | -8.69% | 1,009,527 | 134.36% | $26,954,363 | 142.58% | 2342 | $62,539 |
Dark Horse Manga has one book over 50k, four more over 30k, another nine over 20k, and eleven more books over 10k. Having that kind of increase in sales while the number of SKUs drop is the best performance one could hope for.
Holding on to the #5 manga publisher as represented by the NPD BookScan Top 750 is Seven Seas, which places eight titles for almost 174k copies sold combined. This is, like all manga, up big from 54k the previous year. 2021’s calculated value comes out just over $3 million.
Seven Seas also includes Ghost Ship, though that imprint doesn’t place anything in the Top 750 this year.

Seven Seas’ biggest success in 2021, as it has been for several years, was I Want To Eat Your Pancreas. Like most Manga in 2021, this explodes, selling nearly 55k (up from just 11k in 2020). Coming it at #2 for Seven Seas is the first volume of Orange (33k sold), while #3 is The Ancient Magus’ Bride with v1 selling 16k. At #4 is Dai Dark v1 (a bit under 16k), #5 is High-Rise Invasion with v1 selling almost 15k, #6 is Orange v2 (13k), while selling just a handful of copies fewer is Miss Kobayashi’s Dragon Maid v1 (#7) and Bloom Into You v1 (#8)
Seven Seas’ Long Tail shows their “best year ever”, with growth holding rough pace with all of their Manga peers
| Year | # of listed items | Percent Change | Total Unit Sold | Percent Change | Calculated Retail Value | Percent Change | Av. Sale per title | Av $ per title |
| 2007 | 54 | —— | 50,641 | —— | $558,450 | —– | 938 | $10,342 |
| 2008 | 76 | 41.74% | 80,112 | 58.20% | $833,667 | 49.28% | 1054 | $10,969 |
| 2009 | 97 | 27.63% | 74,967 | -6.42% | $807,666 | -3.12% | 773 | $8.326 |
| 2010 | 93 | -4.12% | 75,764 | 1.06% | $875,612 | 8.41% | 815 | $9,415 |
| 2011 | 118 | 26.88% | 116,360 | 53.58% | $1,426,618 | 62.93% | 986 | $12,090 |
| 2012 | 151 | 27.97% | 124,262 | 6.79% | $1,684,994 | 18.11% | 823 | $11,159 |
| 2013 | 223 | 47.68% | 204,419 | 64.51% | $2,942,608 | 74.64% | 917 | $13,196 |
| 2014 | 300 | 34.53% | 284,484 | 39.17% | $3,979,338 | 35.23% | 948 | $13,264 |
| 2015* | 304 | 1.34% | 374,715 | 31.72% | $5,177,568 | 30.11% | 1233 | $17,031 |
| 2016* | 417 | 37.17% | 491,947 | 31.29% | $6,960,634 | 34.44% | 1180 | $16,692 |
| 2017 | 554 | 32.85% | 478,336 | -2.77% | $6,801,527 | -2.29% | 863 | $12,277 |
| 2018 | 906 | 63.54% | 667,556 | 39.56% | $9,511,591 | 39.84% | 737 | $10,498 |
| 2019 | 1049 | 15.78% | 671,362 | 0.57% | $9,498,329 | -0.14% | 640 | $9,055 |
| 2020 | 1230 | 17.25% | 699,127 | 4.14% | $9,913,480 | 4.37% | 568 | $8,060 |
| 2021 | 1518 | 23.41% | 1,590,317 | 127.47% | $22,972,596 | 131.73% | 1048 | $15,133 |
Seven Seas has the one title that sells over 50k this year, one over 30k, and six more over 10k.
Finally for the Manga category in the Top 750 in 2021, we have, at #7 placement, relatively new imprint Square Enix – they launched in late 2019. This year within the Top 750, they place six titles that combine for 112k sold, and almost $2 million in calculated dollars.
Square Enix’s best seller is Soul Eater, where v1 sold almost 32k, v2 sells 17k, and v3 brings in 14k. They also do well with A Man and His Cat (23k), My Dress-Up Darling (14k) and I Think Our Son is Gay (12k)
Because this is the first time they’ve placed books over 10k sold, and is their second year directly printing books under this imprint’s name, this will be the first time that I’ll be building a Long Tail for them, which looks like this:
| Year | # of listed items | Percent Change | Total Unit Sold | Percent Change | Calculated Retail Value | Percent Change | Av. Sale per title | Av $ per title |
| 2020 | 20 | ——– | 49,251 | ——- | $703,806 | ——- | 568 | $8,060 |
| 2021 | 50 | 150% | 294,520 | 498.00% | $4,298,970 | 510.82% | 5890 | $85,979 |
Square Enix has one book over 30k, another over 20k, and four more over 10k. I expect this to change significantly over the next few years.
2021 Western Publishers
When I say “Western” here, I mean publishers/work from Europe and America, as opposed to Asia, not publishers of the genre of “western” comics!
NPD BookScan itself does not try to control how data gets initially logged (or changed), leaving that all to publishers. I think that I understand this reasoning: the publisher is the customer, and they should have some level of control over how they are represented, but as a person who tries to decipher the data each year, I know that I would prefer some sort of internally-consistent (and externally-partitionable!) method of categorizing titles that doesn’t seem to change in some fashion from year-to-year – books will appear and disappear, almost seemingly willy-nilly, and it makes showing you anything even resembling consistent data staggeringly difficult. All of this is a function of how publishers assign BISACs and in what order – please, please read the long section below on how the sausage is made!
I’d also like to continue to give you a top-level reminder that back in 2008 there was some sort of behind-the-scenes recategorization in what got sent to me – I now know this was probably a change in BISAC codes – and most of the “cartoon-strip humor” books like Calvin & Hobbes and The Far Side suddenly disappeared, so there’s kind of a not-strictly apples thing going on with the pre-2008 numbers here. Do keep that in mind when making comparisons both in the Top 750 chart, as well as the Long Tail.
Another observation I have to repeat is that NPD BookScan tracks (theoretically at least, since again, publishers set their own BISACs) Adult reading distinctly from YA and Kids. I don’t. Part of this is that I’m a bookseller, and I’m rather agnostic about who specifically buys books as a result. But I have to be certain to make this point as clearly as I can: the market for who is buying comics is changing, and it is changing for the wider and the better. The eight year old who is inhaling Dav Pilkey in 2021 is going to be the comics-literate adult of 2034 (or whatever), which is going to change what comics readers in the ‘30s will want or expect from comics. The kids reading comics in 1965 totally imagined what the 1980’s comics scene could and would be, which is why we’re where we are today, but the shape of the Western industry in the future is absolutely what today’s children read and see.
Ignore this at your deadliest of perils: the future is always shaped by the present, even if that isn’t what you personally want.
OK, enough editorializing, let’s look at the market!
Here’s the Western Top 750 over time:
| Year | # of placing titles | Unit sales | Calculated Retail price |
| 2003 | 304 | 2,133,618 | $32,360,644 |
| 2004 | 233 | 1,467,535 | $22,713,802 |
| 2005 | 142 | 1,315,920 | $21,537,155 |
| 2006 | 174 | 1,689,571 | $29,314,852 |
| 2007 | 175 | 1,746,962 | $33,247,187 |
| 2008 | 236 | 2,710,175 | $48,327,594 |
| 2009 | 299 | 3,219,748 | $52,147,410 |
| 2010 | 314 | 3,297,317 | $54,515,605 |
| 2011 | 358 | 3,068,593 | $77,254,870 |
| 2012 | 383 | 3,530,143 | $68,593,986 |
| 2013 | 435 | 3,988,864 | $74,805,932 |
| 2014 | 479 | 4,910,846 | $90,166,989 |
| 2015* | 471 | 6,729,449 | $115,035,044 |
| 2016* | 439 | 7,338,541 | $123,594,588 |
| 2017 | 466 | 7,846,357 | $117,761,519 |
| 2018 | 451 | 9,114,745 | $129,929,990 |
| 2019 | 418 | 11,998,489 | $176,470,137 |
| 2020 | 392 | 12,825,951 | $196,604,939 |
| 2021 | 255 | 14,752,121 | $225,424,778 |
2021 NPD BookScan’s Top 750 for Western publishers is doing fine: up 15% in pieces, up nearly the same in calculated retail dollars (though, please remember this latter is a purely fictional number because we have no way of know what a book actually sold for!), and the highest absolute number that we’ve ever seen, even while the actual number of placing books has its fifth year of decline. We’d be writing hosannas to this if it weren’t for the total explosion in Manga, which nearly tripled in 2021!
If we were to look at the entirety of all of NPD BookScan’s reported numbers for the total 34,617 distinct “Western” comics, things look generally like this – there are 1682 publishers listed in the 2021 chart, but only 13 of them manage to capture 1% or more of the market
This is not quite as lopsided as the Manga chart…. But it is still a bit staggering that one publisher (Scholastic) is more than 40% of all graphic novels sold.
Let’s start with a look at the Long Tail for Western publishers collectively. As you see the comparison against the Top 750 is leaning harder on best-sellers – the best-selling books in the Top 750 sell around 60% of the volume of all graphic novels sold in 2021 as reported to NPD BookScan. Please pay attention: the “other” 34,000+ books really don’t sell all that well. This is how books work.
| Year | # of listed items | % Change | Total Pieces | % Change | Calculated Retail Value | % Change | Av. Sale per title | Av $ per title |
| 2007 | 6950 | — | 3,029,039 | — | $74,595,605 | — | 436 | $10,733 |
| 2008 | 9728 | 39.97% | 5,368,678 | 77.24% | $98,233,459 | 31.69% | 552 | $10,098 |
| 2009 | 10,936 | 12.30% | 5,946,595 | 10.76% | $107,263,294 | 9.19% | 544 | $9,808 |
| 2010 | 13,229 | 20.97% | 5,890,507 | -0.01% | $105,342,577 | -0.02% | 445 | $7,963 |
| 2011 | 14,954 | 13.04% | 6,001,731 | 1.89% | $112,823,763 | 7.10% | 401 | $7,545 |
| 2012 | 17,031 | 13.89% | 6,052,179 | 0.84% | $123,471,753 | 9.44% | 355 | $7,250 |
| 2013 | 17,468 | 2.57% | 6,637,420 | 9.67% | $131,767,547 | 6.72% | 380 | $7,543 |
| 2014 | 19,524 | 11.77% | 7,905,939 | 19.11% | $156,040,431 | 18.21% | 405 | $7,992 |
| 2015* | 18,019 | -7.71% | 10,689,116 | 34.44% | $197,553,909 | 26.60% | 593 | $10,964 |
| 2016* | 16,328 | -9.38% | 11,516,867 | 7.74% | $212,698,759 | 7.67% | 705 | $13,027 |
| 2017 | 25,183 | 54.23% | 12,544,715 | 8.92% | $217,360,776 | 2.19% | 498 | $8,631 |
| 2018 | 27,583 | 9.53% | 13,865,209 | 10.53% | $230,924,408 | 6.24% | 503 | $8,372 |
| 2019 | 30,816 | 11.72% | 17,233,606 | 24.29% | $288,745,613 | 25.04% | 559 | $9,370 |
| 2020 | 31,893 | 3.49% | 18,495,127 | 7.3% | $318,796,963 | 10.41% | 580 | $9,996 |
| 2021 | 34,624 | 8.56% | 24,105,059 | 30.33% | $430,020,217 | 34.89% | 696 | $12,420 |
This is a fantastic collective performance, with solid growth against not just the previous year, but against historical norms as well. From 20,000 feet, “Western” comics seems extremely healthy, but it might be concerning that fewer new books and voices appear to be breaking through into the Top 750, and the “traditional” Direct Market superhero establishment generally can’t seem to have a new property crack the book market if their lives depended on it.
Next, we’ll survey each of the publishers, and their best-selling titles, ranking them by the number of pieces they sold this year with the Top 750 of NPD BookScan. We’ll also look at the “long tail” for each entry discussing the entirety of NPD BookScan.
It is now the seventh year in the row that our #1 Western publisher in the NPD BookScan Top 750 is Scholastic. Given that they only started “doing” comics in 2005, and in that time they’ve grown to past 40% of the market with under four hundred and fifty SKUs… well, I think that deserves some praise. And at the end of the day, the current landscape makes me think they’re unlikely to get supplanted anytime soon unless kids collectively decide that they suddenly don’t like Dav Pilkey any longer.
Within the Top 750, Scholastic sells a staggering 9.4 million copies, from 83 placing books – they sold 6.9m last year collectively. Every number reported here is only from retail sales through NPD BookScan reporters – this doesn’t count what I will assume are much larger numbers of copies that happen via the incredibly successful Scholastic Book Fairs, direct to students. Nor does this count any sales that are being done to elementary and middle school libraries, numbers that likely exceed retail sales. Possibly by a multiple?
Also consider that the next largest publisher sold a combined 1.2m copies in the Top 750, or only about an eighth of Scholastic’s volume. Or, how about this: if you combine the Top 750 performance of all of the traditional Direct Market “Premiere” publishers (Boom!, Dark Horse, DC, Dynamite, IDW, Image and Marvel) those combined best-sellers only amount to under 970k books together, or barely a tenth of Scholastic alone. Scholastic is, quite simply, the ruler of the Top 750.
Scholastic has several imprints – besides the Graphix imprint, they also publish as AFK, Arthur A. Levine and Blue Sky, as well as “Scholastic”, itself (although most of the action is at Graphix)
In alphabetical order by imprint:
Most of Scholastics imprints don’t place inside the Top 750 this year, including our alphabetical first: AFK’s best-seller is just over 6k copies of Bendy: Crack-Up Comics Collection which is material from the 1930s and 1940s
Arthur A. Levine does about the same: just under 6k copies of The Arrival by Shaun Tan.
Blue Sky also misses the Top 750, with their best-seller being under 4k of a boxed set of Dav Pilkey’s Captain Underpants. I think I expected more, given the rampaging success of Dog Man and Cat Kid!
The Graphix imprint has 75 placing titles, for 9.1m in sales, and is where the big hits live: the aforementioned Dog Man, Baby Sitter’s Club, Five Nights at Freddy’s, Wings of Fire, and Raina Telgemeier’s books, all of which are discussed in the “Top 20” section at the top of this article. Twenty-one volumes of Pilkey’s Dog Man (and spinoff Cat Kid) alone shift just under 5.2 million books, to recap. Telgemeier sells “only” 1m copies combined. While the post-Telgemeier Baby Sitter’s Club racks up 1.2m combined sales without her. The three Five Nights at Freddy’s books sell 475k, while Wings of Fire combined does about 660k
While not in the Top 20 for them (the first one is Scholastic’s #39 best-seller via NPD BookScan), Graphix also does fantastic with the “I Survived” line, where The Nazi Invasion does almost 70k copies, Shark Attacks of 1916 brings in almost 45k, September 11th does almost 44k, and Sinking of the Titanic brings in 37k – as a whole, the line nearly brings in 196k copies sold. If this was a separate publisher, it would be the #8 largest one in the Top 750 Western pubs list. Wow! Other big launches include Allergic (54k) by Megan Wagner Lloyd, and Twins (53k) by Varian Johnson. Kazu Kibuishi’s Amulet series also continues to do well (all eight volumes, and a boxed set live within the Top 750), with v1 The Stonekeeper doing over 53k, while the nine placers combined sell 191k together.
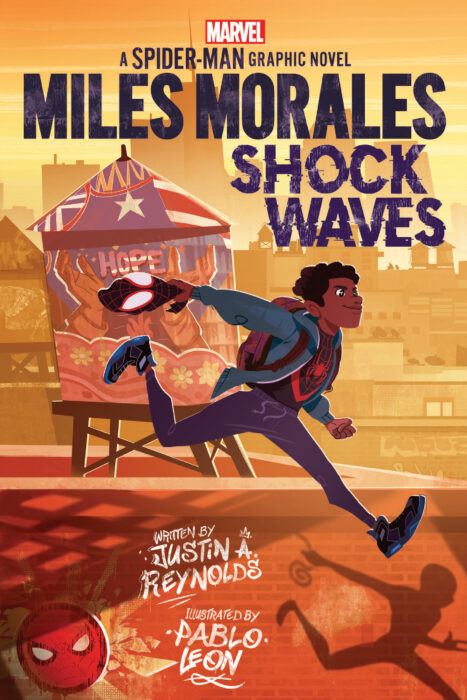
After this, we’re looking at books under 50k, though many of these still sell much better than things you would otherwise expect – one super-clear example is the 42k copies of Scholastic’s Miles Morales: Shock Waves, which sells roughly four times better than any other Marvel graphic novel published by Marvel, and, in fact, more than ten times better than Marvel’s own Miles Morales best-seller (Spider-Verse: Miles Morales). Chew on the ramifications of that for a little while.
Molly Ostertag’s The Girl From The Sea launches at about 33k, while their previous series, Witch Boy has the first volume selling over 15k. Jennifer Holm’s fourth Sunny book, Sunny Makes a Splash sells almost 28k, with v1 (Sunny Side Up) selling almost 13k. Also over the 20k mark is v2 of Heartstopper which is over 24k.
Scholastic also publishes as “Scholastic”, straight up, and they place five more titles that way. The best seller is The Xtreme Xploits of the Xplosive Xmas at 26k, which is a non-Pilkey spinoff from the Captain Underpants TV show.
Also of note in the final Scholastic entry in the Top 750, and also coincidentally the final book of the Top 750 itself, and arguably the book that kicked off Scholastic’s market domination: Jeff Smith’s Bone: Out From Boneville which sells 12k copies.
I’ve one more note about Scholastic I want to mention here and it relates to how publishers are actually entirely in control of their “metadata” – Scholastic seriously stepped up their game in 2021 and changed virtually every title of every book to not only include series titles and volume numbers, but also to add the words “A Graphic Novel” so that not only is it instantly clear what is what and who is who, but to make cross-discovery for bookstores and librarians so much easier. This sounds like an obvious and simple thing, but you’d be stunned just how badly most publishers mangle these things. I am absolutely certain that it is a significant portion of Scholastic’s success and growth this year.
The Long Tail for Scholastic looks like this – they’re doing extremely well:
| Year | # of listed items | Percent Change | Total Unit Sold | Percent Change | Calculated Retail price | Percent Change | Av. Sale per title | Av $ per title |
| 2007 | 28 | —— | 203,900 | —— | $2,018,694 | —– | 7282 | $72,096 |
| 2008 | 39 | 39.29% | 346,134 | 69.76% | $3,498,012 | 73.28% | 8875 | $89,693 |
| 2009 | 52 | 33.33% | 432,070 | 24.83% | $4,654,686 | 33.07% | 8309 | $89,513 |
| 2010 | 60 | 15.38% | 361,086 | -16.43% | $4,084,718 | -12.25% | 6018 | $68,079 |
| 2011 | 72 | 20.00% | 419,010 | 16.04% | $4,708,860 | 15.28% | 5819 | $65,401 |
| 2012 | 76 | 5.56% | 325,088 | -22.42% | $3,955,249 | -16.00% | 4277 | $52,043 |
| 2013 | 91 | 19.74% | 437,590 | 34.61% | $5,365,921 | 35.67% | 4809 | $58,967 |
| 2014 | 97 | 6.59% | 846,277 | 93.39% | $10,204,175 | 90.17% | 8725 | $105,198 |
| 2015* | 140 | 44.33% | 1,449,296 | 71.26% | $17,170,714 | 68.27% | 10,352 | $122,648 |
| 2016* | 131 | -6.43% | 1,940,760 | 33.91% | $23,919,704 | 39.31% | 14,815 | $182,593 |
| 2017 | 166 | 26.72% | 2,823,345 | 45.55% | $33,884,541 | 41.66% | 17,008 | $204,124 |
| 2018 | 224 | 34.94% | 4,623,212 | 63.75% | $54,645,209 | 61.27% | 20,639 | $243,952 |
| 2019 | 270 | 20.54% | 6,868,794 | 48.57% | $88,878,195 | 62.65% | 25,440 | $329,179 |
| 2020 | 343 | 27.03% | 7,164,029 | 4.30% | $95,638,289 | 7.61% | 20,886 | $278,829 |
| 2021 | 436 | 27.11% | 9,987,540 | 39.41% | $137,156,876 | 43.43% | 22,907 | $314,580 |
Scholastic has one book over a million copies (!), two more over 500k, another seven over 250k, 23 more over 100k, 17 more over 50k, 13 more over 20k, and another staggering 29 over 10k. Whew! Any other publisher would be satisfied with a tiny fraction of that (as you will clearly see if you keep reading along)
Scholastic seems more and more like an unstoppable juggernaut to me: the vast majority of their portfolio is extremely likely to go on to “perennial seller” status. And I continue to lustily fantasize about what might happen if they decided to do two streams of revenue and serialized first before eventual collection.
Stepping back up to retake the #2 largest publisher with Western comics in NPD BookScan Top 750 in 2021 is the first of the traditional “Big Five” book publishers: HarperCollins. Some of this is because HarperCollins completed the purchase of Houghton Mifflin Harcourt in 2021 – HMH was the 11th largest publisher in the Top 750 NPD BookScan list for 2020, if you will recall. Harper places thirty-two books into the Top 750 for a total of 1.22 million copies sold, and a calculated retail cover price of $18.7 million. There’s a lot of imprints with the word “Harper” in the title in the Long Tail (Harper, Harper Paperbacks, Harper Teen, Harper Festival, Harper Teen, and so on), and Harper is also Blazer & Bray, Clarion, Etch, Mariner, Quill Tree and William Morrow (in the Top 750); as well as Amistad, Dey Street, Ecco, Fourth Estate, Friday Project, Greenwillow, Harvest, Houghton Mifflin Harcourt, Joanna Cotler, Katherine Tegan, IT books, Thomas Nelson, Versify, William Collins and Zondervan (out of the Top 750)
In alphabetical-by-imprint order:
At Balzer & Bray they place six titles into the Top 750, and it continues to be mostly all about Terri Libenson. Truly Tyler is her newest, and is the #3 overall best-seller for HarperCollins, and first for this imprint. It sells nearly 89k, a very strong result. Becoming Brianna (#9 overall) comes in at 35k, Just Jamie (#15) does 27k, while Invisible Emmie (20k) and Positively Izzy (16k) don’t make the Harper Top 20. Balzer & Bray also sells nearly 13k of Robin Ha’s Almost American Girl down towards the bottom of the Top 750.
Clarion was a Houghton Mifflin Harcourt imprint that is now new to the Harper family. Clarion places seven titles within the Top 750, mostly Kayla Miller titles – Camp is the imprint’s biggest success (as the #6 overall title for Harper), selling 53k, with Clash (#7) very close behind at 51k. At #12 is Act (32k), while #13 is Click (28k). Just missing the Top 20 is Besties: Work it Out just a hair under 20k. And, for non Miller-authored titles, Harper’s #20 best-seller is The Crossover by Kwame Alexander which sells 21k.
Etch is actually a sub-imprint of Clarion (which, no, isn’t confusing at all!), and places Harper’s #8 best-seller, Hooky by Miriam Bonastre Tur, which was a digital-first comic from WebToons. It sold 35k copies, and did so soley with three months of sales in 2021. This is a solid piece of evidence of the potential webcomics have to sell physical books in very meaningful numbers (more on this in a bit)
At the various Harper-named imprints, they have ten titles within the overall NPD BookScan Top 750. Their biggest hit is from gaming stars from YouTube. FGTeev’s Saves The World! (#1 for Harper overall) sells 154k copies, while Into the Game! (#5) moves 80k copies in paperback, and (#14) an additional 27k copies in hardcover. While not in the Top 20, Game Break! does nearly 17k. Meanwhile, the Minecraft-inspired PopularMMOs is also strong, selling 25k copies of Zombie’s Day Off (#17) as well as another 15k copies of Into the Overworld a bit further down the Top 750.
Harper also does well with Warriors: Winds of Change (#10 for Harper overall), selling 34k copies, and Sapiens: A Graphic History (#18) which sells almost 25k. While not in Harper’s Top 20, the adaptation of To Kill A Mockingbird and Lily Lamotte’s Measuring Up also place in the Top 750 of the overall charts, both a bit below 15k.
Mariner was also a former HMH imprint, and has five in the Top 750. Their biggest hit is Alison Bechdel’s The Secret of Superhuman Strength (#11) which sells nearly 32k copies, Bechdel also continues to move a lot of copies of Fun Home (#19) at over 21k. Instagram-native Strange Planet by Nathan Pyle (#16 overall for Harper this year) sells 26k – this book sold 119k copies in 2020, so this number is a pretty big drop. The sequel, Stranger Planet, does a hair under 20k. Mariner also sells 15k copies of the graphic novel adaptation of George Orwell’s 1984.
The Quill Tree imprint places three books, including Harper’s #2 best-seller for the year: Jerry Craft’s New Kid with 145k sold (this is down substantially from 222k last year), while at #4 is Craft’s Class Act (81k). And down towards the bottom of the Top 750 is N.D. Stevenson’s perennial Nimona, with almost 16k sold.
Finally, the William Morrow imprint is in the Top 750 overall, but not a Top 20 book for Harper – they sell 13k of the forever perennial Understanding Comics by Scott McCloud, a little above last year’s 12k.
Here is the Long Tail for Harper, now with HMH included only for this year:
| Year | # of listed items | Percent Change | Total Unit Sold | Percent Change | Calculated Retail value | Percent Change | Av. Sale per title | Av $ per title |
| 2007 | 18 | —— | 36,940 | —— | $600,540 | —– | 2052 | $33,363 |
| 2008 | 36 | 100.00% | 48,264 | 30.66% | $863,808 | 43.84% | 1341 | $23,995 |
| 2009 | 42 | 16.67% | 81,774 | 69.43% | $1,308,891 | 15.53% | 1947 | $31,164 |
| 2010 | 41 | -2.38% | 64,429 | -21.21% | $719,328 | -45.04% | 1571 | $17,545 |
| 2011 | 50 | 21.95% | 75,394 | 17.02% | $1,083,609 | 50.64% | 1508 | $21,672 |
| 2012 | 80 | 60.00% | 159,573 | 111.65% | $2,113,744 | 95.07% | 1995 | $26,422 |
| 2013 | 68 | -15.00% | 197,595 | 23.83% | $2,667,933 | 26.22% | 2906 | $39,234 |
| 2014 | 115 | 69.12% | 158,193 | -19.94% | $2,398,836 | -10.09% | 1376 | $21,042 |
| 2015* | 109 | -5.22% | 188,181 | 18.96% | $2,646,378 | 10.32% | 1726 | $24,279 |
| 2016* | 108 | -0.09% | 261,183 | 38.79% | $4,473,589 | 69.05% | 2418 | $41,422 |
| 2017 | 107 | -0.09% | 357,972 | 37.06% | $5,530,994 | 23.64% | 3346 | $51,692 |
| 2018 | 148 | 38.32% | 517,800 | 44.65% | $7,506,751 | 35.72% | 3499 | $50,721 |
| 2019 | 154 | 4.05% | 891,701 | 72.21% | $13,894,052 | 85.09% | 5790 | $90,221 |
| 2020 | 220 | 42.86% | 1,219,785 | 36.79% | $19,396,157 | 39.60% | 5544 | $88,164 |
| 2021 | 403 | 83.18% | 1,668,202 | 36.76% | $26,028,053 | 34.19% | 8279 | $64,586 |
HarperCollins has two books over 100k, three more over 75k, another two over 50k, a further thirteen books over 20k, and another fifteen more over 10k.
Just for the historical record to remain intact, here is what Houghton Mifflin Harcourt used to sell before HarperCollins bought them in 2021; these numbers are not included in the above chart:
| Year | # of listed items | Percent Change | Total Unit Sold | Percent Change | Calculated Retail value | Percent Change | Av. Sale per title | Av $ per title |
| 2007 | 4 | —— | 20,474 | —— | $434,495 | —— | 5119 | $108,624 |
| 2008 | 6 | 50.00% | 14,183 | -30.73% | $307,019 | -29.34% | 2363 | $51,170 |
| 2009 | 14 | 233.33% | 24,568 | 73.22% | $436,328 | 42.12% | 1755 | $31,166 |
| 2010 | 17 | 21.43% | 29,163 | 18.70% | $532,539 | 22.05% | 1715 | $31,326 |
| 2011 | 18 | 5.88% | 24,239 | -16.88% | $450,536 | -15.40% | 1347 | $25,030 |
| 2012 | 21 | 16.67% | 23,562 | -2.79% | $402,575 | -10.65% | 1122 | $1,9170 |
| 2013 | 29 | 38.10% | 44,558 | 89.11% | $687,920 | 70.88% | 1536 | $23,721 |
| 2014 | 27 | -6.90% | 32,751 | -26.50% | $552,884 | -19.63% | 1213 | $20,477 |
| 2015* | 33 | 22.22% | 78,357 | 239.25% | $1,214,786 | 219.72% | 2374 | $36,812 |
| 2016* | 38 | 15.15% | 60,359 | -22.97% | $943,188 | 22.36% | 1588 | $24,821 |
| 2017 | 27 | -28.95% | 42,963 | -28.82% | $710,481 | -24.67% | 1591 | $26,314 |
| 2018 | 60 | 222.22% | 41,596 | -3.18% | $701,891 | -1.21% | 693 | $11,698 |
| 2019 | 59 | -1.67% | 192,157 | 361.96% | $2,909,580 | 314.53% | 3257 | $49,315 |
| 2020 | 75 | 27.12% | 253,602 | 31.98% | $3,611,395 | 24.12% | 3381 | $48,152 |
Dropping a slot to #3 is another of the traditional “Big Five” book publishers: Penguin Random House. They land 31 titles into the 2021 NPD BookScan Top 750, selling 1.1 million copies for just under $19m in calculated gross sales.
Like a lot of the “Big Five” book publishers, these companies have lots and lots of imprints built up over decades of publishing books. Penguin Random House, as best as I can tell, has nine distinct imprints that appear in the Top 750 list for 2021 – Alfred A. Knopf, Del Rey, Dial, Pantheon, Random House Books For Younger Readers, Random House Graphic, Ten Speed, Tundra, and Viking Books For Young Readers.
They’re also, in the long tail: (deep breath!) Ace, Ballantine, Bantam, Berkley, Blue Snake, Broadway Books, Clarkson N. Potter, Crown, Delacorte, Doubleday, Dutton, Emblem, Golden, Gotham Books, G.P. Putnam & Sons, Grossett & Dunlap, Hudson Street, InkLit, Knopf, McClelland & Stewart, Montena, Nan A. Talese, New American Library, One World, Penguin, Philomel, Plume, Potter Style, Prestel, Price Stern Sloan, Puffin, Putnam, Razorbill, Riverhead, Rodale, Schocken, Schwartz & Wade, Tarcherperigee, Three Rivers, Triangle, Villard, Waterbrook, Watson-Guptill and Yearling. (whew!)
However, they are not (Brian writes down here so he remembers this research next year – you’d be shocked how long it take me to sort through this each year!) the PRH-distributed-only Angry Robot, BCN Multimedia, Beacon, Black Balloon, Campfire, Charlesbridge, Devil’s Panties, Dragonfly, Fawcett, Frog In Well, Gefen, Library of America, M Press, New York Review, Nobrow, NoStarch, North Atlantic, Overlook Press, Powerhouse, Quirk, Ramble House, Rizzoli, Sasquatch, Seven Stories Press, Shambhala, Smithsonian, Soft Skull, Sonoma Valley Press, Sunday Press, Universe, or Verso (I am sure I missed a few!!)
Looking at those imprints in alphabetical order, within the Top 750:
Alfred A. Knopf Books For Younger Readers places two books into the Top 750, though neither are within PRH’s Top 20. Roughly 14k copies each of White Bird: A Wonder Story, as well as Cardboard Kingdom: Roar of the Beast by Chad place this year.
Del Rey has one major hit for 2021, and that is physical print version of the WebToon-native digital comic Lore Olympus by Rachel Smythe. Placing as #3 for PRH’s Top 20 is the softcover selling 101k copies, while the hardcover of the same sells 66k, and placing at #5. If those two books were combined, those 167k copies would make it the number two best-selling book intended for an Adult audience, just inches behind the 170k of “Attack on Titan”. This, combined with Hooky from HarperCollins above would appear to clearly show an enormous potential audience for print-editions of successful (free!) webcomics. This is a giant development that shouldn’t be understated, though we will see how sustainable it is over the next few years, as more titles come to print. That it appears to be the opposite result from comics that were sold digital first is the most interesting part of this result, if you ask me. Del Rey also publishes the Dave Wenzel adaptation of The Hobbit for about 15k copies, and this is another solid, steady perennial volume that had placed for years and years.
Dial places two books in the Top 750, and both are by Victoria Jamieson: When Stars Are Scattered” (#2 for PRH) at almost 104k copies, and Roller Girl (not in the Top 20) at about 21k.
Pantheon is their “literary” comics wing, and has some of PRH’s steadiest-sellers. There are four placing in 2021, including Marjane Satrapi’s Persepolis (#6 for PRH overall) which sells 62k of volume 1 (up a good amount from 51k in 2020). As always surprises me with Pantheon books, way way less people read v2, only about a thirteenth at 4500 copies, not even making it into the Top 750! But the Complete edition of Persepolis (#18) does 26k. Similarly, Art Spiegelman’s Maus continues its multi-decade success with 34k copies of v1 (#14), 11k of v2, and 20k copies of the Complete edition. Please note this is before the banning of the book in Tennessee in Jan 2022, which led to an astonishing surge of sales for the book that will show up next year.
Random House Books For Younger Readers places eight titles into the Top 750, led by Dinosaurs Before Dark by Mary Pope Osborne (#10), for just over 44k; Osbourne’s The Knight at Dawn sells about 16k further down the Top 750. Following Dinosaurs by just a mere one hundred and forty-two copies, is Pizza and Taco: Who’s the Best? by Stephen Shaskan (#11) at 44k. Also by Shaskan is Pizza and Taco: Best Party Ever! (#17, 27k), and further down the overall Top 750, Pizza and Taco: Super-Awesome Comic! with 15k. At #15 is 34k copies of Katie the Catsitter by Colleen AF Venable, while at #16 with 29k sold is the seventh volume of Judd Winick’s Hilo series. RHBFYR also sells about 16k copies of Max Meow by John Gallagher.
Random House Graphic (which on some level is a rebrand for the previous imprint) has one placing book in the Top 750 – approximately 19k copies of Sophie Escabasse’s Witches of Brooklyn.
Ten Speed brings us the David Walker written The Black Panther Party: A Graphic Novel History, which while it isn’t in PRH’s Top 20, makes the NPD BookScan Top 750 with almost 14k sold.
Tundra has five placing volumes of Ben Clanton’s Narwahl: Unicorn of the Sea series. Volume 4, Narwhal’s Otter Friend, (#7 for PRH overall) sells 53k, followed by v6, Narwhal’s School of Awesomeness (#8 and 48k), then v1 Unicorn of the Sea (#9, 45k), v3 Peanut Butter and Jelly (#19, 24k), and v2 Super Narwhal and Jelly Jolt (#20, 24k). The “hammock” rules don’t seem to apply to this series!
And finally, Viking Books For Young Readers has Penguin Random House’s best-selling book in 2021, The Last Kids on Earth by Max Brallier, with The Doomsday Race (#1) selling almost 110k, The Skeleton Road (#4) selling 81k, June’s Wild Flight (#12) selling 43k, and The Midnight Blade (#13) at just under 40k
Penguin Random House formed out of a merger in 2013 – prior to that they were separate publishers Penguin and Random House. Here’s what the Long-Tail for the combined Penguin Random House looked like in 2021:
| Year | # of listed items | % Change | Total Pieces | % Change | Calculated Retail Value | % Change | Av. Sale per title | Av $ per title |
| 2013 | 282 | ——- | 447,174 | ——- | $7,259,364 | ——- | 1,586 | $25,742 |
| 2014 | 252 | -10.64% | 428,634 | -4.15% | $7,415,712 | 2.15% | 1,701 | $29,427 |
| 2015* | 450 | 78.57% | 513,611 | 19.83% | $8,517,761 | 14.49% | 1,141 | $18,928 |
| 2016* | 293 | -34.88% | 435,877 | -15.13% | $7,150,087 | -16.06% | 1,488 | $24,403 |
| 2017 | 409 | 39.59% | 664,858 | 52.53% | $10,136,224 | 41.76% | 1,626 | $24,783 |
| 2018 | 613 | 49.88% | 760,314 | 14.36% | $11,136,058 | 9.86% | 1,240 | $18.166 |
| 2019 | 635 | 3.59% | 1,013,092 | 33.25% | $15,745,448 | 41.39% | 1,595 | $24,796 |
| 2020 | 551 | -13.23% | 1,380,328 | 36.25% | $21,157,243 | 34.37% | 551 | $38,398 |
| 2021 | 809 | 46.82% | 1,901,467 | 37.75% | $30,131,057 | 42.41% | 2350 | $37,245 |
However, I’m not willing to pull an “We’ve always been at war with Eurasia” moment, so let’s look at the individual pieces of the past. This is what Penguin Putnam (Ace, Berkley Books, Dial, Dutton, Gotham Books, Grossett & Dunlap, Hudson Street, InkLit, New American Library, Penguin, Philomel, Plume, Price Stern Sloan, Puffin, Putnam, Razorbill, Riverhead and Viking) used to look like alone:
| Year | # of listed items | % Change | Total Pieces | % Change | Calculated Retail Value | % Change | Av. Sale per title | Av $ per title |
| 2007 | 18 | —— | 13,545 | —— | $178,260 | —— | 753 | $9,903 |
| 2008 | 28 | 55.56% | 28,606 | 111.19% | $310,856 | 74.38% | 1022 | $11,102 |
| 2009 | 39 | 39.29% | 40,288 | 40.84% | $444,928 | 43.13% | 1033 | $11,408 |
| 2010 | 45 | 15.38% | 50,628 | 25.67% | $623,650 | 40.17% | 1125 | $13,859 |
| 2011 | 53 | 17.78% | 123,749 | 144.43% | $1,576,161 | 152.73% | 2335 | $29,739 |
| 2012 | 60 | 13.21% | 121,769 | -1.60% | $1,499,660 | -4.85% | 2029 | $24,994 |
This is what Random House (Alfred A. Knopf, Ballantine, Bantam, Broadway, Crown, Del Rey, Doubleday, Pantheon, Random House, Schocken, and Three Rivers) looked like alone:
| Year | # of listed items | % Change | Total Pieces | % Change | Calculated Retail value | % Change | Av. Sale per title | Av $ per title |
| 2007 | 74 | — | 216,580 | — | $2,890,347 | — | 2,927 | $39,059 |
| 2008 | 77 | 5.47% | 383,105 | 76.89% | $5,698,922 | 97.17% | 4,975 | $74,012 |
| 2009 | 109 | 41.56% | 405,598 | 5.87% | $5,398,890 | -5.26% | 3,721 | $49,531 |
| 2010 | 132 | 21.10% | 389,410 | -3.99% | $5,831,814 | 8.02% | 2,950 | $44,180 |
| 2011 | 144 | 9.09% | 397,143 | 1.99% | $6,356,212 | 8.99% | 2,760 | $44,140 |
| 2012 | 185 | 28.47% | 375,254 | -5.51% | $7,124,794 | 12.09% | 2,028 | $38,512 |
Penguin Random House has three titles over 100k, another book over 75k, three more titles over 50k, 16 additional books over 20k, and another 11 books over 10k.
Coming in at #4 is Holtzbrinck, which owns Macmillan, another of the “Big Five”, and is also one of those publishers with lots and lots (and lots) of imprints, although only FirstSecond places within the NPD BookScan Top 750 – I have also identified Farrar, Straus and Giroux, Feiwel & Friends, Griffin, Henry Holt, Hill + Wang, Imprint, Metropolitan, Picador, Roaring Brook, Rodale Press, Square Fish, St. Martins Griffin, Times books, and Tor. Holtzbrinck also distributes several other publishers they don’t own (including Bloomsbury, Drawn & Quarterly, Papercutz, and Seven Seas) Holtzbrinck-owned companies placed fifteen titles in the Top 750, for about 617k copies sold and about a calculated $8.4m gross combined.
FirstSecond is their only placing imprint; their biggest hit is Shannon Hale and LeUyen Pham’s juvie-focused Friends Forever (#1, 103k sold), this is followed by Best Friends (#4, 57k) and Real Friends (#9, 37k). That series is followed closely by John Patrick Green’s Investigators where Off The Hook (#2) sells 76k. The first volume is #3 with 61k, and is followed by Take The Plunge (#5, 52k) and Ants in Our P.A.N.T.S. (#6, 51k)
The for-adults The Adventure Zone comes next, where The Crystal Kingdom in paperback (#7) sells 40k, and also does (#10) 26k in hardcover. Here There Be Gerblins is #15 with 12k sold.
Gene Luen Yang’s American Born Chinese is #8 with 38k sold, while in its second year his Dragon Hoops (#12) shoots a solid 16k. Jen Wang’s Stargazing (#11) sells 17k, while her The Prince and The Dressmaker (#13) sells 15k, and Kat Leyh’s Snapdragon” (#14) wraps up FirstSecond with 14k sold.
Here’s Holtzbrinck’s Long Tail (again, I might have missed an imprint somewhere – trying to tease them all out from their Byzantine org chart is a difficult task).
| Year | # of listed items | Percent Change | Total Unit Sold | Percent Change | Calculated Retail value | Percent Change | Av. Sale per title | Av $ per title |
| 2007 | 39 | —— | 31,452 | —— | $559,681 | —– | 806 | $14,351 |
| 2008 | 66 | 69.23% | 63,473 | 101.81% | $1,132,767 | 102.40% | 962 | $17,163 |
| 2009 | 88 | 33.34% | 84,090 | 32.48% | $1,438,044 | 26.95% | 956 | $16,341 |
| 2010 | 108 | 22.73% | 68,599 | -18.42% | $1,085,311 | -24.53% | 635 | $10,049 |
| 2011 | 139 | 28.70% | 114,243 | 66.54% | $1,794,084 | 65.31% | 822 | $12,907 |
| 2012 | 165 | 18.71% | 126,745 | 10.94% | $2,077,143 | 15.78% | 768 | $12,589 |
| 2013 | 187 | 13.33% | 142,375 | 12.33% | $2,395,569 | 15.33% | 761 | $12,811 |
| 2014 | 222 | 18.72% | 190,682 | 33.93% | $3,096,858 | 23.27% | 859 | $13,950 |
| 2015* | 104 | -53.15% | 99,223 | -47.96% | $1,804,001 | -41.75% | 954 | $17,346 |
| 2016* | 272 | 161.54% | 272,668 | 174.80% | $4,240,075 | 135.04% | 1,002 | $15,589 |
| 2017 | 336 | 23.53% | 437,258 | 60.36% | $6,616,130 | 56.04% | 1,301 | $19,691 |
| 2018 | 427 | 27.08% | 723,096 | 65.37% | $11,701,046 | 76.86% | 1,693 | $27,403 |
| 2019 | 494 | 15.70% | 946,680 | 30.92% | $15,814,819 | 35.16% | 1,916 | $32,014 |
| 2020 | 552 | 11.74% | 1,022,598 | 8.02% | $16,455,419 | 4.05% | 1,853 | $29,811 |
| 2021 | 602 | 9.06% | 1,214,283 | 18.74% | $18,989,371 | 15.40% | 2,017 | $31,544 |
Holtzbrinck has one book over 100k, one over 75k, four others over 50k, four more over 20k, and six others over 10k.
Next in the Top 750 at #5 publisher is Andrews McMeel. Andrews is a publisher that often has frustrated me by how they’ve been represented by NPD BookScan – as I noted, it used to be that “humor” books like “Far Side” and “Calvin & Hobbes” used to rule the NPD BookScan charts. Until, one day, poof! Almost of those books disappeared entirely from the dataset I was given, throwing off a whole lot of my comparables. And, for the most part, comic strip reprints have stayed out of these charts for half a decade. But, they’ve started creeping back into the listings for the last few years. I’m actually fine with comic strips and comic books co-existing in the same places – at least they’re both comics – but the inconsistency just drives me nucking futz.
I found 21 titles from AM in the Top 750 in 2021, for 537k copies and $12.6 million in calculated dollars, but clearly that number would scale up to some large degree if it listed all of the strip collections they publish. What’s interesting about Andrews McMeel is that, for the most part, their “graphic novels” are reformatted/repackaged newspaper strips. In other words, this is basically the other paid-for way one can serialize work: through syndicated newspaper pages.
2021’s top book for Andrew’s McMeel is Lincoln Peirce’s Big Nate, where v24 (In Your Face!) is #1 and sells almost 55k. Aloha! (#3) sells 45k, The Gerbil Ate My Homework (#5) sells 35k, Top Dog (#7) does 32k, while Stays Classy (#9) does 24k.
Catana Chetwynd’s In Love & Pajamas is book #2, selling a bit over 46k.
Then Dana Simpson’s Pheobe and Her Unicorn starts placing – the self-titled v1 (#4) sells 40k, while Unicorn Famous (#6) does 34k, Spellbinding Episodes (#12) sells 19k, Unicorn on a Roll (#14) does 17k, Camping With Unicorns (#16) does 15k, Unicorn Playlist (#18) and Virtual Unicorn Experience (#19) both are around 14k, Razzle Dazzle Unicorn (#20) does almost 13k, and Unicorns vs Goblins (#21) does about 12k.
Next comes Bill Watterson’s Calvin & Hobbes – at #8 is the paperback version of The Complete Calvin and Hobbes with 27k (and at $125 a copy, that’s nearly $3.4m in Calculated Retail Dollars), while the hardcover set of the same comes in at #17 with 15k ($2.9m). Also at #11 is one of the smaller softcovers, The Essential Calvin and Hobbes with almost 22k. Not in the Top 750, but over 10k are Indispensable and Authoritative as well. Mm, and Gary Larson’s Complete Far Side does about 11k, for about $1.4m in Calculated Retail.
Also succeeding for Andrews McMeel is Gina Loveless’ Animal Rescue Friends (#10, 23k), Sarah Andersen’s Fangs (#13, 18k), and Matthew Cody’s Cat Ninja (#15, 15k)
Andrews McMeel’s Long Tail chart is for sure my most frustrating one because they publish a whole lot of comics (humor strips, like Calvin & Hobbes) where the BISAC changed to something we’re having a hard time properly getting – so almost certainly they’re doing several times better than this chart would suggest because of those books. Further, things appear and disappear in a way I’ve never been able to make sense of – it might be them changing BISACs after the fact. Most of my comparatives are terrible and counterproductive here, and I really apologize for the crappiness of my data in this specific instance.
| Year | # of listed items | Percent Change | Total Unit Sold | Percent Change | Calculated Retail Value | Percent Change | Av. Sale per title | Av $ per title |
| 2007 | 22 | —— | 29,835 | —— | $461,238 | —– | 1,356 | $20,965 |
| 2008 | 20 | -9.09% | 25,115 | -15.82% | $388,965 | -15.67% | 1,256 | $19,448 |
| 2009 | 21 | 5.00% | 26,205 | 4.34% | $401,982 | 3.35% | 1,248 | $19,142 |
| 2010 | 19 | -9.52% | 47,181 | 80.05% | $544,852 | 35.54% | 2,483 | $28,676 |
| 2011 | 17 | -10.53% | 116,850 | 147.66% | $1,222,171 | 124.31% | 6,874 | $71,892 |
| 2012 | 31 | 82.53% | 225,546 | 93.02% | $2,737,935 | 124.02% | 7,276 | $88,320 |
| 2013 | 43 | 38.71% | 343,681 | 52.38% | $3,747,799 | 36.88% | 7,993 | $87,158 |
| 2014 | 59 | 37.21% | 373,713 | 8.74% | $4,387,252 | 17.06% | 6,334 | $74,360 |
| 2015* | 76 | 28.81% | 502,061 | 34.34% | $5,950,368 | 35.63% | 6,606 | $78,294 |
| 2016* | 85 | 11.84% | 472,145 | -5.96% | $5,147,673 | -13.49% | 5,555 | $60,561 |
| 2017 | 140 | 64.71% | 520,554 | 10.25% | $5,644,031 | 9.64% | 3,718 | $40,315 |
| 2018 | 273 | 95.00% | 735,184 | 41.23% | $11,862,349 | 210.18% | 2,693 | $43,452 |
| 2019 | 277 | 1.46% | 611,784 | -16.79% | $11,078,977 | -6.60% | 2,209 | $39,996 |
| 2020 | 288 | 3.97% | 644,390 | 5.33% | $13,539,999 | 22.21% | 2,237 | $47,014 |
| 2021 | 359 | 24.65 | 929,267 | 44.21% | $20,557,874 | 51.83% | 2,588 | $57,264 |
Andrews McMeel has one book over 50k, ten more over 20k, and 15 others over 10k.
Moving forward as the #6 publisher in the Top 750 is DC Entertainment. DC spent a really long time as the #1 Western publisher before losing it to Scholastic, and was at least #2 until 2018. If there was a traditional Direct Market publisher that already had all of the tools they needed to compete (at least, before AT&T started laying people off), it was DC, but DC is placing the lowest number of books into the Top 750 it ever has, saying to me they are not living up to their potential.
In 2021 they placed just 17 titles in the Top 750 – about half of a mere two years ago – for 396k units, and $8.3 million in calculated retail price.
DC has four charting imprints: plain DC Comics, DC Ink and Vertigo. Down in the long tail we can still track America’s Best Comics, Black Label, CMX, Jinxworld, Paradox, Mad, Minx, Wildstorm, Zoom and Zuda – makes you wonder how stores still have those handful of copies to sell of imprints that in some cases have been defunct for two decades now! But a certain amount of this should be wholly in DC’s control as they control their metadata. It’s just weird that Teen Titans: Raven has DC INK listed as publisher, and Teen Titans: Beast Boy and …Beast Boy Loves Raven show as “DC COMICS”; or that Sandman reads as Vertigo when that’s not an imprint of DC’s any longer, and so on.
Here’s a year-to-year comparison chart of the Top 750 for DC (Because I started from my first NPD BookScan survey with a complete Direct Market bias, but I hate throwing away charts):
| Year | # of placing titles | Unit sales | Calculated Retail price |
| 2003 | 74 | 336,569 | $6,151,258 |
| 2004 | 39 | 179,440 | $3,135,983 |
| 2005 | 42 | 298,484 | $5,440,001 |
| 2006 | 59 | 551,160 | $10,246,082 |
| 2007 | 58 | 487,467 | $9,953,976 |
| 2008 | 71 | 1,015,864 | $19,805,098 |
| 2009 | 93 | 1,223,733 | $24,061,834 |
| 2010 | 96 | 648,403 | $12,523,128 |
| 2011 | 107 | 660,706 | $13,083,378 |
| 2012 | 104 | 688,870 | $14,811,979 |
| 2013 | 130 | 767,686 | $15,620,981 |
| 2014 | 131 | 931,239 | $19,207,755 |
| 2015* | 119 | 1,074,304 | $21,701,088 |
| 2016* | 117 | 1,234,047 | $23,203,071 |
| 2017 | 101 | 827,544 | $15,234,525 |
| 2018 | 47 | 360,414 | $7,810,753 |
| 2019 | 33 | 413,923 | $9,691,574 |
| 2020 | 29 | 442,163 | $10,332,226 |
| 2021 | 17 | 396,475 | $8,335,338 |
2021 has the lowest number of DC books placing in the Top 750, since we’ve ever tracked this. Not, however, the lowest unit sales, or calculated dollar value! And, if you look at calculated dollars in the Long Tail, DC is actually at the biggest total we’ve ever seen (not that that is necessarily like an actual fact)… So maybe let’s call it a “mixed picture”?
DC’s #1 book via NPD BookScan reporters in 2021 is the YA Teen Titans: Beast Boy by Kami Garcia and Gabriel Picolo. They sell 48k copies. In 2020 it sold 28k, so that’s a big jump. The same team has the #2 book with Teen Titans: Beast Boy Loves Raven (43k), as well as #7 with Teen Titans: Raven (22k). It is a little early to see if these books are going to become perennial sellers, but they’re sure doing well right at the moment. The complete box set sold about 5500 copies
Coming in at #3 is Watchmen by Alan Moore and Dave Gibbons. Nearly 34k copies sell, but this is a pretty big drop from last year’s 52k sold. While it doesn’t place in the Top 750, the hardcover of the same material would be DC’s #18 best-seller, and does almost 12k. Moore’s “Batman: The Killing Joke” comes in as DC’s #10 book, with 19k sold. Also of note for being over 10k is Moore’s V For Vendetta.
At #4 for DC is the first comic featuring Batman, though I think I might argue that he’s not the prime selling point for Batman/Fortnite: Zero Point (28k). There are a lot of Bat-related books selling well for DC, that’s at all a surprise, including The Batman Who Laughs in paperback (#6, 24k) and hardcover (#16, 13k), Batman: Three Jokers (#8, 21k), Batman: Year One (#11, 19k), Long Halloween (#12, 18k), Harleen (#14, 16k), and Batman: Last Knight on Earth (#17, 13k). I would expect that “Batman” books will do much better in 2022, with the new film attached. While they didn’t make the Top 750, DC also did well with Batman: White Knight (12k) and Batman: Joker War (11k) – those are the #19 and #20 best-sellers for DC, respectively.
At #5 was my first real surprise, which is Space Jam: A New Legacy•••PICTURE with almost 28k sold. I am guessing that DC did a big bookstore promotion with that one? I can’t see this book at all going on to continue to sell over the longer horizon. #9 also surprised me a smidge as the second frame of the kid-aimed Primer sells an impressive 19k copies – it “only” sold 12k in year one, so to see year-over-year growth with a brand new character is meaningful, especially as it outsells any other DC kids-aimed comics. The next-best seller is Diana: Princess of the Amazons not in the Top 750, and at just over 10k.
At the spooky #13 is Sandman: Preludes & Nocturnes with 16k. It is worth noting that this volume was out of stock for a good chunk of the year (think April through July), so it probably would have done much better with its pre-Netflix show bounce had there been stock available to sell. DC will be issuing yet another format for Sandman in 2022 (an Amazon streaming series is imminent), so we’ll see if there’s any market confusion stemming from that.
And, as their #15 best-seller to wrap up this survey is the big-crossover sequel Dark Nights: Death Metal which sells a bit over 14k copies. (The original, Dark Nights: Metal shifts about 8500 copies, for a comparison point)
Nothing else from DC cracked 10k in 2021. But when you compare them down to Marvel, below, this is still a much stronger performance.
Here’s DC’s Long Tail – sixth-best year in units sold, and best-ever in our made up stat Calculated Retail Dollars.
| Year | # of listed items | % Change | Total Pieces | % Change | Calculated Retail Value | % Change | Av. Sale per title | Av $ per title |
| 2007 | 1644 | — | 1,181,218 | — | $22,033,212 | — | 719 | $13,402 |
| 2008 | 2057 | 25.12% | 1,719,330 | 45.56% | $33,609,704 | 52.54% | 836 | $16,339 |
| 2009 | 2264 | 10.06% | 1,902,181 | 10.64% | $37,816,864 | 12.52% | 840 | $16,704 |
| 2010 | 2442 | 7.86% | 1,320,262 | -30.59% | $25,982,910 | -31.29% | 541 | $10,640 |
| 2011 | 2423 | -0.07% | 1,323,630 | 0.26% | $27,130,811 | 4.42% | 546 | $11,197 |
| 2012 | 2452 | 1.20% | 1,206,198 | -8.87% | $26,729,997 | -1.48% | 492 | $10,901 |
| 2013 | 2551 | 4.04% | 1,369,850 | 13.57% | $29,881,153 | 11.79% | 537 | $11,714 |
| 2014 | 2746 | 7.64% | 1,638,901 | 19.64% | $35,388,570 | 18.43% | 597 | $12,887 |
| 2015* | 1690 | -38.46% | 1,997,577 | 21.89% | $43,031,546 | 21.60% | 1182 | $25,462 |
| 2016* | 1214 | -28.17% | 2,262,888 | 13.82% | $47,963,215 | 11.46% | 1864 | $39,508 |
| 2017 | 3152 | 259.64% | 1,948,037 | -13.91% | $42,921,514 | -10.51% | 618 | $13,617 |
| 2018 | 3364 | 6.73% | 1,333,836 | -31.53% | $31,844,186 | -25.81% | 397 | $9,466 |
| 2019 | 3229 | -4.01% | 1,303,807 | -2.25% | $33,428,626 | 4.98% | 404 | $10,353 |
| 2020 | 3668 | 13.59% | 1,338,405 | 2.65% | $36,315,104 | 8.63% | 365 | $9,901 |
| 2021 | 3905 | 3.46% | 1,694,306 | 26.59% | $49,650,333 | 36.72% | 434 | $12,715 |
DC has just no books over 50k, eight over 20k, and 14 more that come in over 10k.
Dark Horse Comics is #7 They place 14 titles into the Top 750 for 307k, and $7.2m in calculated retail value.
I also want to point out that Dark Horse, like Scholastic, did a big cleanup of their “metadata” this year, with super-clear distinctions between “Western” comics and “Manga” now in the imprint names. Saved me a ton of work this year, and, again, I am sure it is helping them sell books as a result.
Dark Horse’s biggest successes are virtually all licensed properties this year, and it really comes in three flavors. At #1 is Minecraft, where v1 sells a mighty 44k copies. This is down a little from 47k the previous year, but that’s more than made up by v2 coming in at #5 with 21k sold, up from just 6200 the previous year. While not quite in the Top 750, they also sell almost 12k copies of Minecraft: Wither Without You.
Then comes Avatar: The Last Airbender which has the amusing Urban Legend that DH owner Mike Richardson asked for his team to get the license for the James Cameron Avatar movies which they eventually did after “mistakenly” getting this license instead. I can’t swear this story is true, but I love it regardless. Anyway, A: TLA material is mighty strong for Dark Horse, and is supporting multiple formats very effectively. They lead with the omnibus paperback editions of The Promise (#2, 37k), The Search (#3, 35k) and The Rift (#4, 28k), then follow with new softcovers of Toph Beifong’s Metalbending Academy (#6, 19k), and Suki, Alone (#7, 18k). Then come the hardcover versions of The Search (#8, 18k), and The Promise (#10, 16k), while the HC of The Rift doesn’t make the Top 750 with 11k sold. But there’s more! #11 is the HC version of The Lost Adventures (15k sold), #13 is the HC of Smoke and Shadow (12k), while #14 is Katara and the Pirate’s Silver (12k). While they don’t make the Top 750, DH also sells over 10k copies with two others: the cheapest paperback format of The Promise (again!) as well as paperback The Lost Adventures, both of which are around 11k sold.
While I did compliment Dark Horse on fixing up their “Metadata” broadly a few paragraphs back, there are still multiple versions of “A:TLA” which are missing that from their listing, or are otherwise not precisely clear about format here.
The third big success for Dark Horse in licensed comics is Critical Role: Vox Machina Origins, where the big hardcover of Series 1 & 2 comes in as their #9 best-seller with almost 17k sold.
And as their sole “Native-to-comics-first” title in the list is #12 and the first Umbrella Academy book for nearly 14k sold.
Here’s what Dark Horse’s Western performance looks like in the Long Tail. They’re doing well, and holding on to their huge gains from last year.
| Year | # of listed items | Percent Change | Total Unit Sold | Percent Change | Calculated Retail value | Percent Change | Av. Sale per title | Av $ per title |
| 2007 | 597 | —— | 413,022 | —— | $7,607,264 | —– | 692 | $14,745 |
| 2008 | 734 | 22.95% | 552,815 | 33.85% | $9,329,828 | 22.64% | 753 | $12,711 |
| 2009 | 798 | 8.72% | 455,924 | -17.53% | $7,757,240 | -16.86% | 571 | $9,721 |
| 2010 | 955 | 19.67% | 445,248 | -2.34% | $7,852,063 | 1.22% | 466 | $8,222 |
| 2011 | 1025 | 7.33% | 389,514 | -12.52% | $7,102,710 | -9.54% | 380 | $6,929 |
| 2012 | 1133 | 10.54% | 377,322 | -3.13% | $6,907,772 | -2.74% | 333 | $6,097 |
| 2013 | 1238 | 9.27% | 383,391 | 1.61% | $7,391,831 | 7.01% | 310 | $5,971 |
| 2014 | 1420 | 14.70% | 421,708 | 9.99% | $8,982,411 | 21.52% | 297 | $6,326 |
| 2015* | 947 | -33.31% | 376,231 | -10.78% | $8,120,937 | –9.59% | 397 | $8,575 |
| 2016* | 877 | -7.39% | 461,297 | 22.61% | $9,076,526 | 11.77% | 526 | $10,350 |
| 2017 | 1598 | 82.21% | 478,658 | 3.76% | $9,256,795 | 1.99% | 300 | $5,793 |
| 2018 | 1615 | 1.06% | 485,919 | 1.52% | $9,410,362 | 1.66% | 301 | $5,827 |
| 2019 | 1612 | -0.18% | 459,996 | -5.33% | $9,617,364 | 2.20% | 285 | $5,966 |
| 2020 | 1686 | 4.59% | 971,551 | 111.21% | $20,408,830 | 112.21% | 576 | $12,105 |
| 2021 | 1894 | 12.34% | 988,766 | 1.77% | $22,230,359 | 8.93% | 522 | $11,737 |
In the Long Tail non-manga Dark Horse has its best year ever yet again.
Dark Horse’s Manga offerings are up in that section. Dark Horse is one of the rare publishers that does a significant business in both Eastern and Western comics, and I’m sure they’d prefer all of their numbers to be represented together. In which case, their Long Tail actually looks like this:
| Year | # of listed items | Percent Change | Total Unit Sold | Percent Change | Calculated Retail value | Percent Change | Av. Sale per title | Av $ per title |
| 2007 | 938 | —— | 662,965 | —— | $10,936,728 | —– | 707 | $11,660 |
| 2008 | 1075 | 14.61% | 801,796 | 20.94% | $12,506,698 | 14.36% | 746 | $11,634 |
| 2009 | 1253 | 16.56% | 682,421 | -14.89% | $10,672,933 | -14.66% | 545 | $8,518 |
| 2010 | 1428 | 13.97% | 639,742 | -6.25% | $10,485,140 | -1.76% | 448 | $7,343 |
| 2011 | 1522 | 6.58% | 578,843 | -9.52% | $9,704,940 | -7.44% | 380 | $6,376 |
| 2012 | 1626 | 6.83% | 489,695 | -15.40% | $8,538,810 | -12.02% | 301 | $5,251 |
| 2013 | 1759 | 8.18% | 486,929 | -0.56% | $9,070,394 | 6.23% | 277 | $5,157 |
| 2014 | 1979 | 12.51% | 522,602 | 7.33% | $10,599,661 | 16.86% | 264 | $5,356 |
| 2015* | 1250 | -36.84% | 511,675 | -2.09% | $10,359,104 | -2.27% | 409 | $8,287 |
| 2016* | 1102 | -11.84% | 635,595 | 24.22% | $11,367,881 | 9.74% | 577 | $10,316 |
| 2017 | 2125 | 92.83% | 716,747 | 12.77% | $20,624,676 | 81.43% | 337 | $9,706 |
| 2018 | 2146 | 0.99% | 709,929 | -0.09% | $12,989,497 | -37.02% | 331 | $6,053 |
| 2019 | 2023 | -5.73% | 977,155 | 37.64% | $19,467,752 | 49.87% | 483 | $9,623 |
| 2020 | 2158 | 6.67% | 1,402,313 | 43.51% | $31,520,184 | 61.91% | 650 | $14,606 |
| 2021 | 2325 | 7.74% | 1,998,293 | 42.50% | $49,184,722 | 56.04% | 859 | $21,155 |
Dark Horse, on the Western charts, has three titles over 30k, another two titles over 20k, and 14 more over 10k. Combined with Manga, it would be one over 50k, seven over 30k, 11 over 20k, and 25 over 10k.
Our #8 publisher for the NPD BookScan Top 750 this year, while not considered one of the book world’s “Big Five”, is Harry N. Abrams. They are not also considered a traditional Direct Market publisher, either. They publish as Abrams Comicarts, Harry N. Abrams, as well as Amulet Books. They distribute, but do not publish, U.K. publisher SelfMadeHero. Abrams places nine books, selling 192k copies for $3.4m in calculated dollars.
Abrams’ best-seller in 2021 was the graphic novel version of Dune – not a huge surprise with the film in theatres. At #1, it sells almost 31k copies.
Nathan Hale’s Hazardous Tales line of kid-oriented historical retellings comes next, with v11 Cold War Correspondent in at #2 and 30k copies, v10 Blades of Freedom at #4 with 22k, v4 Treaties, Trenches, Mud & Blood at #7 with15k, v1 One Dead Spy at #8 with 14k, and v7 Raid of No Return at #9 and 14k sold. While they’re not in the Top 750, four other volumes all sell over 10k, and the two remaining ones that don’t are awful close.
Coming in at #3 is Cece Bell’s El Deafo, which sells nearly 30k copies, while Thi Bui’s The Best We Could Do (#5) is at 19k, and volume one of Run (the sequel to the IDW-published March trilogy) comes in at #6 with 16k sold.
Here is your long-tail; solid performance:
| Year | # of listed items | Percent Change | Total Unit Sold | Percent Change | Calculated Retail value | Percent Change | Av. Sale per title | Av $ per title |
| 2008 | 3 | —— | 10,031 | —— | $148,675 | —— | 3,344 | $49,558 |
| 2009 | 25 | 733.33% | 24,116 | 140.41% | $640,635 | 330.90% | 965 | $25,625 |
| 2010 | 41 | 64.00% | 48,240 | 100.03% | $1,109,444 | 73.18% | 1,177 | $27,060 |
| 2011 | 49 | 19.51% | 31,846 | -33.98% | $731,054 | -34.11% | 650 | $14,919 |
| 2012 | 62 | 26.53% | 37,522 | 17.82% | $756,650 | 3.50% | 605 | $12,204 |
| 2013 | 70 | 12.90% | 72,538 | 93.32% | $3,278,063 | 333.23% | 1,036 | $46,829 |
| 2014 | 88 | 25.71% | 74,083 | 2.13% | $2,324,820 | -29.10% | 842 | $26,418 |
| 2015* | 92 | 4.55% | 145,633 | 96.58% | $1,898,267 | -18.35% | 1,583 | $20,633 |
| 2016* | 112 | 21.74% | 177,127 | 21.63% | $2,326,956 | 22.58% | 1,581 | $20,776 |
| 2017 | 124 | 10.71% | 248,580 | 40.34% | $3,449,807 | 48.25% | 2,005 | $27,821 |
| 2018 | 138 | 11.29% | 258,334 | 3.92% | $3,776,138 | 9.46% | 1,872 | $27,363 |
| 2019 | 148 | 7.25% | 265,300 | 2.70% | $4,089,631 | 8.30% | 1,791 | $27,633 |
| 2020 | 152 | 2.70% | 306,087 | 15.37% | $4,891,229 | 19.60% | 2,014 | $32,179 |
| 2021 | 181 | 19.08% | 372,948 | 21.84% | $6,803,571 | 39.10% | 2,060 | $37,589 |
Harry N. Abrams has two books over 30k, two more over 20k, and eight more over 10k in 2020.
Coming in at #9 of the Western Publishers in the Top 750, is another of the “Big Five”: Hachette, which includes the imprints of Jimmy Patterson, JY, and Little Brown in the Top 750, as well as Back Bay, Basic Books, Black Dog & Leventhal, Bold Type, Da Capo, Grand Central, Hodder, Nation Books, Orchard, Orion, Running Press, Trapeze, Voracious and Warner Books in the Long Tail. In the Top 750 they place eight books, selling 169k copies and $2.05m. They also publish manga as Yen which is up above in the previous section.
Little, Brown is their most successful imprint, and it places four titles into the Top 750. The biggest hit is at #1, Goldilocks: Wanted Dead or Alive by Chris Colfer, with almost 30k copies sold. At #2 is Just Pretend by Tori Sharp, with a bit under 28k sold, then at #4 is Meg, Jo, Beth and Amy: A Modern Retelling of Little Women, which brings in sales of 20k. The first Catstronauts book fills out the chart, where Mission Moon (#7) is at 18k, while not in the Top 750 Race to Mars sells almost 11k. There is also Wolfwalkers which does a bit under 11k.
The JY imprint is home to Svetlana Chmakova’s Awkward (#3) which sells 21k, and Crush (#8), which sells 15k, while Brave isn’t in the Top 750, but does almost 12k copies sold.
Jimmy Patterson is a kid’s book imprint for James Patterson (go figure), and they have two volumes of adaptations of Jacky Ha-Ha. My Life is a Joke (#5) sells almost 20k, while the self-titled Jacky Ha-Ha is #6 with about 18k sold.
None of their other imprints manage to score any titles at 10k or over.
Here’s the Long Tail of just the Western books for Hachette.
| Year | # of listed items | Percent Change | Total Unit Sold | Percent Change | Calculated Retail value | Percent Change | Av. Sale per title | Av $ per title |
| 2007 | 15 | —— | 39,181 | —— | $689,383 | —— | 2,612 | $45,959 |
| 2008 | 18 | 20.00% | 37,519 | -4.24% | $596,609 | -13.46% | 2,084 | $33,145 |
| 2009 | 18 | —— | 40,172 | 7.07% | $642,935 | 7.76% | 2,232 | $35,719 |
| 2010 | 19 | 5.56% | 160,992 | 300.76% | $3,097,996 | 381.85% | 8,473 | $163,052 |
| 2011 | 24 | 26.32% | 88,131 | -45.26 | $1,273,500 | -58.89% | 3,672 | $53,063 |
| 2012 | 28 | 16.67% | 110,897 | 25.83% | $1,565,744 | 22.95% | 3,961 | $55,919 |
| 2013 | 24 | -14.29% | 39,093 | -65.75% | $584,783 | -62.65% | 1,629 | $24,366 |
| 2014 | 32 | 33.33% | 38,853 | -0.61% | $593,667 | 1.52% | 1,214 | $18,552 |
| 2015* | 30 | -0.63% | 61,539 | 58.39% | $830,047 | 39.82% | 2,051 | $27,668 |
| 2016* | 56 | 86.67% | 81,648 | 32.68% | $1,654,511 | 99.33% | 1,458 | $29,545 |
| 2017 | 78 | 39.29% | 220,591 | 170.17% | $2,998,501 | 81.23% | 2,828 | $38,442 |
| 2018 | 203 | 260.26% | 363,575 | 64.82% | $4,541,954 | 51.47% | 1,791 | $22,374 |
| 2019 | 152 | -25.12% | 356,334 | -1.99% | $4,469,594 | -1.59% | 2,344 | $29,405 |
| 2020 | 216 | 42.11% | 359,018 | 0.75% | $5,141,443 | 15.03% | 1,662 | $23,803 |
| 2021 | 261 | 20.83% | 382,223 | 6.46% | $5,411,286 | 5.25% | 1,464 | $20,733 |
And if you add the Manga from Yen, the combined total looks like this:
| Year | # of listed items | Percent Change | Total Unit Sold | Percent Change | Calculated Retail value | Percent Change | Av. Sale per title | Av $ per title |
| 2007 | 25 | —— | 52,077 | —— | $836,832 | —– | 2,083 | $33,473 |
| 2008 | 108 | 332.00% | 147,645 | 183.51% | $1,834,469 | 119.22% | 1,367 | $16,986 |
| 2009 | 229 | 112.04% | 371,134 | 151.37% | $4,340,048 | 132.78% | 1,621 | $18,952 |
| 2010 | 363 | 58.52% | 721,975 | 94.53% | $9,748,867 | 124.63% | 1,999 | $26,856 |
| 2011 | 484 | 33.33% | 852,256 | 18.05% | $11,227,466 | 15.17% | 1,761 | $23,197 |
| 2012 | 576 | 19.01% | 758,845 | -10.96% | $10,301,009 | -8.25% | 1,317 | $17,884 |
| 2013 | 678 | 17.71% | 731,473 | -3.61% | $10,300,204 | —– | 1,079 | $15,192 |
| 2014 | 808 | 19.17% | 720,988 | -1.43% | $10,579,169 | 2.71% | 892 | $13,093 |
| 2015* | 742 | -8.17% | 994,407 | 37.92% | $14,304,955 | 35.22% | 1,340 | $19,279 |
| 2016* | 849 | 14.42% | 1,153,656 | 16.01% | $17,174,718 | 20.06% | 1,359 | $20,229 |
| 2017 | 1481 | 74.44% | 1,199,553 | 3.98% | $16,865,176 | -1.80% | 810 | $11,388 |
| 2018 | 1940 | 30.99% | 1,253,803 | 4.52% | $17,593,705 | 4.32% | 646 | $9,069 |
| 2019 | 1998 | 2.99% | 1,240,930 | -1.03% | $17,477,769 | -0.66% | 621 | $8,748 |
| 2020 | 2226 | 11.41% | 1,449,020 | 16.77% | $20,939,201 | 19.80% | 651 | $9,407 |
| 2021 | 2408 | 8.18% | 3,400,677 | 134.69% | $49,107,307 | 134.52% | 1,412 | $20,393 |
Hachette has four titles over 20k, and seven others over 10k, on the Western charts.
To wrap up the Top Ten publishers of the Top 750 of the 2021 NPD BookScan, the #10 publisher is IDW Publishing which places four books for a total of 134k sold, and a bit over $2.9m in calculated dollars. For the second year in a row, they beat out both Image and Marvel in the Top 750. IDW has a lot of imprints, including Artist Editions, Black Crown, Library of American Comics, Top Shelf, Yoe Books, and, of course, IDW itself.
Top Shelf is actually the biggest source of successful books for IDW, with George Takei and Harmony Becker’s They Called Us Enemy (#1) selling 67k, which is a big surge forwards from 43k in the previous year. The late Rep. John Lewis’ March trilogy also continues to be a big hit – Book One (IDW’s #2 seller) is almost at 38k, while the Box Set of all three volumes (#3) sells about 16k. Book Two and Three don’t actually make the Top 750, but each sells right around 11k.
IDW also publishes licensed comics, and the biggest one of those (and the only one in the Top 750 is v1 of Sonic The Hedgehog (#4) with about 13k sold. The final book from IDW that sells over 10k copies (though not in the Top 750) is Marvel Action: Spider-Man: A New Beginning with almost 11k sold. I feel like it is important to note that IDW’s kids-aimed Marvel comic, much like Scholastic’s, outsells each and every Marvel comic published by Marvel. I think that’s pretty shocking, frankly.
Here is IDW’s Long Tail; they are a rare publisher in 2021 that sold fewer pieces than in 2020 (though, their Calculated Dollars was up a little):
| Year | # of listed items | Percent Change | Total Unit Sold | Percent Change | Calculated Retail value | Percent Change | Av. Sale per title | Av $ per title |
| 2007 | 233 | —— | 102,118 | —— | $2,090,647 | —– | 438 | $8,973 |
| 2008 | 335 | 43.78% | 146,125 | 43.09% | $2,766,505 | 32.33% | 436 | $8,258 |
| 2009 | 477 | 42.39% | 215,907 | 47.76% | $4,346,836 | 57.12% | 453 | $9,113 |
| 2010 | 623 | 30.61% | 161,578 | -25.16% | $3,653,680 | -15.95% | 259 | $5,865 |
| 2011 | 785 | 26.00% | 206,136 | 27.58% | $4,884,606 | 33.69% | 263 | $6,222 |
| 2012 | 937 | 19.36% | 162,599 | -21.12% | $4,329,973 | -11.35% | 174 | $4,621 |
| 2013 | 1059 | 13.02% | 180,694 | 11.13% | $4,443,372 | 2.62% | 171 | $4,196 |
| 2014 | 1134 | 7.08% | 228,895 | 26.68% | $5,309,992 | 19.50% | 200 | $4,641 |
| 2015* | 959 | -15.43% | 310,512 | 35.66% | $6,478,023 | 22.00% | 324 | $6,755 |
| 2016* | 978 | 1.98% | 343,197 | 10.53% | $8,194,098 | 26.49% | 351 | $8,378 |
| 2017 | 1639 | 67.59% | 346,368 | 0.92% | $8,278,617 | 1.03% | 211 | $5,051 |
| 2018 | 1811 | 10.05% | 279,435 | -19.32% | $6,525,696 | -21.17% | 154 | $3,603 |
| 2019 | 1817 | 0.33% | 330,051 | 18.11% | $7,443,310 | 14.06% | 182 | $4,096 |
| 2020 | 1906 | 4.90% | 527,405 | 59.80% | $12,365,146 | 66.12% | 277 | $6,487 |
| 2021 | 1979 | 3.83% | 512,757 | -2.78% | $12,723,523 | 2.90% | 259 | $6,429 |
IDW has one book over 50k, one more over 30k, and another two over 10k.
That is it for the top ten publishers, but there’s a few more publishers it’s worth singling out for attention because they have a historical importance, they are significant for either the book or comics markets, they are growing, or there is otherwise something of note about them!
Since this is a report on bookstore sales, let’s start with the last of the mainstream book world’s “Big Five”: Simon & Schuster. They manage to place four titles into this year’s Top 750, but missed the cutoff for Top Ten Publishers (They would be #14). These six titles place 90k copies, for about $1.2m in calculated dollar sales.
Simon has several imprints, including Aladdin, Atria, Atheneum, Free Press, Margaret K. Elderberry, Gallery 13, Little Simon, Pocket, Scribner, and Touchstone, though not all of those imprints made it into the Top 750.
Little Simon has Simon’s #1 book: The Coldfire Curse by Jordan Quinn, which sells almost 28k copies, and is the first volume of The Dragon Kingdom of Wrenly series. V2, Shadow Hills doesn’t make the Top 750, but still almost sells 12k copies.
Aladdin comes in at #2 with v1 of The Okay Witch by Emma Steinkellner with 24k, while v2, The Okay Witch and the Hungry Shadow is #4 with almost 16k sold.
And at #3, from the Atheneum imprint is Long Way Down by Jason Reynolds and Danica Novgorodoff which sells almost 23k.
Here is Simon & Schuster’s Long Tail, which includes the imprints that I’m aware of.
| Year | # of listed items | % Change | Total Pieces | % Change | Calculated Retail Value | % Change | Av. Sale per title | Av $ per title |
| 2007 | 12 | — | 8,317 | — | $158,014 | — | 693 | $13,168 |
| 2008 | 26 | 116.67% | 14,917 | 79.36% | $211,798 | 34.04% | 574 | $8,146 |
| 2009 | 41 | 57.69% | 109,558 | 634.45% | $1,430,544 | 575.43% | 2,672 | $34,891 |
| 2010 | 46 | 12.20% | 214,828 | 96.09% | $2,660,094 | 85.95% | 4,670 | $57,828 |
| 2011 | 62 | 34.78% | 187,531 | -12.71% | $2,383,491 | -10.40% | 3,025 | $38,443 |
| 2012 | 63 | 1.61% | 165,831 | -11.57% | $2,844,453 | 19.34% | 2,632 | $45,150 |
| 2013 | 67 | 6.35% | 258,931 | 56.14% | $4,165,350 | 46.44% | 3,865 | $62,169 |
| 2014 | 71 | 5.97% | 383,878 | 48.25% | $6,520,821 | 26.55% | 5,407 | $91,843 |
| 2015* | 75 | 5.63% | 910,341 | 237.14% | $13,386,461 | 205.29% | 12,138 | $178,486 |
| 2016* | 75 | —— | 618,922 | -32.01% | $9,477,798 | -29.20% | 8,252 | $126,371 |
| 2017 | 89 | 18.67% | 449,243 | -27.42% | $6,788,432 | -28.38% | 5,048 | $76,275 |
| 2018 | 88 | -1.12% | 38,804 | -91.36% | $739,664 | -89.10% | 441 | $8,405 |
| 2019 | 100 | 13.64% | 80,795 | 108.21% | $1,502,286 | 103.10% | 808 | $15,023 |
| 2020 | 128 | 28.00% | 93,785 | 16.08% | $1,841,672 | 22.59% | 733 | $14,388 |
| 2021 | 193 | 50.78% | 247,842 | 164.27% | $3,454,596 | 87.58% | 1,284 | $17,899 |
[Almost all of that 2018 drop was my reconsidering hybrid-prose books like Rachel Renee Russell’s “Dork Diaries” as properly being “comics”, so that was on me, not them!]
Simon & Schuster has three books over 20k, and two books over 10k this year.
While not one of the “Big Five”, there are a pair of other publishers that I would consider both “significant” as well as bookmarket-first who did well in the Top 750. In straight alphabetical: Candlewick (two placing titles in 2021), and Hyperion/Disney Press (also two)
First up is Candlewick, which places two titles, for 59k combined. The best-selling is Flora & Ulysses which is mostly prose, but does have a significant enough comics section in it to be on “this side” of the line for the category. It sells 44k copies this year, up from 28k copies the previous year. They also place a volume of Timmy Failure: Mistakes Were Made which sells almost 15k, down from 25k last round.
Here’s a Long Tail, which shows a relatively rare for 2021 decline:
| Year | # of listed items | Percent Change | Total Unit Sold | Percent Change | Calculated Retail value | Percent Change | Av. Sale per title | Av $ per title |
| 2008 | 6 | — | 5,034 | — | $56,024 | — | 839 | $9,337 |
| 2009 | 18 | 200.00% | 9,688 | 92.45% | $103,287 | 84.36% | 538 | $5,738 |
| 2010 | 24 | 33.33% | 14,857 | 53.35% | $202,687 | 96.24% | 619 | $8,445 |
| 2011 | 29 | 20.83% | 19,158 | 28.95% | $286,615 | 41.41% | 661 | $9,883 |
| 2012 | 30 | 3.45% | 15,884 | -17.09% | $221,438 | -22.74% | 529 | $7,381 |
| 2013 | 31 | 3.33% | 18,710 | 17.79% | $282,320 | 27.49% | 604 | $9,107 |
| 2014 | 28 | -9.68% | 19,780 | 5.72% | $301,845 | 6.92% | 706 | $10,780 |
| 2015* | 48 | 71.43% | 57,018 | 188.26% | $652,681 | 116.23% | 1,188 | $13,598 |
| 2016* | 39 | -18.75% | 28,318 | -50.33% | $436,806 | -33.08% | 726 | $11,200 |
| 2017 | 41 | 5.13% | 46,024 | 62.53% | $503,622 | 15.30% | 1,123 | $12,283 |
| 2018 | 51 | 24.39% | 66,313 | 44.08% | $622,460 | 23.60% | 1,300 | $12,205 |
| 2019 | 52 | 1.96% | 74,733 | 12.70% | $705,396 | 13.32% | 1,437 | $13,565 |
| 2020 | 55 | 5.77% | 90,378 | 20.93% | $993,089 | 40.79% | 1,643 | $18,056 |
| 2021 | 45 | -18.18% | 84,172 | -6.87% | $764,435 | -23.02% | 1,870 | $16,987 |
Candlewick has one book over 30k, and one more over 10k.
Disney Press / Hyperion is, like Marvel, also owned by Disney. Technically, that probably means I should fold them together like I do with the various individual companies that make up a Penguin Random House, but I resist, how I resist (largely because they are distributed completely separately). But I have to point out that once again, Hyperion/Disney Press did better than Marvel did – Hyperion would be the #15 publisher in the Top 750, while Marvel doesn’t even appear among the twenty-one pubs placing!
Hyperion has two placing titles doing 60k combined. The best-selling title is just over 42k copies of Gravity Falls: Lost Legends, but they also shift 18k copies of the adaptation of Percy Jackson: The Lightning Thief.
Here is the Long Tail, also showing a rare decline this year
| Year | # of listed items | Percent Change | Total Unit Sold | Percent Change | Calculated Retail value | Percent Change | Av. Sale per title | Av $ per title |
| 2007 | 10 | —– | 39,121 | —– | $336,771 | —– | 3,912 | $33,677 |
| 2008 | 19 | 90.00% | 41,005 | 4.82% | $409,051 | 21.46% | 2,158 | $21,529 |
| 2009 | 24 | 26.32% | 23,301 | -43.18% | $234,078 | -42.78% | 971 | $9,753 |
| 2010 | 26 | 8.33% | 30,860 | 32.44% | $314,067 | 34.17% | 1,187 | $12,080 |
| 2011 | 29 | 11.54% | 46,553 | 50.85% | $392,652 | 25.02% | 1,605 | $13,540 |
| 2012 | 31 | 6.90% | 33,105 | -28.89% | $376,735 | -4.05% | 1,068 | $12,153 |
| 2013 | 33 | 6.45% | 102,537 | 209.73% | $1,298,672 | 244.72% | 3,107 | $39,354 |
| 2014 | 38 | 15.15% | 77,045 | -24.86% | $1,015,188 | -21.83% | 2,028 | $26,715 |
| 2015* | 57 | 50.00% | 63,290 | -17.85% | $831,477 | -18.10% | 1,110 | $14,587 |
| 2016* | 36 | -36.84% | 61,730 | -2.46% | $926,504 | 11.43% | 1,715 | $25,736 |
| 2017 | 41 | 13.89% | 99,589 | 61.33% | $1,592,970 | 71.93% | 2,429 | $38,853 |
| 2018 | 54 | 31.71% | 132,623 | 33.17% | $2,228,412 | 39.89% | 2,456 | $41,267 |
| 2019 | 63 | 16.67% | 158,896 | 19.81% | $2,473,413 | 10.99% | 2,522 | $39,261 |
| 2020 | 49 | -22.22% | 149,565 | -5.82% | $2,362,499 | -4.48% | 3,052 | $48,214 |
| 2021 | 45 | -8.16% | 125,017 | -16.41% | $1,966,885 | -16.75% | 2,778 | $43,709 |
Hyperion has one book over 30k, and one more over 10k.
Outside of those bookstore-native publishers, we’ve got a couple of Direct Market-native publishers who placed titles into the Top 750. Those would be: Image Comics and Boom! Studios.
Image Comics was the #13 publisher in the NPD BookScan Top 750 this year; Image has just five titles placing within the Top 750 in 2021, which sell 111k copies. That’s just over double last year’s quantity sales, while dollars sold within the Top 750 more than tripled.
Because Image is a primarily Direct Market retailer, we’ve always built a special year-by-year chart for them in the Top 750 (Hey! I have my own biases!), and this is what Image’s performance has looked like for the last seventeen years:
| Year | # of placing titles | Unit sales | Calculated
Retail Value |
| 2003 | 1 | 2,328 | $30,148 |
| 2004 | 1 | 402 | $5,206 |
| 2005 | 3 | 8,699 | $100,236 |
| 2006 | 1 | 5,311 | $113,465 |
| 2007 | 4 | 28,349 | $344,026 |
| 2008 | 9 | 55,033 | $830,574 |
| 2009 | 11 | 78,874 | $1,210,094 |
| 2010 | 22 | 289,044 | $6,479,930 |
| 2011 | 27 | 367,265 | $8,670,917 |
| 2012 | 33 | 701,050 | $20,389,762 |
| 2013 | 38 | 651,390 | $19,371,269 |
| 2014 | 47 | 691,804 | $17,554,492 |
| 2015 | 71 | 878,262 | $22,587,672 |
| 2016 | 72 | 908,655 | $22,917,758 |
| 2017 | 52 | 556,196 | $11,092,960 |
| 2018 | 42 | 402,584 | $7,611,777 |
| 2019 | 26 | 223,569 | $5,446,399 |
| 2020 | 6 | 55,711 | $1,927,993 |
| 2021 | 5 | 111,451 | $6,863,339 |
It is a smaller number of titles this year, but the numbers in the Top 750 look way better this year because the Amazon Prime adaptation of Robert Kirkman’s Invincible was a major hit that really drove comics sales in a significant way this year.
The #1 book for Image was v1 of the $65 Invincible Compendium, which sold spectacularly at 43k sold through NPD BookScan reporters. #2 was v2 of same (23k), while #3 was v3 (20k). Then the first volume of the $40 hardcovers was #5, selling12k copies. The first volume of the cheaper paperback (Family Matters) sold one copy more than 7500, for your comparative. That stranglehold of this was solely broken up by a different Kirkman title, at #4 is v1 of the $60 The Walking Dead Compendium. In addition, v4 of TWD didn’t quite make the Top 750, but still sold a respectable almost 12k.
That’s it for Image books selling over 10k: Saga, Monstress, and Department of Truth, which would fill out any Image Top Ten, did 8-9k each – just fine by prior year’s standards (Saga was #3 in 2020 with 8200 sold, for example, and sales went up to almost 8900 this year), but no longer enough to show on the Top 750, where the cut off has risen past 12k.
Here’s what Image’s Long Tail looks like: Finally, the trend changes!
| Year | # of listed items | Percent Change | Total Unit Sold | Percent Change | Calculated Retail Value | Percent Change | Av. Sale per title | Av $ per title |
| 2007 | 438 | —— | 116,015 | —— | $2,313,477 | —– | 265 | $5,282 |
| 2008 | 515 | 17.58% | 121,001 | 4.30% | $2,445,765 | 5.72% | 235 | $4,749 |
| 2009 | 571 | 10.87% | 156,466 | 29.31% | $3,207,033 | 31.13% | 274 | $5,617 |
| 2010 | 642 | 12.43% | 359,238 | 229.59% | $8,152,806 | 254.22% | 560 | $12,699 |
| 2011 | 749 | 16.66% | 466,637 | 29.90% | $11,041,187 | 35.43% | 623 | $14,741 |
| 2012 | 868 | 15.89% | 794,419 | 70.24% | $22,797,279 | 106.47% | 915 | $26,264 |
| 2013 | 994 | 14.52% | 776,507 | -2.25% | $22,085,860 | -3.12% | 781 | $22,219 |
| 2014 | 1006 | 1.21% | 830,735 | 6.98% | $20,309,973 | -8.04% | 826 | $20,189 |
| 2015* | 842 | -16.30% | 1,070,299 | 28.84% | $26,175,438 | 28.88% | 1271 | $31,087 |
| 2016* | 876 | 4.04% | 1,187,316 | 10.93% | $28,267,847 | 7.99% | 1355 | $32,269 |
| 2017 | 1531 | 174.77% | 938,991 | -20.91% | $18,564,975 | -34.32% | 613 | $12,126 |
| 2018 | 1706 | 11.43% | 769,180 | -18.08% | $14,923,335 | -19.62% | 451 | $8,748 |
| 2019 | 1757 | 2.99% | 641,353 | -16.62% | $14,305,501 | -4.14% | 365 | $8,142 |
| 2020 | 1844 | 4.95% | 511,927 | -20.18% | $11,432,907 | -20.08% | 278 | $6,200 |
| 2021 | 1888 | 2.39% | 707,850 | 38.27% | $19,509,633 | 70.64% | 375 | $10,333 |
Image has one title over 30k, one more over 20k, and four over 10k.
Boom! Sells only single title into the Top 750 this year. Boom! uses the imprints Archaia, Boom, Boom Box, Boom Town, and Kaboom. Boom!’s biggest success is the Keanu Reeves-driven BRZRKR which sells 17k. It doesn’t make the Top 750, but Something is Killing The Children v1 sells one copy over 12k to NPD BookScan reporters. Nothing else over 10k
The Long tail for Boom!:
| Year | # of listed items | Percent Change | Total Unit Sold | Percent Change | Calculated Retail value | Percent Change | Av. Sale per title | Av $ per title |
| 2007 | 21 | —– | 10,462 | —– | $246,984 | —— | 498 | $11,761 |
| 2008 | 44 | 109.52% | 10,943 | 4.60% | $394,361 | 59.67% | 249 | $8,963 |
| 2009 | 93 | 111.36% | 25,378 | 131.91% | $485,485 | 23.11% | 273 | $5,220 |
| 2010 | 202 | 117.20% | 64,770 | 155.22% | $1,140,019 | 134.82% | 321 | $5,644 |
| 2011 | 253 | 25.25% | 75,472 | 16.52% | $1,435,514 | 25.92% | 298 | $5,674 |
| 2012 | 307 | 21.34% | 59,758 | -20.82% | $1,160,894 | -19.13% | 195 | $3,781 |
| 2013 | 347 | 13.03% | 86,637 | 44.98% | $1,650,374 | 42.16% | 250 | $4,756 |
| 2014 | 388 | 11.82% | 108,504 | 25.24% | $1,894,658 | 14.80% | 280 | $4,883 |
| 2015* | 295 | -23.97% | 126,029 | 16.15% | $2,159,071 | 13.96% | 427 | $7,319 |
| 2016* | 309 | 4.75% | 134,386 | 6.63% | $2,313,502 | 7.15% | 435 | $7,488 |
| 2017 | 633 | 104.85% | 171,133 | 27.34% | $2,983,775 | 28.97% | 270 | $4,714 |
| 2018 | 768 | 21.33% | 198,773 | 16.15% | $3,659,046 | 22.63% | 259 | $4,764 |
| 2019 | 825 | 7.42% | 228,120 | 14.76% | $4,344,256 | 18.74% | 277 | $5,266 |
| 2020 | 951 | 15.27% | 236,779 | 3.80% | $4,634,903 | 6.69% | 249 | $4,874 |
| 2021 | 1022 | 7.47% | 295,639 | 24.86% | $5,643,860 | 21.77% | 289 | $5,522 |
Boom! has two books over 10k.
After this, I am left with seven remaining books in the Top 750 that aren’t at one of the above publishers in 2021.
In sales order, then, the best-seller of this final tranche of books is led by a new “expanded” edition of The Action Bible: God’s Redemptive Story which is the Bible adapted by Sergio Cariello. This shows as a massive 102k copies sold, which is a big jump up from the 33k the “unexpanded” edition sold last year. Interestingly, the “expanded” edition is joined in the Top 750 by another 13k of the “unexpanded” edition. They appear to have exactly identical covers, and the same cover price, so that isn’t at all confusing one bit. This is published by David C Cook, which would make them the #11 publisher in the Top 750, actually, just from those two books.
The Fantastic Flatulent Fart Brothers Big Book of Farty Facts sells 21k this year, down sure from almost 38k copies the year before, but whoa still a ton of copies! It is published by Top Floor Books, and, as it is distributed by Lightning Source, this in theory makes this a print-on-demand book, which to me is kinda awesome? POD fart-driven comics outsell every single book Marvel-freaking-comics publishes, and, in fact, top their best-seller? That is mildly insane.
Selling almost 17k is GVK Godzilla Dominion. And I am sure you know that stands for “Godzilla vs Kong”. What? You didn’t know that? Well, now you do. The “Kong” portion (Kingdom Kong) doesn’t come close to cracking 10k. This is from Legendary Comics, which I genuinely think could be a legit and viable publisher if they decided what they wanted to be.
From One Peace Books, I Hear The Sunspot comes next at 14k for Limit v1, and 12k for the originally named series’ v1. V3 of Limit also beats the 10k line, if only by thirteen copies
And as the last book in this survey of the Top 750 from NPD BookScan reporters that hasn’t been mentioned above or before, we have The Loud House 3-in-1: There Will Be Chaos, which is an omnibus collection from Papercutz – this comes in a little over 12k. I keep thinking I should build a long-tail for Papercutz, but I’m genuinely not sure how much of their common ownership with NBM combines the two companies, and if I should report them together or not? I’ve not had to solve that knot yet because NBM hasn’t placed two or more books into the top 750 in my years of doing these reports as of yet – that’s my cutoff currently for building a long tail report, for what it is worth. The fourth 3-in-1 omnibus for The Loud House doesn’t make the top 750, but it does report almost 11k in sales.
One final tranche of data: There are a four final books that, while they do not place within the Top 750, did sell more than 10k copies this year. These include the self-published single volume edition of the black-and-white version of Jeff Smith’s Bone from Cartoon Books, which sells nearly 12k copies at $45 a copy for a theoretical calculated retailer sales of more than a half-million dollars. That’s a good living for eighteen-year old work that is also earning out in color editions from Scholastic.
Then Brenna Thummler’s amazing Sheets sells nearly 11k copies from Oni Press. That’s nearly double last year’s sales of 6600 copies. Given that in previous years we’ve built a long-tail for Oni, and who wants to abandon data… well, here is their long-tail….
| Year | # of listed items | Percent Change | Total Unit Sold | Percent Change | Calculated Retail value | Percent Change | Av. Sale per title | Av $ per title |
| 2007 | 125 | —— | 11,294 | —— | $141,829 | —– | 90 | $1,135 |
| 2008 | 138 | 10.40% | 21,843 | 93.40% | $320,799 | 126.19% | 158 | $2,325 |
| 2009 | 149 | 7.97% | 51,584 | 136.13% | $713,121 | 122.30% | 346 | $4,786 |
| 2010 | 156 | 4.70% | 446,791 | 866.14% | $5,882,247 | 824.86% | 2864 | $37,707 |
| 2011 | 177 | 13.46% | 162,275 | -63.68% | $2,786,438 | -52.63% | 917 | $15,743 |
| 2012 | 171 | -3.39% | 80,560 | -50.36% | $1,594,016 | -42.79% | 471 | $9,322 |
| 2013 | 195 | 14.04% | 68,140 | -15.42% | $1,401,748 | -12.06% | 349 | $7,188 |
| 2014 | 213 | 9.23% | 61,584 | -9.62% | $1,303,069 | -7.04% | 289 | $6,118 |
| 2015* | 165 | -22.54% | 65,254 | 5.96% | $1,478,997 | 11.35% | 395 | $8,964 |
| 2016* | 191 | 15.76% | 90,222 | 38.26% | $1,992,643 | 34.73% | 472 | $10,433 |
| 2017 | 283 | 48.17% | 117,950 | 30.73% | $2,847,629 | 42.91% | 417 | $10,062 |
| 2018 | 323 | 14.13% | 108,897 | -7.68% | $2,595,362 | -8.86% | 337 | $8,035 |
| 2019 | 378 | 17.03% | 129,934 | 19.32% | $2,786,185 | 7.35% | 344 | $7,371 |
| 2020 | 460 | 21.69% | 125,464 | -3.44% | $2,599,092 | -6.72% | 273 | $5,650 |
| 2021 | 513 | 11.52% | 195,328 | 55.68% | $3,782,328 | 45.52% | 381 | $7,373 |
This is followed by almost 11k copies of The Boys Omnibus v1 for Dynamite. This is down from 17k last year, but the Amazon show was still super fresh then, and this is locking in a steady, solid sales. I have also previously built a long-tail for Dynamite that I am really loath to throw away, so here it is:
| Year | # of listed items | Percent Change | Total Unit Sold | Percent Change | Calculated Retail value | Percent Change | Av. Sale per title | Av $ per title |
| 2007 | 21 | —– | 1,082 | —– | $17,861 | —– | 52 | $851 |
| 2008 | 71 | 238.10% | 7,300 | 574.68% | $138,083 | 673.10% | 103 | $1,945 |
| 2009 | 124 | 74.65% | 23,748 | 225.32% | $485,272 | 251.44% | 192 | $3,913 |
| 2010 | 177 | 42.74% | 31,194 | 31.35% | $660,904 | 36.19% | 176 | $3,734 |
| 2011 | 246 | 38.98% | 57,801 | 85.30% | $1,300,079 | 96.71% | 235 | $5,285 |
| 2012 | 288 | 17.07% | 38,798 | -32.88% | $887,083 | -31.77% | 135 | $3,080 |
| 2013 | 347 | 20.49% | 32,296 | -16.76% | $799,021 | -9.93% | 93 | $2,303 |
| 2014 | 405 | 16.71% | 31,528 | -2.38% | $788,130 | -1.36% | 78 | $1,946 |
| 2015* | 192 | -52.59% | 31,452 | -0.24% | $797,977 | 1.25% | 164 | $4,156 |
| 2016* | 174 | -9.38 | 42,280 | 34.43% | $997,956 | 25.06% | 243 | $5,735 |
| 2017 | 552 | 217.24% | 38,053 | -10.00% | $868,682 | -12.95% | 69 | $1,574 |
| 2018 | 630 | 14.13% | 50,538 | 32.81% | $1,227,967 | 41.36% | 80 | $1,949 |
| 2019 | 654 | 3.81% | 81,198 | 60.67% | $2,112,720 | 72.05% | 124 | $3,230 |
| 2020 | 682 | 4.28% | 100,008 | 23.17% | $2,735,911 | 29.50% | 148 | $4,012 |
| 2021 | 662 | -2.93% | 73,595 | -26.41% | $1,971,384 | -27.94% | 111 | $2.978 |
And as the final book that sold over 10k, as reported to NPD BookScan in 2022 (though not making the Top 750), we have The Infinity Gauntlet by Jim Starlin and George Perez (and Ron Lim) from Marvel Comics with 10,066 sold.
Oh, Marvel.
This is where I editorialize like mad.
For the first time, ever, Marvel has literally zero books within the Top 750. Here’s the chart to show it.
| Year | # of placing titles | Unit sales | Calculated
Retail value |
| 2003 | 73 | 455,553 | $8,428,962 |
| 2004 | 50 | 227,985 | $3,756,764 |
| 2005 | 26 | 153,317 | $2,459,027 |
| 2006 | 33 | 294,852 | $5,702,307 |
| 2007 | 37 | 376,918 | $7,599,057 |
| 2008 | 38 | 303,639 | $6,446,359 |
| 2009 | 34 | 226,541 | $5,019,216 |
| 2010 | 33 | 206,273 | $4,979,323 |
| 2011 | 27 | 128,364 | $3,303,496 |
| 2012 | 32 | 141,145 | $3,872,683 |
| 2013 | 39 | 187,598 | $4,229,242 |
| 2014 | 53 | 342,706 | $8,341,787 |
| 2015* | 63 | 478,076 | $10,611,981 |
| 2016* | 60 | 555,715 | $12,088,278 |
| 2017 | 50 | 378,689 | $7,840,198 |
| 2018 | 44 | 363,360 | $7,885,015 |
| 2019 | 27 | 220,845 | $4,151,908 |
| 2020 | 6 | 49,838 | $1,292,944 |
| 2021 | 0 | 0 | 0 |
The purely insane part, to me, is that two other publishers, Scholastic and IDW, each place a book licensed from Marvel into the Top 750, clearly showing there is demand for Marvel product in the Bookstore market. In fact, Marvel is literally synonymous with the very idea of “comics” for a meaningful percentage of the American population, they utterly dominated pop culture for multiple years here, and the source material of comics is actually usually better realized than the various bits stolen by the adaptations. Plus, on top of that, they have “Star Wars” (and also all of the 20th Century Fox library now) – it is absolutely incomprehensible to this observer that they are not entirely dominating the sales of western comics to adults. And yet, they can only sell a single book into the bookmarket at over 10k copies.
I remember twenty years ago, to this month, when then Marvel Editor-in-Chief Joe Quesada gave an interview to the Observer where he said about DC “I mean, they have Batman and Superman, and they don’t know what to do with them. That’s like being a porn star with the biggest dick and you can’t get it up.” And with tiny little IDW able to sell more copies of Marvel-branded product into bookstores than Marvel, it appears that Marvel is the one who now needs Viagra.
Here is Marvel’s Long Tail, and some might say, “Well, look, they had excellent year-over-year growth this time”, but I look at it a lot wider – since 2007 the overall size of the bookstore market has more than tripled (from 15.3 m books sold to 51.8m), while in that same period… Marvel is now selling nearly four thousand fewer books, with nearly four times the SKUs in the market. Meanwhile DC is selling sixty percent more books than Marvel.
| Year | # of listed items | % Change | Total Pieces | % Change | Calculated Retail value | % Change | Av. Sale per title | Av $ per title |
| 2007 | 1230 | — | 1,034,023 | — | $19,947,737 | — | 841 | $16,218 |
| 2008 | 1559 | 26.75% | 1,032,394 | -0.01% | $20,128,825 | 0.01% | 662 | $12,911 |
| 2009 | 2067 | 32.58% | 954,335 | -7.56% | $19,608,696 | -2.58% | 462 | $9,487 |
| 2010 | 2551 | 23.42% | 870,597 | -8.77% | $19,485,662 | -0.06% | 352 | $7,638 |
| 2011 | 2852 | 11.80% | 852,187 | -2.11% | $20,225,728 | 3.80% | 299 | $7,092 |
| 2012 | 3083 | 8.10% | 726,542 | -14.74% | $18,848,013 | -6.81% | 236 | $6,114 |
| 2013 | 3203 | 3.89% | 730,826 | 0.59% | $17,820,299 | -5.45% | 228 | $5,564 |
| 2014 | 3352 | 4.65% | 918,595 | 25.69% | $24,369,961 | 36.75% | 274 | $7,270 |
| 2015* | 1882 | -43.85% | 1,114,414 | 21.32% | $28,021,290 | 14.98% | 592 | $14,889 |
| 2016* | 1841 | -2.18% | 1,277,046 | 14.59% | $31,402,330 | 12.07% | 694 | $17,057 |
| 2017 | 3578 | 94.35% | 1,142,061 | -10.57% | $28,201,535 | -10.19% | 319 | $7,882 |
| 2018 | 3662 | 2.35% | 1,180,202 | 3.34% | $29,651,745 | 5.14% | 322 | $8,097 |
| 2019 | 3692 | 0.82% | 1,064,633 | -9.79% | $26,249,715 | -11.47% | 288 | $7,110 |
| 2020 | 4375 | 18.50% | 785,201 | -26.25% | $20,798,624 | -20.77% | 179 | $4,754 |
| 2021 | 5034 | 15.06% | 1,030,272 | 31.21% | $30,480,039 | 46.55% | 205 | $6,055 |
OK, last bit here. We have a pair of publishers who didn’t place anything within the Top 750, but for whom we’ve already created Long tail charts for, and I refuse to throw built data away, so to run through them quickly:
Skyhorse is another “Bookstores-first” publisher that we’ve tracked for several years… but they didn’t place anything in the Top 750 this year. Their top selling book in 2021 was an unofficial Minecraft comic which didn’t even sell 7500 copies.
| Year | # of listed items | Percent Change | Total Unit Sold | Percent Change | Calculated Retail value | Percent Change | Av. Sale per title | Av $ per title |
| 2012 | 2 | — | 180 | — | $2,331 | — | 90 | $1,166 |
| 2013 | 4 | 100.00% | 1,227 | 681.67% | $15,897 | 681.98% | 307 | $3,974 |
| 2014 | 4 | — | 458 | -62.67% | $6,191 | -61.06 | 115 | $1,548 |
| 2015* | 5 | 25.00% | 14,011 | 3059.17% | $168,332 | 2718.98% | 2,802 | $33,666 |
| 2016* | 6 | 20.00% | 51,833 | 369.95% | $622,000 | 369.51% | 8,639 | $103,667 |
| 2017 | 26 | 433.33% | 81,366 | 56.98% | $1,144,071 | 83.93% | 3,129 | $44,003 |
| 2018 | 35 | 34.62% | 87,021 | 6.95% | $1,326,292 | 15.93% | 2,486 | $37,894 |
| 2019 | 40 | 14.30% | 57,866 | -33.50% | $843,109 | -36.43% | 1,447 | $21,078 |
| 2020 | 47 | 17.50% | 64,471 | 11.41% | $866,390 | 2.76% | 1,372 | $18,835 |
| 2021 | 52 | 10.64% | 63,559 | -1.41% | $949,410 | 9.58% | 1,222 | $18,258 |
And, finally, Drawn & Quarterly‘s best-selling book in 2021 is Making Comics by Lynda Barry, which sells about 5400 copies.
| Year | # of listed items | Percent Change | Total Unit Sold | Percent Change | Calculated Retail value | Percent Change | Av. Sale per title | Av $ per title |
| 2007 | 62 | — | 24,689 | — | $500,764 | — | 398 | $8,077 |
| 2008 | 82 | 32.26% | 42,038 | 70.27% | $912,774 | 82.28% | 513 | $11,131 |
| 2009 | 107 | 30.49% | 42,957 | 2.19% | $920,014 | 0.79% | 401 | $8,598 |
| 2010 | 126 | 17.76% | 44,737 | 4.14% | $1,009,387 | 9.71% | 355 | $8,011 |
| 2011 | 145 | 15.08% | 62,286 | 39.23% | $1,399,793 | 38.68% | 430 | $9,654 |
| 2012 | 155 | 6.90% | 43,098 | -30.81% | $926,233 | -33.83% | 278 | $5,976 |
| 2013 | 189 | 21.94% | 41,887 | -2.81% | $893,905 | 3.49% | 222 | $4,730 |
| 2014 | 205 | 8.47% | 46,030 | 9.90% | $1,032,032 | 15.45% | 225 | $5,034 |
| 2015* | 219 | 6.83% | 73,471 | 59.62% | $1,680,878 | 62.87% | 335 | $7,675 |
| 2016* | 233 | 6.39% | 57,326 | -21.97% | $1,266,170 | -24.67% | 246 | $5,434 |
| 2017 | 247 | 6.01% | 68,087 | 18.77% | $1,548,813 | 22.32% | 276 | $6,271 |
| 2018 | 285 | 15.38% | 79,765 | 17.15% | $2,055,019 | 32.68% | 280 | $7,211 |
| 2019 | 303 | 6.32% | 80,084 | 4.32% | $2,112,455 | 2.79% | 264 | $6,972 |
| 2020 | 329 | 8.59% | 80,384 | 0.37% | $2,302,356 | 8.99% | 244 | $6,177 |
| 2021 | 331 | 0.61% | 80,346 | -0.05% | $1,975,217 | -14.21% | 243 | $5,967 |
Whew!
A few final bits of number-crunching for fun before we go for the year!
First and foremost: for those of you whom have actually seen a NPD BookScan chart, I’m sure you noticed that one of the columns is listed as “publishers”. I’ve never been able to understand why: that column is clearly the distributor column, with the (very very) weird exception of DC Comics. DC (and Dark Horse, and IDW, and others) are distributed by Random House in the bookstore market, not Diamond. Marvel is distributed by Hachette. Boom! and Viz are distributed by Simon, and so on. Now most analysis that I do I get fairly rigorous about going in and fixing problems, but this is a simple top level search where I’m just going to accept what it tells me without question. So who are the leaders for distribution, over the breadth of the entire NPD BookScan list? This is by pieces sold, of all 51.8 million books sold in 2021 that NPD BookScan reported. There are two hundred and four different distributors listed for books.
Turns out it looks like this in 2021:
Probably not what you pictured in your head, through your normal Direct Market-driven perceptions and reporting.
Lastly: if we look at the entirety of the 48k-long “Long Tail” NPD BookScan list, how do the publishers (all 1734 of them) stack up in 2021? This is everything, including both “east” and “west” comics, and we’ll sort it by Calculated Retail Value, and rounding everything to the nearest hundred-thousand just for ease of presentation. This is a list of any publisher on a quick sort that generated $1m or more in Calculated Dollar Sales. Please remember, just because I can calculate what the dollars should be, there is zero evidence that these books were actually sold at full retail price. Certainly, the existence of Amazon alone throws that deeply into doubt!
Scholastic is the biggest publisher in the Book stores, followed very, very closely by Viz, then distantly followed by DC and Dark Horse. Those top four publishers together are larger than the bottom 1773 publishers combined!
| #1 | VIZ MEDIA | $208.4 |
| #2 | SCHOLASTIC | $137.2 |
| #3 | KODANSHA / VERTICAL COMICS | $84.3 |
| #4 | BOOM! STUDIOS | $55.6 |
| #5 | DC COMICS | $49.7 |
| #6 | DARK HORSE | $49.2 |
| #7 | HACHETTE | $49.1 |
| #8 | MARVEL COMICS | $30.4 |
| #9 | PENGUIN RANDOM HOUSE | $30.0 |
| #10 | HARPERCOLLINS | $26.0 |
| #11 | SEVEN SEAS / GHOST SHIP | $24.7 |
| #12 | ANDREWS MCMEEL PUBLISHING | $20.5 |
| #13 | IMAGE COMICS | $19.5 |
| #14 | MACMILLAN | $19.0 |
| #15 | IDW PUBLISHING | $12.7 |
| #16 | HARRY N. ABRAMS | $6.8 |
| #17 | SQUARE ENIX MANGA | $4.3 |
| #18 | FANTAGRAPHICS BOOKS | $3.6 |
| #19 | ONI PRESS | $3.6 |
| #20 | DAVID C COOK | $3.5 |
| #21 | DISNEY – HYPERION | $2.2 |
| #22 | DRAWN & QUARTERLY | $2.0 |
| #23 | DYNAMITE ENTERTAINMENT | $2.0 |
| #24 | TITAN COMICS | $1.7 |
| #25 | ONE PEACE BOOKS | $1.3 |
| #26 | NBM / PAPERCUTZ | $1.2 |
And that’s pretty much what NPD BookScan in 2020 looks like to these eyes.
How does it look to you?
How Does The Sausage Get Made???
I like methodology, so here is entirely too much detail on what I do, and how I do it each year.
“Direct Market” stores (also known as “your Local Comics Shop”) buy much of their material for resale from Diamond Comics Distributors (though, not, by any means, all of the material your LCS has for sale – many DM stores are also buying from book-market wholesalers, or directly from publishers and have been for years). While many DM stores have Point-of-Sales (POS) systems, because our market typically buys non-returnable what we track in our side of the industry is what sells-in to the store, not what sells-through to the eventual consumer. In a very real way, this means that the DM store owner is the actual customer of the publisher, as opposed to the end consumer.
The bookstore market, however, buys their material semi-returnable, where they can send back some portion of titles that don’t sell (but not, usually, all unsold product). Because of this, sell-through is the data that is tracked and trended. Bookstores that have POS systems are able to report their sales to NPD BookScan, a subsidiary of The NPD Group (they bought it from Nielsen).
NPD BookScan tracks the specific sales to consumers through its client stores. I had several well trained spies who have, for many years, provided me with access to the NPD BookScan reports at the end of each year. However, I am very excited to say that we are now getting the NPD BookScan reports directly from The NPD Group, with no filter or middleman! This is our third year of doing so.
However, getting “official” detail has brought a major change as of last year: NPD Group no longer wants us releasing the actual data, even the pretty tight “Top 750” as has been our historical practice. I am fairly certain that, if you know how to search the internet, you could probably turn up previously published links from 2003 through 2017, but going forward, you will have to trust my abstract of the charts, rather than seeing the charts themselves. So sorry!
(For points of comparison, try these links to the earlier pieces:
2020: My Analysis
2019: My Analysis
2018: My Analysis
2017: My Analysis
2016: My Analysis
2015: My Analysis
2014: My Analysis
2013: My Analysis
2012: My Analysis
2011: My Analysis
2010: My Analysis
2009: My Analysis
2008: My Analysis
2007: My Analysis
2006: My Analysis
2005: My Analysis
2004: My Analysis
2003: My Analysis)
For some historical context, we have three “eras” of data: 2003-2005 numbers are “what is YTD sold, IF it made the chart in the last week of the year?”
2006-2016: the full “here’s everything that sold throughout the entire year”, but filtered through a leaker – almost certainly accurate, but absolutely missing some bits due to methodology changes and differences, even year-by-year. Important: in 2015 and 2016 I received lists that appeared to be lightly edited, potentially down to “books that are in print at the publisher level only” (obviously, there’s still stock out there on the shelves of stores and in warehouses that is not “in print” per se). Those two years are asterisked to reflect that!
2017-now: “Everything” sold in the calendar year, with no filter. (Though see further notes below!)
Just bear this all in mind if you compare the various “eras” against one another. These are not inherently apples-to-apples comparisons as a result! Moving forward there should be a much deeper consistency of data.
The biggest and most obvious difference when doing straight comparisons will be in the lower ends of the chart. This year, the “worst selling” book in the Top 750 is just about 12,000 copies (up massively from about 6000 copies last year) In ’03-‘05 there would be many items that didn’t have YTD sales in anything like that amount.
Also of major note is that starting in 2007, I have had the “full and entire” NPD BookScan listing, down to books that have only one copy sold YTD. However, I’ve never tried to really analyze that entire list because that’s too much data, even for a data-junkie like myself. I’ve cut the list off at 750 items because that’s what we’ve historically reported. Still, I have the deeper data, and I’ll summarize it as we go along. As long as I continue to get that much data going forward, I should be able to tell you a few things about “The Long Tail”. In 2021, I possess data on 47,631 items! (for 2020 this was 40,755 items) We’ll talk more about this later in some depth, including the methodology of how these are generated.
This is important, however: this is not a list of every book that sold through every book store – the report is limited to those stores that report to NPD BookScan. According to NPD BookScan, more than 7500 venues report to them, but this still leaves many venues that don’t.
Neilsen claimed in 2013 that approximately 85% of retail, physical book sales are tracked through them, though this number appears very much in doubt as an actionable percentage for any specific individual book. A quick internet search can find any number of cases of authors saying that NPD BookScan numbers show half or less of their royalty statements. There’s some really excellent discussion on why and by how much NPD BookScan numbers might be off right here.
NPD BookScan says “Barnes & Noble, Amazon, Costco, General Independents, Hastings, Target, BJ’s, K-Mart, Hudson Group, Meijers, Follett Books, Books-A-Million, CEO Read, Powells, Toys R Us, Shoprite, SuperValu, Sam’s Club and Walmart are among our many data providers.”
What sales do NPD BookScan not track? Among others, this would include libraries, schools, specialty stores (like comic book stores!) and book clubs and fairs. NPD BookScan does not track sales at most independent bookstores. For many books those are very very important sales channels, and thus, NPD BookScan under-reports by some potentially significant degree, and don’t, in any way, represent all physical book sales or even all “book stores” selling comic book material.
There’s also a certain amount of miscategorization going on. As an example, for for eighteen years the purely-prose novel Bloody Crown of Conan appeared on my list – though it finally disappeared in 2021! – while other books (see; Dork Diaries in a few paragraphs) might appear one year, and disappear another. I do not know what the actual extent of miscategorization might be and how it would impact any of the general data analysis! There are simply too many potential data points to possibly connect them all together in the time I have to assemble this column.
I’ve done the best I can to try and root out any items “of significance” that should be on the chart that I’m given, but are not – for example, I have to have The Complete Persepolis and Maus manually pulled for me every year because of how BISAC codes work. Because this relies on me catching these titles to get them on to the list this means there’s almost certainly comics material missing that I didn’t catch. If you can think of a book I might have missed, please email me, and I’ll try to track down the sales for it, and update my listings for the future! Even with my multiple safeguards, the datastream is too wide for me to not make mistakes. I make constant mistakes, as you’ll see further down in the body of the column.
Either way, what I’m trying to get across to you is that this really is entirely unreliable data in terms of the absolute and total number of books sold, and is only able to give the broadest possible metric of what’s happening in book stores, based upon the data-set that I’m being given, which is in no way comprehensive. I still think that’s much much better than having no information, so I persevere in writing this each year. Also, now that I am getting directly from the NPD Group, I feel much more confident that I at least know where the potential problems generally are.
Again, I want to stress that I’m doing my primary analysis on the Top 750 items: the reason for this is that is all that I was able to get in the first four years of this analysis, and otherwise the percentage changes I’m discussing will be even more wrong than they would be otherwise. The Top 750 represents more than half of the total of the full list, and has consistently for years – in 2021 the Top 750 was roughly 30.7 million books sold; the bottom forty-seven thousand-ish represents just about 21.1 million books sold. While there are significant sales below the Top 750, the Top 750 probably represents the majority of items you’d be able to “easily” find on the shelf of a bookstore in America. I’d love to analyze the full “long tail” list, but I’m afraid that this might take these little essays to triple their current size, and keeping your attention just through this seems hard enough to me! Maybe if someone paid me by the word…!
Finally, it is probably worth mentioning that although I’m analyzing primarily units sold, I also have some calculations that are purely my own of dollars that they would have been if they were sold at full retail. NPD BookScan does not report on the price that a book actually sold for, so the extrapolation of dollars that I made could be dramatically overstated. More than “could be”: it probably is… because Amazon sells so many books, often at crazy steep discounts. In no way should you take any “Calculated Retail Value” as TRUE – these are just to provide a series of benchmarks, and to help you see the impact and differences that “cover price” can make in sales.
If it was not obvious, this only counts physical books, and does not include any digital sale of any kind; it does however, include physical books sold through Amazon.
One of the things I really never talk about is how I get this data each year. I certainly don’t have a NPD BookScan account (they’re pretty expensive!), so I have historically dependent on leaks from industry sources. But this means that the methodology with which the data was generated may actually be very different from year to year. The thing is, since I don’t generate these, NPD BookScan methodology is still largely a Black Box to me. For a guy who writes these reports for 19 (!) years, I still have only really a passing knowledge of how things work. I am learning, slowly, though!
Now that the NPD Group is directly providing us data, we can assume that the methodology itself will not change going forward, yay!
A Bunch of Information about BISAC codes and how this report is generated!
Here’s where we learn a little bit about the Book Industry Standards and Communications (or “BISAC”) codes. It turns out that the publishers assign them themselves, and that publishers are allowed to assign up to four different BISAC codes per item. For example: “Diary of a Wimpy Kid” is classified as “Juvenile Fiction: Humorous Stories”; “Juvenile Fiction: Comics & Graphic Novels: General”; and “Juvenile Fiction: Social Issues: General”. But the kicker is that NPD BookScan reports will only spit out for the first BISAC listed for any given book. That is why “Diary of a Wimpy Kid” never ever showed on any of our previous reports, because the “comics” designation of the BISAC is listed second for that series! Conceptually I could also ask for “Juvenile Fiction: Humorous Stories” report, too – but that’s going to have thousands and thousands of prose-only, not-even-slightly-comics items on it, and working to cut those would quintuple the hours I spend on this (no thanks!) This is also why I have to manually ask for titles like “Maus” or “Persepolis” or “Understanding Comics” each and every year – not because they don’t contain the BISAC for comics (“CGN00xxxx” are the primary ones, for the record), but because that BISAC isn’t listed first!
Now, historically, this has really been opaque to me, to the point where I didn’t even really know what BISAC was what, but The NPD Group has been incredibly forthcoming, and I’m learning enough that I almost understand it. First and foremost, we’re now having the report generated using the codes for “Comics & Graphic Novels” (CGN), as well as the “comics” portions of “Juvenile” fiction (JUV) and nonfiction (JNF), and Young Adult Fiction (YAF) and non-fiction (YAN). Please note that the J and Y series of codes extend far past “comics”, but our search is for the narrower section. In addition to that, the NPD Group pulled records for three prominent authors that seldom showed up without intervention: Art Spiegelman, Marjane Satrapi, and Scott McCloud (As well as a small handful of books that I crosschecked against my own best sellers)
So you know, there are more than seventy-five “main” BISACs that we’re pulling in full.
Again, the publishers are the ones who assign the BISACs, and they can assign up to four per book. But reports can only generate (for now) from what the first BISAC code is listed – The NPD Group tells me they’re working on fixing that, but it’s a limitation of the current tools. That’s why they pulled by Author for Art Spiegelman – and look at how MAUS breaks down: the first individual volume has a primary BISAC of HIS022000 (“History: Jewish”), while the complete hardcover is BIO006000 (“Biography: Historical”). But the box set of the two paperbacks is BIO000000 (“Biography: General”), and METAMAUS (the book, with supporting documentation) for some reason is categorized as LIT017000 (“Literary: Comics & Graphic Novels”) which I’m not at all certain how that is different from CGN006000 (“Comics & Graphic Novels: Literary”) – but my point is that you have essentially one book that the publisher itself doesn’t really know what the “primary” BISAC should be.
There’s also more than a few dumb-ass choices, like how JUV008010 (Juvenile Fiction: Comics & GNs/Manga) features a not-even-slightly “manga” HILO by Judd Winick. These kinds of categorization problems pepper the entire database.
Additionally, only (apparently) the publishers can change BISACs, so even if I find errors year after year, it’s really very difficult to convince folks that it matters enough to devote man-hours to fixing up, even if the folks at The NPD Group agree.
If you want to learn more about the theory and practice of BISAC codes, you can go and follow this link. (It’s a trap!)
The main thing to know is that while BISAC is a pretty good system for categorizing books because it is solely in the publisher’s hands it has some pretty extreme limitations when creating reports with it as the sole basis. There is not, however, any other way to generate this data without using those limitations, to the best of my knowledge.
Either way, prior to 2017 numbers, the exact methodology from my leakers was slightly different every year and sometimes we got weird spikes and discrepancies. For example, as far as I can tell, in 2014 and prior we were always getting every book that sold one copy anywhere, then in 2015, and slightly in 2016, we’re getting a lightly edited list that only listed in-print books from some (but not all!) publishers. I put an asterisk on 2015 and 2016 because it was missing several thousand data points… But those very strongly appeared to be datapoints that may not materially affect the actual bottom-line health of dollars and pieces the charts (you’ll see this year, I think). Either way, I really must once again urge you to treat every datapoint presented here as only part of the possible picture!
Hopefully this gave you a good understanding of methodology and such!
Sponsored by Battle Quest Comics
Brian Hibbs has owned and operated Comix Experience in San Francisco since 1989, was a founding member of the Board of Directors of ComicsPRO, has sat on the Board of the Comic Book Legal Defense Fund, and has been an Eisner Award judge. Feel free to e-mail him with any comments. You can purchase two collections of the first Tilting at Windmills (originally serialized in Comics Retailer magazine) published by IDW Publishing, as well as find an archive of pre-CBR installments right here. Brian is also available to consult for your publishing or retailing program.


24,049 words gurgle
These articles always make my head hurt, in a good way.
Interesting stories coming from the numbers. I am curious if you have any plans to expand on your thoughts on DC some time. It was in a TAWM column about a year and a half ago (I think?) that you expected DC to be out of the periodical market by now. Any chance of a column expanding on why you thought this? And, if you think that conclusion is still likely, or if your thoughts have changed, and if any of their numbers above affect that thinking? Thanks for the time and effort on this article!
Fascinating stuff as usual.
(Is there a chart missing in the “A few final bits of number-crunching for fun before we go for the year!” section? There’s a line “Turns out it looks like this in 2021:” and nothing after it).
Only about halfway through but wanted to thank you for doing this every year. It’s fascinating!
Where can we see the full report. I’d like to see where anything from Archie placed, whether comics or licensed prose novels.
You can’t see a full report unless you pay NPD BookScan for access. The best-selling comic from Archie, however, is “80 Years of Christmas” and it sells well under 3k copies.
Brian – You clearly care about the business to invest your time and energy researching these numbers.
Stephen Boggs-Puckett – I don’t know if you’re referring to what I’m about to mention, but if I remember correctly in early 2021 people were making noise predicting DC wasn’t going to be printing comics after June of that year. DC never bothered to comment, and obviously kept on going. Then the topic kind of disappeared. Of course, Discovery could end up making drastic changes in the future, but that doesn’t validate the original talk.
Comments are closed.