

Sponsored by Battle Quest Comics
By Brian Hibbs
“There are three kinds of lies: Lies, Damned Lies, and Statistics”
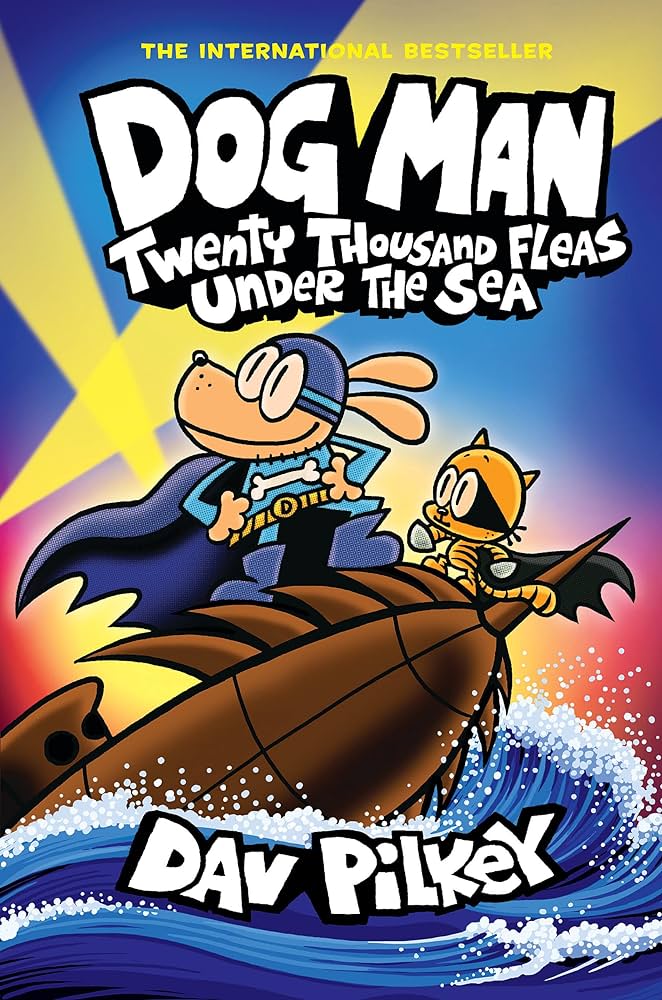
Dog Man #11 was the best selling graphic novel in North America in 2023, with more than one million units sold, as the graphic novel market in the US sagged from Pandemic highs. Units were down nearly 20% from 2022 – but it was still the third biggest year for sales ever since we started doing yearly analysis of BookScan’s sales charts.
The big picture: of the 44.7 million graphic novels sold via BookScan in 2023, nearly 21.8 million were manga (almost 49%); kids comics were approximately 17m copies (about 38%); and the remaining 5.9 million sold were primarily aimed at adults (around 13%).
EDITOR’S NOTE: Below you will find more than 28,000 words of Brian Hibbs’s invaluable analysis of 2023 BookScan numbers.
Because this can be a bit daunting, here are some insights (in my opinion) to be gleaned from it.
- Scholastic is the biggest graphic novel publisher in the US book market, and they have done it with massive, massive hits: Scholastic is 39% of the market with only 596 different titles. In the Top 750 alone, they sold a staggering 8.5 million copies of only 116 titles. Thank you Dav Pilkey and Raina, but it is also Five Nights at Freddy’s and the Wings of Fire adaptations. Scholastic makes hits.
- Marvel and DC combined are less than 10% of the book market.
- When adding up the Top 750 sales of traditional direct market publishers (Boom!, Dark Horse, DC, Dynamite, IDW, Image and Marvel) they combined for fewer than 750k books sold – 10% of what Scholastic sold.
- Marvel continued to severely underperform in the bookstore market, with their licensees having greater success – sometimes with the exact same materials. Marvel had one book in the Top 750, while Viz, Disney, Scholastic and Abrams beat every single comic Marvel itself published.
- DC had a pretty bad year, with their lowest sales since 2004 – down 25% from 2022 in the bookstore market – even with their highest ever number of titles in the total list. In 2023 they had only 14 titles in the Top 750; in 2013, ten years ago, they had 130. That is a huge and troubling drop – but maybe laying off nearly your entire sales and marketing team is not a great strategy for growth? If someone had been been making a concerted effort to dismantle DC Comics, they couldn’t have been more surgical – luckily, DC still has talented execs like Marie Javins, Jim Lee, Annie de Pies and the rest of the staff who have thwarted those plans. And from what we’re hearing, 2024 will see some more moves to reverse this concerning trend.
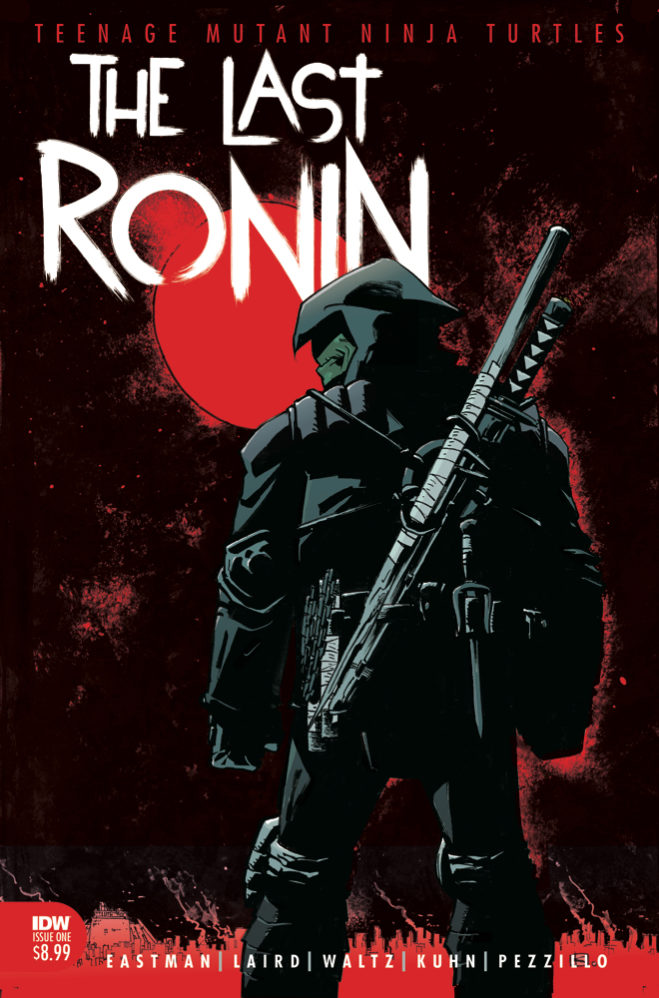
- IDW had the best year of any traditional comics publisher, borne aloft on the wings of turtles. TMNT: The Last Ronin sold an astounding 148k in its SECOND year on the chart. Talk about backlist success. Top Shelf’s beloved classics were also strong sellers: George Takei and Harmony Becker’s They Called Us Enemy sold nearly 44k this year, while March by Lewis, Aydin and Powell sold 23k of Book One (which always sells more.)
- In case you’re looking at the above as concerning (it is) don’t forget the flip side. As I was looking over this list, I was truly astounded by some of the sales totals – especially given where we started out with this 21 years ago. Even books that came out years ago are still selling. For instance, Johnnie Christmas’ NBA short-listed Swim Team sold 46,000 copies. Jerry Craft’s New Kid, despite constant bannings and controversy sold more than 75,000 copies. The most banned book in America for two years running, Gender Queer, sold 31,000 copies. And it wasn’t just controversy that sold. El Deafo by Cece Bell sold 25k copies. Thi Bui’s wonderful memoir The Best We Could Do, which came out in 2017, sold nearly 10,000 copies. That’s more than any book published by Marvel Comics. This backlist success and growth is so important. These are just a few titles that caught my eye, there are many more from other creators to take note of as you read this analysis.
- Because of this backlist strength, traditional book publishers are going in deeper and deeper with graphic novels. The sales may be mostly among kids and YA titles (and manga, with more to come) but there are dabblings in adult categories. For instance, Simon and Shuster went from 67 graphic novels published in 2013 to 367 in 2023, and just about every other publisher is going big on graphic novels.
- There are many other learnings to baken from these numbers, but that’s enough for now. Take it away Brian!
This is the twentieth-first annual report on the size and shape of the sales of graphic novels and trade paperbacks through the book store market, as seen through the prism of Circana BookScan.
There is a tremendous amount that goes into making these reports, and a whole lot of detail of how these lists get generated, but my wise editor believes that most folks just want to get to the numbers. So, if you are interested in how the sausage gets made, please go down to the bottom of the column for lots and lots of in-depth details.
I am myself a Direct Market (comic book store) retailer – while my individual focus is on book-format material, I have a lot biases, both visible and invisible that I bring to these reports. Please bear these in mind as you read my analysis! Question authority!!!
Here’s the big picture for just the Top 750 in 2023:
| Year | Total Unit | Growth | Calculated Retail Value | Growth |
| 2003 | 5,495,584 | ——- | $66,729,053 | ——– |
| 2004 | 6,071,123 | 10.5% | $67,783,487 | 1.6% |
| 2005 | 7,007,345 | 15.4% | $75,459,669 | 11.3% |
| 2006 | 8,395,195 | 19.8% | $90,411,902 | 19.8% |
| 2007 | 8,584,317 | 2.3% | $95,174,425 | 5.3% |
| 2008 | 8,334,276 | -2.9% | $101,361,173 | 6.5% |
| 2009 | 7,634,453 | -8.4% | $93,216,014 | -8.0% |
| 2010 | 6,414,336 | -15.9% | $85,266,166 | -8.5% |
| 2011 | 5,696,163 | -11.2% | $79,961,951 | -6.2% |
| 2012 | 5,438,329 | -4.53% | $89,918,354 | 12.45% |
| 2013 | 5,654,351 | 3.97% | $96,062,709 | 6.83% |
| 2014 | 6,659,031 | 17.77% | $112,768,709 | 17.39% |
| 2015* | 8,762,983 | 31.60% | $141,226,518 | 25.24% |
| 2016* | 9,967,907 | 13.75% | $159,510,075 | 12.95% |
| 2017 | 10,310,682 | 3.44% | $154,026,517 | -3.44% |
| 2018 | 11,755,903 | 14.02% | $165,885,527 | 7.70% |
| 2019 | 15,537,520 | 32.17% | $226,370,566 | 36.46% |
| 2020 | 18,245,279 | 17.43% | $274,308,460 | 21.18% |
| 2021 | 30,698,081 | 68.25% | $443,735,058 | 61.76% |
| 2022 | 31,010,409 | 1.02% | $471,444,963 | 6.25% |
| 2023 | 24,858,444 | -19.84% | $438,074,282 | -7.07% |
2023 was an interesting year! On the one hand, it would be totally honest to gnash teeth and call that almost twenty percent drop in unit sales a “plummet” – that’s the single biggest circulation drop that we have ever seen in the history of this tracking. (The 7% drop in calculated dollars is less apocalyptic – though more fictional!) BUT! If you instead understood 2021 and 2022 to be more of a pandemic-related blip, then the curve from 2019 to 2023 looks pretty positive and good. That is to say that I would read the 2023 results more as a correction to an overheated market than any sign of underlying structural weakness of the category itself.
(I want to remind you that while I asterisk 2015-2016 in terms of the sheer number of data points that I was getting was probably edited, it appears to be that the top 750 itself was fairly rock solid – there is more on this down below in the sausage making section)
The trend for print books in general (not just looking at comics) through bookstores in 2023 appears to show a general drop of 2.6%. For the first time in nine years, comics material is significantly underperforming the “general” book market. You can determine the direct relevance of this, this year.
As I discuss in the boilerplate below, I primarily write about the top 750 because a) that’s all the data I was initially leaked back in 2003, b) it’s a “manageable” chunk of data, and c) “as above, so below” – the top 750 represents about half of sales. However, since 2007, I’ve received the “entire” database, which now gives us a solid fifteen years of data to track. Sometimes we refer to this as “the Long Tail”.
Here’s what the sales of all comics sales Circana BookScan tracks in this category looks like – but, seriously, let me remind you that the parameters of the dataset changes just enough each year this can be an imprecise set of comparisons! Even putting aside “the asterisk years”, prior to 2013 this didn’t include Walmart, for just one example (of scores!) of the lack of direct one-to-one comparison.
| Year | # of listed items | Percent Change | Total Unit Sold | Percent Change | Calculated Retail Value | Percent Change | Av. Sale per title | Av $ per title |
| 2007 | 13,181 | —– | 15,386,549 | —– | $183,066,142 | —– | 1167 | $13,889 |
| 2008 | 17,571 | 24.98% | 15,541,769 | 1.00% | $199,033,741 | 8.02% | 885 | $11,327 |
| 2009 | 19,692 | 12.07% | 14,095,145 | -9.31% | $189,033,736 | -5.02% | 716 | $9,560 |
| 2010 | 21,993 | 11.68% | 12,130,232 | -13.94% | $172,435,244 | -8.78% | 552 | $7,840 |
| 2011 | 23,945 | 8.88% | 11,692,058 | -3.61% | $175,634,490 | 1.86% | 488 | $7,335 |
| 2012 | 23,365 | -2.42% | 9,562,236 | -18.22% | $164,415,366 | -6.39% | 409 | $7,037 |
| 2013 | 24,492 | 4.82% | 10,153,628 | 6.18% | $176,419,370 | 7.30% | 415 | $7,326 |
| 2014 | 26,976 | 10.14% | 11,820,324 | 16.41% | $207,598,355 | 17.67% | 438 | $7,696 |
| 2015* | 22,431 | -16.85% | 15,269,550 | 29.18% | $259,807,532 | 25.15% | 681 | $11,583 |
| 2016* | 21,295 | -5.06% | 17,302,891 | 13.32% | $293,583,180 | 13.00% | 813 | $13,786 |
| 2017 | 35,338 | 65.95% | 18,385,086 | 6.25% | $302,300,435 | 2.97% | 520 | $8,555 |
| 2018 | 38,424 | 8.73% | 19,965,469 | 8.60% | $318,345,707 | 5.31% | 520 | $8,855 |
| 2019 | 40,745 | 6.06% | 24,694,686 | 23.69% | $399,322,754 | 25.44% | 606 | $9,801 |
| 2020 | 44,316 | 8.76% | 29,251,619 | 18.45% | $480,408,257 | 20.31% | 660 | $10,841 |
| 2021 | 47,630 | 7.48% | 51,822,538 | 77.16% | $826,280,847 | 72.00% | 1088 | $17,348 |
| 2022 | 50,056 | 5.09% | 52,614,342 | 1.53% | $863,574,176 | 4.51% | 1051 | $17,252 |
| 2023 | 53,466 | 6.81% | 44,736,588 | -14.97% | $812,552,764 | -5.91% | 837 | $15,198 |
Overall, this is our Topline conclusion for the whole Circana BookScan 2023: Up almost 7% in total number books listed, while sales took a big nearly fifteen percent year-over-year drop in Units Sold; not so bad, but still meaningful, there is a 6% drop in the calculated retail value if all books sold for cover price (they didn’t, not in the “bookstore” market) – as you read through individual publisher listings, you can compare their “long tail” performance this year against those benchmarks to see if they overperformed or underperformed the market-as-a-whole.
Remember that it really is largely “hits” that drive the business – the “average” graphic novel on our charts still only sold just 837 copies, nationwide, in the entire year. Almost no one can earn a living from that – not creators, not distributors, not booksellers.
Let’s take a look at the Top 20 best-selling items*** on the 2023 chart; it looks like this:
| Long Title | Author | Publisher | YTD (Jan 01 2023 – Dec 30 2023) | |
| 1 | DOG MAN: TWENTY THOUSAND FLEAS UNDER THE SEA: A GRAPHIC NOVEL (DOG MAN #11): FROM THE CREATOR OF CAPTAIN UNDERPANTS | PILKEY, DAV | SCHOLASTIC BOOKS | 1,087,771 |
| 2 | CAT KID COMIC CLUB: COLLABORATIONS: A GRAPHIC NOVEL (CAT KID COMIC CLUB #4): FROM THE CREATOR OF DOG MAN | PILKEY, DAV | SCHOLASTIC BOOKS | 323,097 |
| 3 | CAT KID COMIC CLUB: INFLUENCERS: A GRAPHIC NOVEL (CAT KID COMIC CLUB #5): FROM THE CREATOR OF DOG MAN | PILKEY, DAV | SCHOLASTIC BOOKS | 279,045 |
| 4 | MOON RISING: A GRAPHIC NOVEL (WINGS OF FIRE GRAPHIC NOVEL #6) | SUTHERLAND, TUI T. | SCHOLASTIC BOOKS | 249,797 |
| 5 | MARY ANNE’S BAD LUCK MYSTERY: A GRAPHIC NOVEL (THE BABY-SITTERS CLUB #13) | CHENG, CYNTHIA YUAN | SCHOLASTIC BOOKS | 218,723 |
| 6 | DOG MAN: GRIME AND PUNISHMENT: A GRAPHIC NOVEL (DOG MAN #9): FROM THE CREATOR OF CAPTAIN UNDERPANTS: VOLUME 9 | PILKEY, DAV | SCHOLASTIC BOOKS | 212,889 |
| 7 | DOG MAN: MOTHERING HEIGHTS: A GRAPHIC NOVEL (DOG MAN #10): FROM THE CREATOR OF CAPTAIN UNDERPANTS: VOLUME 10 | PILKEY, DAV | SCHOLASTIC BOOKS | 205,922 |
| 8 | DOG MAN: FOR WHOM THE BALL ROLLS: A GRAPHIC NOVEL (DOG MAN #7): FROM THE CREATOR OF CAPTAIN UNDERPANTS: VOLUME 7 | PILKEY, DAV | SCHOLASTIC BOOKS | 178,885 |
| 9 | FIVE NIGHTS AT FREDDY’S: FAZBEAR FRIGHTS GRAPHIC NOVEL COLLECTION VOL. 1 (FIVE NIGHTS AT FREDDY’S GRAPHIC NOVEL #4) | CAWTHON, SCOTT | SCHOLASTIC BOOKS | 176,682 |
| 10 | THE ACTION BIBLE: GOD’S REDEMPTIVE STORY | CARIELLO, SERGIO | DAVID C COOK | 167,407 |
| 11 | DOG MAN: FETCH-22: A GRAPHIC NOVEL (DOG MAN #8): FROM THE CREATOR OF CAPTAIN UNDERPANTS: VOLUME 8 | PILKEY, DAV | SCHOLASTIC BOOKS | 154,572 |
| 12 | DEMON SLAYER: KIMETSU NO YAIBA, VOL. 1 | GOTOUGE, KOYOHARU | SIMON & SCHUSTER | 148,468 |
| 13 | TEENAGE MUTANT NINJA TURTLES: THE LAST RONIN | EASTMAN, KEVIN | RANDOM HOUSE | 148,221 |
| 14 | DOG MAN: A GRAPHIC NOVEL (DOG MAN #1): FROM THE CREATOR OF CAPTAIN UNDERPANTS: VOLUME 1 | PILKEY, DAV | SCHOLASTIC BOOKS | 143,189 |
| 15 | DOG MAN: A TALE OF TWO KITTIES: A GRAPHIC NOVEL (DOG MAN #3): FROM THE CREATOR OF CAPTAIN UNDERPANTS: VOLUME 3 | PILKEY, DAV | SCHOLASTIC BOOKS | 141,548 |
| 16 | DOG MAN: LORD OF THE FLEAS: A GRAPHIC NOVEL (DOG MAN #5): FROM THE CREATOR OF CAPTAIN UNDERPANTS: VOLUME 5 | PILKEY, DAV | SCHOLASTIC BOOKS | 140,433 |
| 17 | CHAINSAW MAN, VOL. 1 | FUJIMOTO, TATSUKI | SIMON & SCHUSTER | 140,106 |
| 18 | FIVE NIGHTS AT FREDDY’S: FAZBEAR FRIGHTS GRAPHIC NOVEL COLLECTION VOL. 2 (FIVE NIGHTS AT FREDDY’S GRAPHIC NOVEL #5) | CAWTHON, SCOTT | SCHOLASTIC BOOKS | 136,008 |
| 19 | KAREN’S BIRTHDAY: A GRAPHIC NOVEL (BABY-SITTERS LITTLE SISTER #6) | FARINA, KATY | SCHOLASTIC BOOKS | 131,303 |
| 20 | DOG MAN AND CAT KID: A GRAPHIC NOVEL (DOG MAN #4): FROM THE CREATOR OF CAPTAIN UNDERPANTS: VOLUME 4 | PILKEY, DAV | SCHOLASTIC BOOKS | 129,804 |
**Editor’s Note: The above chart is the correct one to accompany Brian’s commentary, however it should be noted that the raw data from BookScan includes Wimpy Kid #18 No Brainer at #2, Wimpy Kid #17 DIPER ÖVERLÖDE at #3 and the inevitable The Boy, The Mole, The Fox and The Horse at #4. Brian removed these borderline cases from his data and commentary. We have posted the raw data (sales figures removed) here, which does not include Brian’s edits.
Depending on your exact definitions of intended audiences, it appears that 16 of the Top Twenty is intended for children or middle readers. Of other five of the Top Twenty, two are Manga, and if you are looking for a “Marvel / DC-style superhero” comic that was generated for the Direct Market, you are looking at “Watchmen” coming in at item #305, for about 24k sold! As for Marvel? Their very first appearance isn’t until all the way down at #557 with Spider-Punk (about 12k). There are higher placing superheros – for example, Teen Titans: Robin debuts at #194, which is OGN-only and Miles Morales: Shock Waves from Scholastic had a great sophomore year, coming in at #197 (We’ll talk more about this below), placing both of those in the 30k band – but neither Marvel nor DC appear to be having much meaningful traction with pretty much anything they are publishing as contemporary periodicals.
Not a single book in the Top Twenty sells less than 130k copies – but it was 182k in 2022, so a lot of the cream is coming off the top. The combined circulation of the Top Twenty is about 4.5 million copies – that is: just over 10% of the unit sales of all 53k different graphic novels sold by BookScan reporters in 2023 (44 million copies) was being generated by just twenty books. We sure appear to be solidifying becoming a “blockbusters-driven” business.
American comics aimed at adults are now a small minority of best-sellers. Especially at the top of the charts: of the top 100, 37 are manga, a record 57 are kids books, and a mere six are American comics aimed at adults: three versions of Maus, one version of Persepolis, a volume of Lore Olympus and TMNT: The Last Ronin.
Of the “three buckets” (Manga, comics specifically aimed at YA and kids, and comics otherwise for adults) manga sells the greatest number of copies overall: of the 44.7 million graphic novels sold via BookScan in 2023, nearly 21.8m copies are Manga (almost 49%), while Kids comics are approximately 17m copies (about 38%), and the remaining 5.9 million sold are primarily aimed at adults (around 13%)
Dav Pilkey and his various series of books (Cat Kid and Dog Man) remain the current rulers of comic sales in the bookstores – he has the top three best-sellers, inclusive, and still a full half of the Top Twenty. What’s critical to remember about this is that Scholastic is also presumably selling a metric shedload of these books through the Scholastic Book Fairs, to elementary and middle school libraries, and any number of other places that don’t report to Circana BookScan. This here continues to be just the presumed tip of the iceberg.
Pilkey’s hold on the charts is very strong, if declining a smidge: The #1 best-seller (Dog Man v11: Twenty Thousand Fleas Under the Sea) sold a superlative 1.09 million copies via BookScan in 2023, a little down from the 1.3 million copies the previous volume (Dog Man v10: Mothering Heights) sold as a new release at #1 in 2021.
At #2 in 2023, Pilkey places Cat Kids v4: Collaborations with 323k sold, while Cat Kid v5: Influencers is #3, bringing in 279k sold. Pilkey then skips a few places, with his next book being #7 (Dog Man v9: Grime and Punishment – 213k), then #8 (Dog Man v10: Mothering Heights at 206k), and #9 (Dog Man v7: For Whom The Bell Rolls at 179k. He also takes spots #12 (Dog Man v8: Fetch-22 – 155k), #15 (Dog Man v1 – 143k), #16 (Dog Man v3: A Tale of Two Kitties – 142k), and #17 (Dog Man v5: Lord of the Fleas – 140k). It’s safe to say that Pilkey is a little popular!
Pilkey’s popularity is really broad – there are 68 Pilkey comics that place on the chart in 2023 (this includes Spanish translations and boxed sets and so on), with twenty-one of them in the Top 750. All combined, Pilkey sells 3.7m copies in 2023 (almost identical to 2022, for what it is worth), which amounts to just over 8.25% of all comics sold via BookScan! That’s a really really big chunk for a single author.
But the Top Twenty is not only Dav Pilkey. What first breaks his hold on the market? Why, it is more material from the Graphix imprint from Scholastic! At spot #4 is Wings of Fire v6: Moon Rising (nearly 250k!), #6 is Baby Sitters Club v13: Mary Anne’s Bad Luck Mystery (219k sold), #10 is Five Nights at Freddy’s v4 (177k sold), #19 is Five Nights at Freddy’s v5 (136k), and bringing up the rear at #20 was Baby Sitter’s Little Sister v6 at 131k. This makes a overwhelming fifteen of the Top Twenty books from Scholastic’s Graphix imprint – this is the third year in a row for that, as well.
Scholastic’s hold on the Top Twenty is not total, however, and those last five spaces get split in interesting ways. Coming in at #5 is a best-seller since it won the Pulitzer in 1992: art spiegelman’s Maus v1: My Father Bleeds History with 236k sold this year. Missing the Top Twenty, but still a forever burning rocket is the hardcover The Complete Maus: A Survivor’s Tale at #27 and 118k sold, while v2 And Here My Troubles Began is softcover is #45 with almost 95k sold. Why it sells less than half of v1 is something that I will never understand, since it is one single story, but go figure. Either way, it’s the highest placing US-produced comic intended for adults.

At #11 in the Circana BookScan chart for 2023 is The Action Bible: God’s Redemptive Story, selling 167k copies. Sergio Cariello did this adaptation of the Old Testament.
At #13 for the year is our first piece of Manga: Koyoharu Gotouge’s Demon Slayer: Kimetsu No Yaiba v1 (148k). At #14 is Teenage Mutant Ninja Turtles: The Last Ninja by Kevin Eastman & co, selling 148k copies to BookScan reporters. While at #18 is the only other Manga: Tatsuki Fujimoto’s Chainsaw Man v1, with 140k sold
There are 40 books in BookScan 2023 that sold over 100k copies – this is down meaningfully from 2022 where there were 68, but it’s also up significantly from 2020’s 22. Book #20 sold 131k in 2023, while the same position sold 182k in the previous year – about a 28% drop
I will continue to underline the fact that only one of these books (TMNT: The Last Ronin) was created “for” the traditional Direct Market audience, and that the DM (as purchased through Diamond at least) likely does a mediocre job stocking or selling most of these books – although Diamond eliminated sales reports during the pandemic so there’s not actually any way to be certain of what the DM is selling, any longer. And, to be fair, many DM stores are buying these books from non-Diamond sources (because Diamond uniformly has the worst wholesale pricing for each and every book in the Top Twenty, on top of catastrophically usurious shipping charges – though this latter issue is said to be changing come April of 2024 to a 3% flat shipping rate.)
***
How about if we sort things by author? There are 11,928 different author names on the entire Circana BookScan list for 2023. Here are the handful of people who sold more than 100k copies combined via BookScan reporters in 2023:
| 3,745,329 | PILKEY, DAV |
| 1,105,655 | FUJIMOTO, TATSUKI |
| 1,037,352 | AKUTAMI, GEGE |
| 856,045 | GOTOUGE, KOYOHARU |
| 849,745 | SUTHERLAND, TUI T. |
| 770,245 | CAWTHON, SCOTT |
| 728,148 | MIURA, KENTARO |
| 689,450 | ODA, EIICHIRO |
| 689,224 | ENDO, TATSUYA |
| 639,756 | HORIKOSHI, KOHEI |
| 545,839 | TELGEMEIER, RAINA |
| 477,837 | SPIEGELMAN, ART |
| 422,218 | GREEN, JOHN PATRICK |
| 421,664 | AIDAIRO |
| 395,269 | ITO, JUNJI |
| 394,270 | FARINA, KATY |
| 353,292 | TORIYAMA, AKIRA |
| 350,801 | OSEMAN, ALICE |
| 337,529 | ISAYAMA, HAJIME |
| 318,645 | SMYTHE, RACHEL |
| 314,799 | TARSHIS, LAUREN |
| 304,221 | PEIRCE, LINCOLN |
| 300,973 | KANESHIRO, MUNEYUKI |
| 269,994 | MATSUMOTO, NAOYA |
| 268,008 | ODA, TOMOHITO |
| 256,666 | ONE |
| 256,354 | CHUGONG |
| 236,072 | BONASTRE TUR, MĂŤRIAM |
| 233,351 | CLANTON, BEN |
| 229,729 | MARTIN, ANN M. |
| 229,353 | FGTEEV |
| 222,634 | OHKUBO, ATSUSHI |
| 220,593 | CHENG, CYNTHIA YUAN |
| 214,491 | ARAKI, HIROHIKO |
| 212,554 | ISHIDA, SUI |
| 208,340 | EASTMAN, KEVIN |
| 198,427 | HIMEKAWA, AKIRA |
| 190,298 | KISHIMOTO, MASASHI |
| 185,038 | KIRKMAN, ROBERT |
| 184,527 | CARIELLO, SERGIO |
| 183,113 | TOGASHI, YOSHIHIRO |
| 181,970 | OHBA, TSUGUMI |
| 169,003 | AKASAKA, AKA |
| 164,312 | SATRAPI, MARJANE |
| 162,544 | CRAFT, JERRY |
| 159,597 | ASAGIRI, KAFKA |
| 157,181 | KUSAKA, HIDENORI |
| 157,036 | PASCAL, FRANCINE |
| 154,746 | YANG, GENE LUEN |
| 148,170 | CHAU, CHAN |
| 147,517 | SHASKAN, STEPHEN |
| 144,418 | FUKUDA, SHINICHI |
| 143,264 | HALE, NATHAN |
| 142,679 | SIMPSON, DANA |
| 142,202 | YUKIMURA, MAKOTO |
| 140,602 | ARAKAWA, HIROMU |
| 140,133 | LIBENSON, TERRI |
| 137,135 | FURUDATE, HARUICHI |
| 135,605 | TAKEUCHI, NAOKO |
| 133,962 | MILLER, KAYLA |
| 133,700 | TABATA, YUKI |
| 130,752 | KIBUISHI, KAZU |
| 126,245 | GAIMAN, NEIL |
| 125,865 | EPSTEIN, GABRIELA |
| 124,787 | KAKU, YUJI |
| 124,397 | INOUE, TAKEHIKO |
| 121,425 | YAZAWA, AI |
| 118,631 | GALLIGAN, GALE |
| 115,318 | ASO, HARO |
| 114,251 | HUNTER, ERIN |
| 111,897 | HAYASHIDA, Q. |
| 111,228 | CRENSHAW, ELLEN T. |
| 110,580 | FLYNN, IAN |
| 109,181 | HARUSONO, SHOU |
| 108,672 | MASHIMA, HIRO |
| 106,848 | SHIRAI, KAIU |
| 106,774 | SUZUKI, YUTO |
| 103,738 | OSBORNE, MARY POPE |
| 102,501 | ASANO, INIO |
| 100,283 | KUBO, TITE |
There are only 80 authors on this list who sell 100k or more copies in 2023 These 80 represent about 56% of all BookScan reported sales in 2023.
What you can take from this is that only a tiny number of creators drive the vast majority of the business in comics (and books in general, as far as I can tell); and conversely, almost certainly this means that the numerical majority of comics published – written by the other 11,000 people trying to sell books at the same time – aren’t actually significantly profitable any given year. I think it’s further worth noting that historically US comics aimed at adults are created by paying a page rate, so that the very creation of comics could allow a living wage for their creators. Conversely, a great many of the graphic novel creators on this list are either being paid an advance-on-royalties, or in a few cases initially worked for free for the “streaming services”; or in the case of many of the Mangaka, the creative costs have already long ago been paid from the original publication in Japan. When you add together those points, along with the “average” sale of a book in the BookScan-reported market being just 837 copies in 2024, it would seem very safe to infer that most people making comics today aren’t even making US minimum wage to do so, while just a small minority of people hit the royalty targets to properly “earn out” a living.
There is potentially a lot of money in comics on the higher ends, but most creative people aren’t actually seeing much of a financial reward, because the creation of comics is extremely labor intensive and the typical circulations on most graphic novels are actually pretty low.
One other thing to consider is that quite often the actual money of comics is in an ongoing series, rather than stand alone graphic novels. If I am counting right, 48 of the 80 authors are Mangaka, and only Junji Ito is doing stand-alone books among his peers. Even on the “western” comics side, a solid majority of the names are doing multi-book series.
***
Let’s now switch our attention to looking at how publishers performed.
To make the publisher breakdowns more readable, I split the chart into “eastern” (Manga) and “western” comics, because I think there are a few clear market distinctions between those categories. So, without further ado:
2023 Manga
Here’s a year-to-year comparison chart for the Top 750:
| Year | # of placing titles | Unit sales | Calculated Retail Value |
| 2003 | 447 | 3,361,966 | $34,368,409 |
| 2004 | 518 | 4,603,558 | $45,069,684 |
| 2005 | 594 | 5,691,425 | $53,922,514 |
| 2006 | 575 | 6,705,624 | $61,097,050 |
| 2007 | 575 | 6,837,355 | $61,927,238 |
| 2008 | 514 | 5,624,101 | $53,033,579 |
| 2009 | 451 | 4,414,705 | $41,068,604 |
| 2010 | 436 | 3,117,019 | $30,212,561 |
| 2011 | 392 | 2,627,570 | $27,017,081 |
| 2012 | 367 | 1,908,186 | $21,324,368 |
| 2013 | 315 | 1,665,487 | $21,256,777 |
| 2014 | 271 | 1,748,185 | $22,601,720 |
| 2015* | 279 | 2,033,534 | $26,191,474 |
| 2016* | 311 | 2,629,366 | $35,915,488 |
| 2017 | 284 | 2,427,380 | $35,433,489 |
| 2018 | 299 | 2,641,158 | $35,955,537 |
| 2019 | 332 | 3,539,031 | $49,900,429 |
| 2020 | 358 | 5,419,328 | $77,703,520 |
| 2021 | 495 | 15,945,960 | $218,310,280 |
| 2022 | 458 | 16,905,898 | $246,052,418 |
| 2023 | 398 | 10,219,816 | $192,446,367 |
Sales and calculated dollars are solidly down for the category in 2023, but so are the number of placing books. Despite this correction, this is still the third best year for Manga in twenty-one years of tracking! Be clear, however, that calculated dollars is a pretty fictional measurement because no one anywhere knows how much any individual book is actually selling for. While it started over the pandemic, my experience as a book buyer says that manga was especially hampered by availability of product: especially the most-popular titles. At one point this was called the “North American Manga Shortage”, and also stemmed from massive paper shortages – but by 2023 this feels more like a “new normal” as it stayed continually frustrating to try and keep first volumes in stock.
As is typical with Manga, this is driven by the near-exclusive domination of series in the manga world – often when there’s not a strong anime driving sales, manga tankobon series start to perform more like periodicals than books (albeit over a wider horizon); rather than generally building a strong core backlist that sells forever, year-in-and-year out, manga tends instead to ebb and flow with culture and fashion (and especially what anime is airing currently) – Manga sales are broadly not about a specific graphic novel selling, they’re mostly about the series.
While there are 398 individual volumes of Manga placing in the Top 750 this year, those only represent 107 distinct properties. For example, the best-selling Manga this year is Demon Slayer: Kimetsu – there are a big twenty-seven different volumes of this series (or spinoffs) that place in the Top 750. The number two series, Chainsaw Man, has thirteen different editions chart. Spy X Family is #3 and has all ten volumes chart, #4 is Jujutsu Kaisen with 23 books, while number five is Berserk, with 18 entries. Just these five series are almost 25% of the volumes placing in the Top 750.
Manga, as a category, has a “long tail”, where we’re looking at all sales for the year, and not just within the Top 750 best-sellers:
| Year | # of listed items | Percent Change | Total Unit Sold | Percent Change | Calculated Retail Value | Percent Change | Av. Sale per title | Av $ per title |
| 2007 | 6231 | —— | 11,323,487 | —— | $108,770,537 | —– | 1,817 | $17,456 |
| 2008 | 7842 | 20.54% | 10,173,091 | -11.31% | $100,800,283 | -7.91% | 1,297 | $12,854 |
| 2009 | 8756 | 11.66% | 8,148,490 | -19.90% | $81,770,442 | -18.78% | 931 | $9,339 |
| 2010 | 8764 | —— | 6,239,725 | -23.42% | $67,092,668 | -17.95% | 712 | $7,655 |
| 2011 | 8991 | 2.59% | 5,690,327 | -8.80% | $62,810,728 | -6.38% | 633 | $6,986 |
| 2012 | 6332 | -29.57% | 3,510,057 | -38.32% | $40,943,613 | -34.81% | 554 | $6,466 |
| 2013 | 7024 | 10.93% | 3,516,208 | 0.01% | $44,651,823 | 9.06% | 501 | $6,357 |
| 2014 | 7452 | 6.09% | 3,914,385 | 11.32% | $51,557,925 | 15.47% | 525 | $6,919 |
| 2015* | 4412 | -40.79% | 4,580,434 | 17.02% | $62,253,624 | 20.75% | 1,038 | $14,110 |
| 2016* | 4968 | 12.60% | 5,821,892 | 27.10% | $81,314,479 | 30.62% | 1,172 | $16,368 |
| 2017 | 10,248 | 106.8% | 5,865,412 | 0.75% | $85,581,224 | 5.25% | 572 | $8,351 |
| 2018 | 10,839 | 5.77% | 6,100,260 | 4.00% | $87,421,299 | 2.15% | 563 | $8,065 |
| 2019 | 9928 | -8.40% | 7,461,077 | 22.31% | $110,577,066 | 26.49% | 752 | $11,138 |
| 2020 | 12,423 | 25.13% | 10,766,492 | 44.30% | $161,611,294 | 46.15% | 867 | $13,009 |
| 2021 | 13,006 | 4.69% | 27,717,479 | 157.44% | $396,260,629 | 145.19% | 2,131 | $30,468 |
| 2022 | 14,595 | 12.22% | 29,593,184 | 6.77% | $438,873,124 | 10.75% | 2,028 | $30,070 |
| 2023 | 14,869 | 1.88% | 21,847,240 | -26.17% | $381,166,290 | -13.15% | 1,469 | $25,637 |
Title count slowed down dramatically, with only 1.88% more titles being available, but unit sales dropped considerably now that we’re “post-pandemic”, losing more than a quarter of volume in 2023 – but sales would have to cut in half to get back to where things were in 2020, so Manga is still doing fine, thanks! And calculated dollars (which is pretty much fiction), are down by much less, showing the strength of more expensive editions, including hardcovers and “3-in-1” editions.
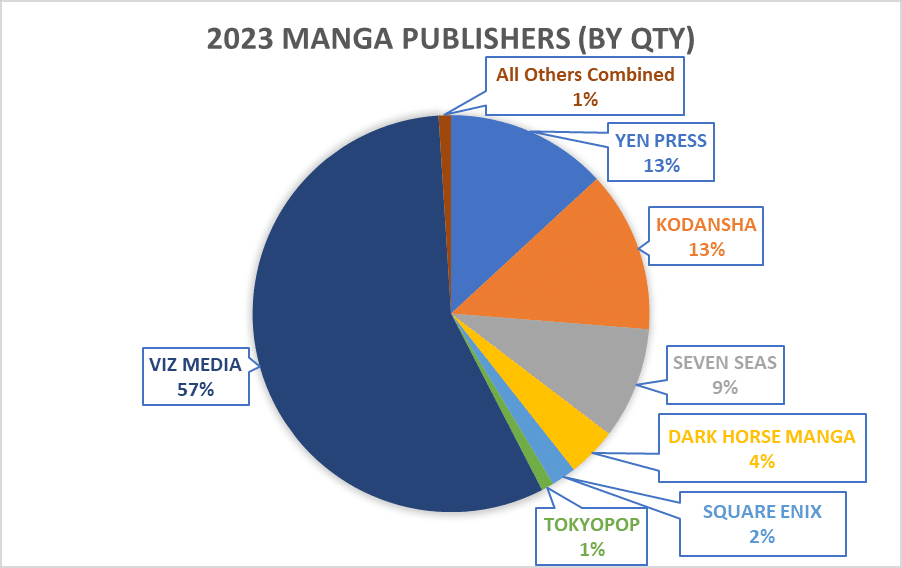
When you start breaking down the manga portion of the chart by publisher, there’s really not any contest at all: there’s a two-ton gorilla, and then a bunch of smaller houses struggling in their shadow. This chart represents all 14,869 books that are “manga” in Circana BookScan in 2023, by quantity sold, and represents the entire “long tail” of the charts:
Viz is unquestionably the dominant player, selling 57% of all manga sold in 2023. This is down a smidge from 60% the previous year
If we look solely within the Top 750, the picture is very similar: The #1 publisher is Viz who takes 253 of the 398 manga spots in the Top 750, keeping them as the overwhelmingly dominant player with almost two thirds of the placing titles! Within the Top 750, Viz (and their Yaoi sub-imprint of Sublime) charted about 7.2 million pieces, for more than $125 million in calculated retail dollars.
Viz controls the manga charts as they have for a very long time now. It is nearly impossible to envision anyone really challenging them substantially for that role because they are more than four times the size than their nearest competitors in the segment.
Viz’s #1 Best-seller is Demon-Slayer: Kimetsu No Yaiba, and v1 is the year’s best-selling manga with just over 148k sold., Additionally, all 23 released volumes make the Top 750, as well as the Boxed Set of those 23, and three spin-off series – together, those 27 volumes sell 928k copies.
Viz’s #2 selling book in the Top 750 is Chainsaw Man – v1 is the #2 book, with 140k sold, two additional volumes in the Top Ten (v12 is #6 with 99k sold, and v2 at #10 with 86k sold), and all thirteen released volumes (and a boxed set) are in the Top 750, with combined sales of nearly 933k.
Spy X Family is Viz’s #3 book on 2023’s charts, with three volumes placing in their top ten (v1 shifts 129k, while v9 is #7 with 94k, and v2 is #9 with 87k sold). As with the previous, all eleven books place with the Top 750, for a combined 676k sold.
Jujutsu Kaisen comes in at #4 for Viz with v1 selling 128k, and v0 just under it at #5 and 102k sold. Twenty-two volumes of this series (and a boxed set) all make the top 750, with just a bit over a million copies sold in total.
The last unique title placing in Viz’s Top Ten, at #8 is My Hero Academia with v1 shifting 94k copies. “Only” 19 of the total volumes place within the Top 750 in 2023 (v1-7, v28-36, a box set of 1-20, and v1 and v3 of “Team Up Missions”) for 555k sold in the Top 750.
MHA is a great example of “The Hammock Principle.” Briefly stated, this is books in a series that generally sell in a sales pattern that looks like a hammock if you chart it out: the first few volumes and the last few volumes sell the best, with the ends running down into the middle volumes which have the lowest sales, like the sagging part of a hammock. The problem with this is both that stores don’t have infinite rack space, as well as publishers that need a certain volume and velocity to keep things in print, so that sagging middle becomes unsustainable for most series over time, and many stores start to only carry the first and last few volumes. In the case of MHA, v1 sold 93k, while v33 (the highest volume with nearly the full 2023 on sale) sold nearly 76k, while v18 represents the bottom of the “hammock” with just a handful over 4k sold. That’s a pretty massive gap in sales that is running down the hammock, and shows just how hard it is for retail stores to carry every volume in a series so wide.
Other strong series for Viz outside of their Top Ten include One Piece, where v103 (!!) sells an impressive 71k while the 3-in-1 omnibus v1 does almost 55k, Kaiju No. 8 where v5 moves 52k copies, and Spider-Man: Fake Red sells a bit over 50k. That one is more impressive when you consider the best selling comic Marvel itself can sell is just 12k copies of Spider-Punk – less than a quarter of Viz’s manga. There will be more on this topic a few pages down when we get to the ”western” comics! Finally, though it misses 50k by just six copies sold, I think it is worth mentioning Junji Ito’s Uzumaki because it was so close to that threshold. All-in-all Viz sells a big 37 individual books over 50k copies. That’s better than virtually everyone.
For Viz’s Yaoi imprint, Sublime, the best-seller is 17k copies of v7 of Given, followed fairly closely 15k copies of v1 of The Dragon’s Betrothed.
Shall we take a look at the “long tail” of Viz? This is their sales of all products sold for the entire year, whether or not it made the Top 750
| Year | # of listed items | Percent Change | Total Unit Sold | Percent Change | Calculated Retail Value | Percent Change | Av. Sale per title | Av $ per title |
| 2007 | 2018 | —— | 6,249,324 | —— | $55,123,347 | —– | 3,097 | $27,316 |
| 2008 | 2447 | 21.26% | 5,536,286 | -11.41% | $50,311,791 | -8.97% | 2,263 | $20,561 |
| 2009 | 2793 | 14.14% | 4,819,407 | -12.95% | $44,310,790 | -11.93% | 1,726 | $15,865 |
| 2010 | 3088 | 10.56% | 3,576,671 | -25.79% | $35,041,305 | -20.92% | 1,158 | $11,348 |
| 2011 | 3393 | 9.88% | 3,276,297 | -8.40% | $32,766,960 | -6.49% | 966 | $9,657 |
| 2012 | 3518 | 3.68% | 2,099,560 | -35.92% | $22,433,721 | -31.54% | 597 | $6,377 |
| 2013 | 3636 | 3.35% | 1,853,211 | -11.73% | $21,586,923 | -3.77% | 510 | $5,937 |
| 2014 | 3765 | 3.55% | 1,855,161 | 0.11% | $22,732,074 | 5.30% | 493 | $6,038 |
| 2015* | 2264 | -39.87% | 2,150,656 | 15.93% | $28,134,971 | 23.77% | 950 | $12,427 |
| 2016* | 2405 | 6.23% | 2,811,978 | 30.75% | $38,854,681 | 38.10% | 1,169 | $16,156 |
| 2017 | 4443 | 84.74% | 2,958,351 | 5.21% | $41,594,729 | 7.80% | 666 | $9,362 |
| 2018 | 4637 | 4.37% | 3,184,274 | 7.64% | $44,423,434 | 6.80% | 687 | $9,580 |
| 2019 | 4702 | 1.40% | 4,329,369 | 35.96% | $60,817,993 | 36.91% | 921 | $12,934 |
| 2020 | 4856 | 3.28% | 6,614,179 | 52.77% | $94,768,000 | 55.82% | 1,362 | $19,516 |
| 2021 | 5183 | 6.73% | 15,804,613 | 138.95% | $208,440,832 | 119.95% | 3,049 | $40,216 |
| 2022 | 5270 | 1.68% | 17,816,487 | 12.73% | $233,268,459 | 11.91% | 3,381 | $44,263 |
| 2023 | 5200 | -1.33% | 12,292,894 | -31.00% | $205,326,626 | -11.98% | 2,364 | $39,486 |
Despite being down in 2023, Viz’s long-tail is still pretty impressive. They marginally cut SKUs, and while they lost a straight 31% of circulation, calculated retail is only down by 12% – that seems pretty OK to me, given that a post-pandemic crash was utterly predictable. Viz in 2023 has five books over 100k, 32 more over 50k, another thirty-eight over 30k, an additional fifty-five over 20k, and an impressive one hundred and six others over 10k. They are a very very very strong publisher in short, and they completely blow past the scales we’ve invented to describe most other publishers.

In second place among manga publishers in 2023 is Yen Press, which rises up a place and places 56 titles into the Top 750, for about 1.1 million copies sold, and $17.4 million of calculated retail gross. Yen is a division of Hachette (more on them later).
Yen’s biggest hit in 2023 is Solo Leveling, which actually comes from its Korean comics sub-imprint called Ize Press (this is technically “Manwha”, rather than “Manga” if you want to split hairs) that began this year. V1 of Solo Leveling is Yen’s #1 book, with 57k sold. It is also #4 (v6, 52k), #7 (v7, 34k), and #9 (v2, 32k), while v3-5 are all close below, still in Top Twenty, between 24-26k each) – all seven entries sum up to 251k total.
Coming in at #2, from the core Yen Press, is Toilet-Bound Hanako-Kun, which takes four of their ten best-selling spots. V1 (their #2 best-seller) sells 54k copies in 2022, while v17 (#5) pulls in 38k, v2 (#6) sells 35k, while v3 (#8) racks up 32k. While not in the Top Ten, all 19 volumes of this series (plus a v0), appear within the BookScan Top 750, for a total of 407k sold.
Also from the core Yen is [Oshi No Ko], where v1 is #3 for them, with 53k sold, and v2 is #10 with 30k sold. V3 & 4 are also in the BookScanTop 750, for a total sold of this series of 113k
That’s it for the Top Ten for Yen, but there are a few other titles to flag: Ize’s Villains are Destined to Die (v1 sells 27k, v2 does 22k, v3 does 16k), The Remarried Empress (v1 does 18k), The World After The Fall (v1 sells 16k), and My Gently Raised Beast (v1 does 14k) – all pretty strong sales for a new imprint. On the Yen-proper side: Bungo Stray Dogs (v1 does 20k), The Summer Hikaru Died (v1 does 17k), and a new edition of Fruits Basket (v1 does 16k).
In the Long Tail Yen things show solid growth
| Year | # of listed items | Percent Change | Total Unit Sold | Percent Change | Calculated Retail Value | Percent Change | Av. Sale per title | Av $ per title |
| 2007 | 10 | —— | 12,896 | —— | $147,449 | —– | 1,290 | $14,745 |
| 2008 | 90 | 800.00% | 110,126 | 753.95% | $1,237,860 | 739.52% | 1,224 | $13,754 |
| 2009 | 211 | 134.44% | 330,962 | 200.53% | $3,697,113 | 198.67% | 1,569 | $17,522 |
| 2010 | 344 | 63.03% | 560,983 | 69.50% | $6,650,871 | 79.89% | 1,680 | $19,334 |
| 2011 | 460 | 33.72% | 764,125 | 36.21% | $9,953,966 | 49.66% | 1,661 | $21,639 |
| 2012 | 548 | 19.13% | 647,948 | -15.20% | $8,735,264 | -12.24% | 1,182 | $15,940 |
| 2013 | 654 | 19.34% | 692,380 | 6.86% | $9,715,421 | 11.22% | 1,059 | $14,855 |
| 2014 | 776 | 18.65% | 682,135 | -1.48% | $9,985,502 | 2.78% | 776 | $12,868 |
| 2015* | 649 | -16.37% | 917,620 | 34.52% | $13,248,445 | 32.68% | 1,414 | $20,414 |
| 2016* | 793 | 22.19% | 1,072,008 | 16.82% | $15,520,207 | 17.15% | 1,352 | $19,572 |
| 2017 | 1403 | 76.92% | 928,962 | -13.34% | $13,866,675 | -10.65% | 662 | $9,884 |
| 2018 | 1737 | 23.81% | 890,228 | -4.17% | $13,051,751 | -5.88% | 513 | $7,514 |
| 2019 | 1846 | 6.28% | 884,596 | -0.63% | $13,008,175 | -0.33% | 479 | $7,047 |
| 2020 | 2010 | 8.88% | 1,090,002 | 23.22% | $15,797,758 | 21.44% | 542 | $7,860 |
| 2021 | 2147 | 6.82% | 3,018,454 | 176.92% | $43,696,021 | 176.60% | 1,406 | $20,352 |
| 2022 | 2297 | 6.99% | 3,224,346 | 6.82% | $47,913,494 | 9.65% | 1,404 | $20,859 |
| 2023 | 2657 | 17.20% | 2,870,543 | -10.97% | $44,600,600 | -6.91% | 1,080 | $16,786 |
Yen Press in 2023 has a dip, but is generally outperforming the wider manga market. They have four books over 50k, six more over 30k, another seven selling over 20k copies, and thirty-five more that place over 10k. This is a solid performance.
Coming in at #3 for Manga in 2023 we have Kodansha Comics. (They also publish as Vertical, which they completed purchase of in 2020), which falls a slot while placing only 37 titles within the top 750, with just under 805k in units sold, and $12.8 million in calculated retail dollars.
Kodansha’s licenses formerly were both the original backbone of Tokyopop, as well as being the majority of Del Rey Manga. Kodansha pulled Tpop’s license in March of ’09 and Del Rey in October of ’10. You may want to look at those publisher’s listings below to get a better historical overview.
Kodansha’s #1 best-seller in 2023 was Blue Lock, which placed v1 (#1, selling 70k), within the BookScan Top 750 v2 (#3, 45k), v5 (#6, 37k), v3 (#7, 34k), v4 (#8, 33k), and v6 (#10, 27k). v7-9 are also in the top 750, all volumes selling 297k combined.
At #2 for Kodansha, it’s Attack on Titan, where the 3-in-1 “Omnibus” v1 sells 46k, while the stand-alone v1 is #5 with 38k sold. This is a pretty big drop for AoT, where v1 sold 88k last year, and 170k in 2021! There are four more AoT volumes in the Top 750 (a box set selling 2k, v2 of the Omnibus selling just under that, v34 with 15k, and v2 with 12k), but the bloom seems to be off the rose with the 97 combined volumes of AoT (and spinoffs!) selling just 351k copies total – this was 800k in 2022.
Also within the Top Ten for Kodansha is Sailor Moon (v1 is #4 with 42k sold), and Vinland Saga (v1 is #9 with 27k sold)
The best-seller of the Vertical imprint is v1 of The Complete Chi’s Sweet Home, which sells almost 24k, a nice raise from last year’s 17k.
Also worthy of flagging (though not in the Top Ten) are Witch Hat Atelier (v1 sells 21k), Miraculous: Tales of Ladybug & Cat Noir (v1 sold just under 21k, and PTSD Radio, where Omnibus 1 moved 16k.
These Long Tail figures are for Kodansha-published titles, and they reflect that Kodansha, itself, first started publishing in 2010. I have adjusted the figures from 2011 on to now include Vertical as well:
| Year | # of listed items | Percent Change | Total Unit Sold | Percent Change | Calculated Retail Value | Percent Change | Av. Sale per title | Av $ per title |
| 2010 | 9 | —— | 13,291 | —— | $322,717 | —— | 1,477 | $35,857 |
| 2011 | 192 | 2033.33% | 246,083 | 1751.50% | $3,236,474 | 902.88% | 1,282 | $16,857 |
| 2012 | 364 | 89.58% | 369,853 | 50.30% | $4,697,856 | 45.52% | 1,016 | $12,906 |
| 2013 | 479 | 31.59% | 563,460 | 52.35% | $7,427,739 | 58.11% | 1,176 | $15,507 |
| 2014 | 629 | 31.32% | 904,610 | 60.55% | $11,972,992 | 61.19% | 1,438 | $19,035 |
| 2015* | 617 | -1.91% | 965,519 | 6.73% | $12,894,698 | 7.70% | 1,565 | $20,899 |
| 2016* | 772 | 25.12% | 1,154,178 | 19.54% | $15,527,849 | 20.42% | 1,495 | $20,114 |
| 2017 | 1164 | 50.78% | 1,098,812 | -4.80% | $16,795,188 | 8.16% | 944 | $14,429 |
| 2018 | 1399 | 20.19% | 1,033,780 | -5.92% | $15,396,607 | -8.33% | 739 | $11,005 |
| 2019 | 1564 | 11.79% | 1,152,720 | 11.51% | $18,674,181 | 21.29% | 737 | $11,940 |
| 2020 | 1740 | 11.25% | 1,548,349 | 34.32% | $24,524,651 | 31.33% | 890 | $14,095 |
| 2021 | 1975 | 13.51% | 5,655,992 | 265.29% | $84,299,372 | 243.73% | 2,864 | $42,683 |
| 2022 | 2255 | 14.18% | 4,289,828 | -24.15% | $69,249,595 | -17.85% | 1,902 | $30,709 |
| 2023 | 2473 | 9.67% | 2,836,059 | -33.89% | $49,758,602 | -28.15% | 1,147 | $20,121 |
Kodansha is in a bad state of decline at the moment – second straight year of decline, and 2023 is about 50% under 2021, owies. Much of this is still the receding tide from Attack on Titan, but they need some new hits. Kodansha has one book selling over 50k, seven more over 30k, nine others over 20k, and eighteen more titles that sell over 10k – that Yen has now topped them, and that they’re strongly trending lower than the Manga market as a whole is a concerning turn.
Rising up to #4 manga publisher in the Top 750 in 2023 is Dark Horse. They place twenty titles in the Top 750, whose combined sales represent 651k copies sold and $29.1m in calculated retail.
The strength of Dark Horse’s position is almost entirely Berserk with the $50 hardcover editions outselling the cheaper softcovers: 18 of Dark Horse’s placing books are Berserk. The HC of v1 (#1 for Dark Horse) scores 116k sold, which is a great number, especially for a $50 book! V2 (#2) sells 59k, and v3 (#3) racks 45k. Then the softcover of v1 jumps back in at #4 (39k) for a little palette cleanser before we drop back to the hardcovers again with v4 (#5, 39k), v13 (#6, 38k), v5 (#7, 38k), v12 (#8, 31k), v6 (#9, 31k), and v7 (#10, 28k), there are eight more volumes in the Top 750, and others that don’t make the top of the chart, and altogether there are fifty-seven volumes of Berserk listed on BookScan that collectively sold 728k copies in 2023. This is down a little from last year’s 799k.
Other than Berserk, Dark Horse also does well with Mob Psycho 100 and Hellsing Deluxe where v1 of each sells 13k (within 100 copies of one another).
Looking at the Long Tail, this is what Dark Horse’s (manga only!) recent performance looks like – like most manga in 2023 it declined, though not as much as many others. There is much more on Dark Horse down below in the “Western Publishers” section.
| Year | # of listed items | Percent Change | Total Unit Sold | Percent Change | Calculated Retail Value | Percent Change | Av. Sale per title | Av $ per title |
| 2007 | 341 | —— | 249,943 | —— | $3,329,464 | —– | 733 | $14,745 |
| 2008 | 420 | 23.17% | 248,981 | -0.38% | $3,176,870 | -4.58% | 593 | $7,564 |
| 2009 | 455 | 8.33% | 226,497 | -9.03% | $2,915,693 | -8.22% | 498 | $6,408 |
| 2010 | 473 | 3.96% | 194,494 | -14.13% | $2,633,077 | -9.69% | 411 | $5,567 |
| 2011 | 497 | 5.07% | 189,329 | -2.66% | $2,602,230 | -1.17% | 381 | $5,236 |
| 2012 | 493 | -0.80% | 112,373 | -40.65% | $1,631,038 | -37.32% | 228 | $3,308 |
| 2013 | 521 | 5.68% | 103,538 | -7.86% | $1,678,563 | 2.91% | 199 | $3,222 |
| 2014 | 559 | 7.29% | 100,894 | -2.60% | $1,617,251 | -3.65% | 180 | $2,893 |
| 2015* | 303 | -45.80% | 135,444 | 34.24% | $2,238,167 | 38.39% | 447 | $7,387 |
| 2016* | 225 | -25.74% | 174,298 | 28.69% | $2,291,355 | 2.38% | 775 | $10,184 |
| 2017 | 527 | 234.22% | 238,089 | 36.60% | $3,795,506 | 65.64% | 452 | $7,202 |
| 2018 | 531 | 0.76% | 224,010 | -5.91% | $3,579,135 | -5.70% | 422 | $6,740 |
| 2019 | 384 | -27.68% | 329,034 | 46.88% | $7,280,058 | 103.40% | 857 | $18,958 |
| 2020 | 472 | 22.92 | 430,762 | 30.92% | $11,111,354 | 52.63% | 913 | $23,541 |
| 2021 | 431 | -8.69% | 1,009,527 | 134.36% | $26,954,363 | 142.58% | 2,342 | $62,539 |
| 2022 | 455 | 5.57% | 1,113,260 | 10.28% | $39,082,966 | 45.00% | 2,447 | $85,897 |
| 2023 | 361 | -20.66% | 949,746 | -14.69% | $34,938,276 | -10.60% | 2,631 | $96,782 |
What’s interesting here is the 21% drop in number-of-books on sale, but that pieces are only down by 15%, and dollars by 10%. This also yielded the only Average-Sales and Average-Dollars per-title numbers that went up year-over-year! But, let’s be real: this is almost solely about Berserk right now: 728k sold of the 950k this year were Berserk! Dark Horse Manga has one book over 100k, one more over 50k, seven more over 30k, another seven over 20k, and four more books over 10k. As long as they keep the license for Berserk, Dark Horse Manga seems in pretty good shape.
Falling a little to the #5 manga publisher as represented by the Circana BookScan Top 750 is Seven Seas, which places nineteen titles for 232k copies sold combined and a calculated value that comes out just under $4.9 million.
Seven Seas also includes imprints Ghost Ship and Steamship, though neither imprint places anything in the Top 750 this year.
Seven Seas’ biggest success in 2023 is the Omnibus editions of Tokyo Revengers: v1 (#1) sells almost 17k, while v4 (#5) is at 14k.
Filling out the Top Ten for Seven Seas is Dai Dark (v1 is #2, and also almost 17k), Killing Stalking (v2 is #3, at 14k), Grandmaster of Demonic Cultivation (v2 is #4, also 14k), The Titan’s Bride (v2 is #6 at 13k, while v1 is #10 with 11k), Love is an Illusion (v2 is #7 and 12k), the hardcover version of The Girl From The Other Side: Siúil A Rún (v1 is #8 at 12k), and Who Made Me a Princess (v1 is #9, a bit under 12k). It’s pretty unusual to have that many v2s selling better than v1s!
The best-seller for the Ghost Ship imprint is Darling in the Franxx at under 9k
Seven Seas’ Long Tail shows another “best year ever”!
| Year | # of listed items | Percent Change | Total Unit Sold | Percent Change | Calculated Retail Value | Percent Change | Av. Sale per title | Av $ per title |
| 2007 | 54 | —— | 50,641 | —— | $558,450 | —– | 938 | $10,342 |
| 2008 | 76 | 41.74% | 80,112 | 58.20% | $833,667 | 49.28% | 1,054 | $10,969 |
| 2009 | 97 | 27.63% | 74,967 | -6.42% | $807,666 | -3.12% | 773 | $8.326 |
| 2010 | 93 | -4.12% | 75,764 | 1.06% | $875,612 | 8.41% | 815 | $9,415 |
| 2011 | 118 | 26.88% | 116,360 | 53.58% | $1,426,618 | 62.93% | 986 | $12,090 |
| 2012 | 151 | 27.97% | 124,262 | 6.79% | $1,684,994 | 18.11% | 823 | $11,159 |
| 2013 | 223 | 47.68% | 204,419 | 64.51% | $2,942,608 | 74.64% | 917 | $13,196 |
| 2014 | 300 | 34.53% | 284,484 | 39.17% | $3,979,338 | 35.23% | 948 | $13,264 |
| 2015* | 304 | 1.34% | 374,715 | 31.72% | $5,177,568 | 30.11% | 1,233 | $17,031 |
| 2016* | 417 | 37.17% | 491,947 | 31.29% | $6,960,634 | 34.44% | 1,180 | $16,692 |
| 2017 | 554 | 32.85% | 478,336 | -2.77% | $6,801,527 | -2.29% | 863 | $12,277 |
| 2018 | 906 | 63.54% | 667,556 | 39.56% | $9,511,591 | 39.84% | 737 | $10,498 |
| 2019 | 1049 | 15.78% | 671,362 | 0.57% | $9,498,329 | -0.14% | 640 | $9,055 |
| 2020 | 1230 | 17.25% | 699,127 | 4.14% | $9,913,480 | 4.37% | 568 | $8,060 |
| 2021 | 1518 | 23.41% | 1,590,317 | 127.47% | $22,972,596 | 131.73% | 1,048 | $15,133 |
| 2022 | 2031 | 33.79% | 1,967,627 | 23.73% | $30,001,482 | 30.60% | 969 | $14,472 |
| 2023 | 2539 | 25.01% | 1,995,404 | 1.41% | $32,251,267 | 7.5% | 786 | $12,702 |
Seven Seas has eighteen titles that sell more than 10k, but that’s it. You can see why I said we have to judge Viz on a different scale than everyone else. On the other hand, they are the rare Manga publisher here whose year-over-year sales went up. And that ain’t nothing!
Maintaining their #6 placement is relatively new imprint Square Enix Manga – they launched in late 2019. And, largely because they’re so young, they’re in their growth phase now, and also show “up” in their long tail! This year within the Top 750, they place thirteen titles that combine for 204k sold, and just over $3 million in calculated dollars.
Square Enix’s best seller is My Dress-Up Darling, which takes six of the top ten. V1 (#1) sells 27k while the other five all sell between 12 and 21k. This is broken by My Happy Marriage, with v1 at #4 (19k), v2 at #5 (18k), and v3 at #8 (15k). Also placing is “Soul Eater” v1 (#7) at 15k
As noted: this is one of two Manga Long Tails that are up, though it isn’t by much given how much the title count soared.
| Year | # of listed items | Percent Change | Total Unit Sold | Percent Change | Calculated Retail Value | Percent Change | Av. Sale per title | Av $ per title |
| 2020 | 20 | ——– | 49,251 | ——- | $703,806 | ——- | 568 | $8,060 |
| 2021 | 50 | 150% | 294,520 | 498.00% | $4,298,970 | 510.82% | 5,890 | $85,979 |
| 2022 | 99 | 98% | 485,713 | 64.92% | $7,516,321 | 74.84% | 4,906 | $75,922 |
| 2023 | 183 | 84.85% | 532,292 | 9.59% | $8,010,909 | 6.58% | 2,909 | $43,775 |
Square Enix has two books over 20k, and another ten over 10k.
New this year to the Manga charts is another new publisher: Webtoon Unscrolled – they formed right at the very end of 2021, and Bobbie Chase is (was?) the EIC, but they’re already regularly placing books in the Top 750, and they are thus the #7 manga publisher according to BookScan 2023 reporters. They place five books in, all Korean Webtoons, for 92k copies and $1.8m in sales.
Their best-seller is True Beauty where v1 (#1) sells 29k, and v2 (#3) sells 19k. This is followed by Cursed Princess Club, where v1 is #2 (22k) and v2 is #4 (12k), and Doom Breaker where v1 is just a hair under 10k. This is a good start for a new company.
Let’s make them a brand new Long Tail, then!
| Year | # of listed items | Percent Change | Total Unit Sold | Percent Change | Calculated Retail Value | Percent Change | Av. Sale per title | Av $ per title |
| 2022 | 4 | ——– | 26,968 | ——- | $539,920 | ——- | 6,742 | $134,980 |
| 2023 | 30 | 750% | 159,824 | 592.64% | $3,168,959 | 586.93% | 5,327 | $105,632 |
Webtoon Unscrolled has two books over 20k, and another ten over 10k.
After this there are no other manga that appear in the BookScan Top 750 in 2023. The next best-selling manga would be Disney Manga: Stitch and the Samurai v1 from Tokyopop’s Disney Manga imprint. It sells fewer than 9k copies in the year
2023 Western Publishers
When I say “Western” here, I mean publishers/work from Europe and America, as opposed to Asia, not publishers of the genre of “western” comics!
Circana BookScan itself does not try to control how data gets initially logged (or changed), leaving that all to publishers. I think that I understand this reasoning: the publisher is the customer to BookScan, and they should have some level of control over how they are represented, but as a person who tries to decipher the data each year, I know that I would prefer some sort of internally-consistent (and externally-petionable!) method of categorizing titles that doesn’t seem to change in some fashion from year-to-year – Books will still appear and disappear year over year, and it makes showing you anything even resembling consistent data staggeringly difficult. And much of this is a function of how publishers assign BISACs and in what order – please please read the long section below on how the sausage is made! ANCHOR TEXT
I’d also like to continue to give you a top-level reminder that back in 2008 there was some sort of behind-the-scenes recategorization in what got sent to me – I now know this is probably a change in BISAC codes! – and most of the “cartoon-strip humor” books like “Calvin & Hobbes” and “The Far Side” suddenly disappeared, so there’s kind of a not-strictly apples thing going on with the pre-2008 numbers here. Do keep that in mind when making comparisons both in the Top 750 chart, as well as the Long Tail.
Another observation I have to repeat is that Circana BookScan tracks (theoretically at least, since again, publishers set their own BISACs) Adult reading distinctly from YA and Kids. I don’t. Part of this is that I’m a bookseller, and I’m rather agnostic about who specifically buys books as a result. But I have to be certain to make this point as clearly as I can again and again: the market for who is buying comics is changing, and it is changing for the wider and the better. The eight year old who is inhaling Dav Pilkey in 2023 is going to be the comics-literate adult of 2036 (or whatever), which is going to change what comics readers in the 2030s will want or expect from comics. The kids reading comics in 1965 totally imagined what the 1980’s comics scene could and would be, which is why we’re where we are today, but the shape of the Western industry in the future is absolutely what today’s children read and see.
Ignore this at your deadliest of perils: the future is always shaped by the present, even if that isn’t what you personally want.
OK, enough editorializing, let’s look at the market!
Here’s the Western Top 750 over time:
| Year | # of placing titles | Unit sales | Calculated Retail price |
| 2003 | 304 | 2,133,618 | $32,360,644 |
| 2004 | 233 | 1,467,535 | $22,713,802 |
| 2005 | 142 | 1,315,920 | $21,537,155 |
| 2006 | 174 | 1,689,571 | $29,314,852 |
| 2007 | 175 | 1,746,962 | $33,247,187 |
| 2008 | 236 | 2,710,175 | $48,327,594 |
| 2009 | 299 | 3,219,748 | $52,147,410 |
| 2010 | 314 | 3,297,317 | $54,515,605 |
| 2011 | 358 | 3,068,593 | $77,254,870 |
| 2012 | 383 | 3,530,143 | $68,593,986 |
| 2013 | 435 | 3,988,864 | $74,805,932 |
| 2014 | 479 | 4,910,846 | $90,166,989 |
| 2015* | 471 | 6,729,449 | $115,035,044 |
| 2016* | 439 | 7,338,541 | $123,594,588 |
| 2017 | 466 | 7,846,357 | $117,761,519 |
| 2018 | 451 | 9,114,745 | $129,929,990 |
| 2019 | 418 | 11,998,489 | $176,470,137 |
| 2020 | 392 | 12,825,951 | $196,604,939 |
| 2021 | 255 | 14,752,121 | $225,424,778 |
| 2022 | 292 | 14,104,511 | $225,392,545 |
| 2023 | 352 | 14,638,628 | $245,627,916 |
2023 Circana BookScan’s Top 750 for Western publishers is looking good: the indicators are up, and pretty significantly compared to manga – we’re much closer back to parity of number of titles in each tranche. Growth is not exceptional (3.5% in pieces, nearly 9% in calculated dollars) – but it is growth, so there’s that. It’s also the 2nd largest number of copies sold in twenty-one years of charting this!
If we were to look at the entirety of all of Circana BookScan’s reported numbers for the total 38,597 distinct “Western” comics, things look generally like this: there are 2158 publishers/imprints listed in the 2023 chart, but only 13 of them manage to capture 1% or more of the market
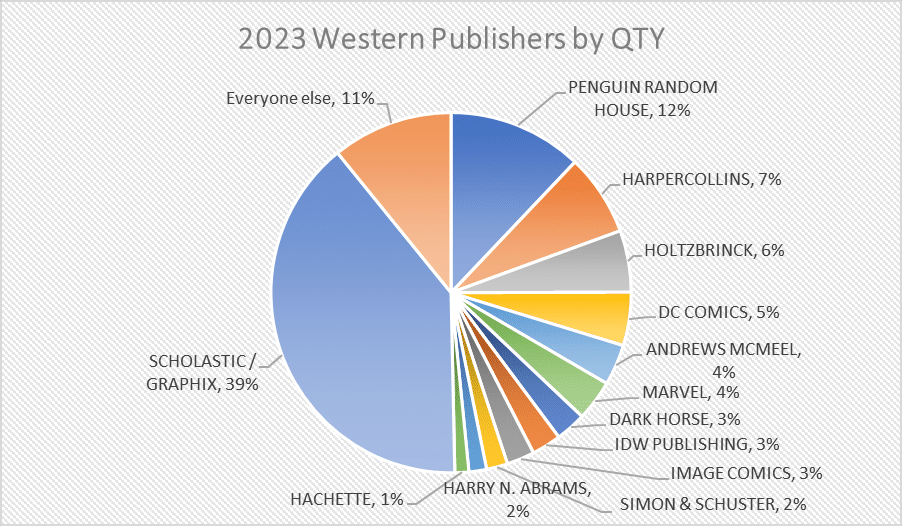
This is not quite as lopsided as the Manga chart… But it is still a bit overwhelming that one publisher (Scholastic) is 39% of all graphic novels sold. Also note that Marvel and DC combined are under 10% in the book market.
***
Let’s start with a look at the Long Tail for Western publishers collectively. As you see the comparison against the Top 750 is leaning harder on best-sellers – the best-selling books in the Top 750 sell around 64% (!) of the volume of all western graphic novels sold in 2023 as reported to Circana BookScan. Please pay attention: the “other” nearly 38,000-plus books really don’t sell all that well. This is how the book business generally works!
| Year | # of listed items | % Change | Total Pieces | % Change | Calculated Retail Value | % Change | Av. Sale per title | Av $ per title |
| 2007 | 6950 | — | 3,029,039 | — | $74,595,605 | — | 436 | $10,733 |
| 2008 | 9728 | 39.97% | 5,368,678 | 77.24% | $98,233,459 | 31.69% | 552 | $10,098 |
| 2009 | 10,936 | 12.30% | 5,946,595 | 10.76% | $107,263,294 | 9.19% | 544 | $9,808 |
| 2010 | 13,229 | 20.97% | 5,890,507 | -0.01% | $105,342,577 | -0.02% | 445 | $7,963 |
| 2011 | 14,954 | 13.04% | 6,001,731 | 1.89% | $112,823,763 | 7.10% | 401 | $7,545 |
| 2012 | 17,031 | 13.89% | 6,052,179 | 0.84% | $123,471,753 | 9.44% | 355 | $7,250 |
| 2013 | 17,468 | 2.57% | 6,637,420 | 9.67% | $131,767,547 | 6.72% | 380 | $7,543 |
| 2014 | 19,524 | 11.77% | 7,905,939 | 19.11% | $156,040,431 | 18.21% | 405 | $7,992 |
| 2015* | 18,019 | -7.71% | 10,689,116 | 34.44% | $197,553,909 | 26.60% | 593 | $10,964 |
| 2016* | 16,328 | -9.38% | 11,516,867 | 7.74% | $212,698,759 | 7.67% | 705 | $13,027 |
| 2017 | 25,183 | 54.23% | 12,544,715 | 8.92% | $217,360,776 | 2.19% | 498 | $8,631 |
| 2018 | 27,583 | 9.53% | 13,865,209 | 10.53% | $230,924,408 | 6.24% | 503 | $8,372 |
| 2019 | 30,816 | 11.72% | 17,233,606 | 24.29% | $288,745,613 | 25.04% | 559 | $9,370 |
| 2020 | 31,893 | 3.49% | 18,495,127 | 7.3% | $318,796,963 | 10.41% | 580 | $9,996 |
| 2021 | 34,624 | 8.56% | 24,105,059 | 30.33% | $430,020,217 | 34.89% | 696 | $12,420 |
| 2022 | 35,461 | 2.42% | 23,021,158 | -4.50% | $424,701,052 | -1.24% | 649 | $11,977 |
| 2023 | 38,559 | 8.74% | 22,889,348 | -0.57% | $431,386,473 | 1.57% | 594 | $11,188 |
The Long Tail for Western publishers is essentially flat in 2023: sales marginally down year-over-year, but dollars up… and to the largest Calculated Retail value we have ever calculated. Of course, that’s an aspirational, yet fictional number (since we can’t know how much books really sold for!), but it’s a fun enough talking point.
Next, we’ll survey each of the publishers, and their best-selling titles, ranking them by the number of pieces they sold this year with the Top 750 of Circana BookScan. We’ll also look at the “long tail” for each entry discussing the entirety of Circana BookScan.
It is now the ninth year in the row that our #1 Western publisher in the Circana BookScan Top 750 is Scholastic. Given that they only started “doing” comics in 2005, and in that time they’ve grown to 39% of the market with only 596 SKUs… well, that is an insanely good achievement. Further, it seems unlikely to get supplanted anytime soon unless kids collectively decide that they suddenly don’t like Dav Pilkey any longer. Think that a nine year old who started reading during the first year Scholastic become the #1 BookScan publisher is now an eighteen years old, and is maybe five years from making their own graphic novels? Things are going to change, and I’m not clear that the Direct Market is exactly prepared for this.
Within the Top 750, Scholastic sells a staggering 8.5 million copies, from 116 placing books. Every number reported here is only from retail sales through Circana BookScan reporters – this doesn’t count what I will assume are much larger numbers of copies that happen via the incredibly successful Scholastic Book Fairs, direct to students. Nor does this count any sales that are being done to elementary and middle school libraries, numbers that likely exceed retail sales. Not that we have any proof, but it seems logical at least.
Also consider that the next largest publisher sold under 2m copies in the Top 750, or under a fourth of Scholastic’s volume. Or, how about this: if you combine the Top 750 performance of all of the traditional Direct Market “Premiere” publishers (Boom!, Dark Horse, DC, Dynamite, IDW, Image and Marvel) those combined best-sellers are fewer than 750k books sold, combined, or under a tenth of Scholastic alone. Scholastic is, quite simply, the ruler of the Top 750 in the Western charts.
Scholastic has several imprints, but virtually all of their sales action is happening either as “Scholastic” or as Graphix – those are certainly the only two to place within the Top 750 itself. The other imprints don’t.
Arthur A. Levine is one of the imprints that doesn’t hit the top 750. Their best seller remains Shaun Tan’s The Arrival but it’s only a little over 5k.
Blue Sky appears to be a dead imprint? The best-selling book labeled as being from Blue Sky on the comics charts is Dav Pilkey’s The Adventures of Ook and Gluk, Kung-Fu Cavemen From The Future, which sells, erm, all of 18 copies this year – that reads as “not actually in print!” to me
The Graphix imprint is where all of the action is. Up above at the top of the column in the “Top Twenty” section we talked about Dav Pilkey, and Graphix’s other hits like “Wings of Fire”, “Baby Sitter’s Club” or “Five Nights at Freddy’s”, so there doesn’t seem to be an enormous need to talk about all of the same books again? And those books are all in Scholastic’s Top 20 as well. I think the only book that wasn’t mentioned already uptop is Heartstopper by Alice Oseman, where v5 comes in at #20 for Scholastic, with 117k sold. V2 also comes in at #28 with 103k.
Also over 100k is Raina Telgemeier with Smile (at 103k) – Guts falls a bit to “just” 98k, though it’s only a drop compared to the relative heights Raina has two years ago. Raina also places Drama at 90k, Sisters at 85k, and Ghosts at 68k, which only seem small in relation to the big hits of Scholastic – those would be seen as big numbers anywhere else. Some of this can be seen in the difference between Dav Pilkey doing 2-3 new books a year, and Raina being “off the market” for about five years so far since Guts.
Kazu Kibushi is in a similar boat as we waited in 2023 for the release of the last volume of Amulet – v1 has dropped to just 38k sold this year, which would comparatively look like a massive hit still. I would expect this to change in a big way in 2024 when the charts show v9’s release.
Also over 50k and worthy of paying attention to would be v7 of the “I Survived” series with The Great Chicago Fire – that does 58k – as well as Invisible by Christina Diaz Gonzalez (55k) as well as Allergic by Megan Wagner Lloyd (51k)
After this, we’re looking at books under 50k, though many of these still sell much better than things you would otherwise expect – one super-clear example is the 34k copies of Scholastic’s Miles Morales: Shock Waves, which sells about three times better than any other Marvel graphic novel published by Marvel. The success of Scholastic is funny to me in that I start drawing arbitrary lines at 50k as “important enough to mention”, when almost any other publisher is incredibly lucky to have more than three or four titles selling that well.
The Long Tail for Scholastic looks like this – steady on in a down year:
| Year | # of listed items | Percent Change | Total Unit Sold | Percent Change | Calculated Retail price | Percent Change | Av. Sale per title | Av $ per title |
| 2007 | 28 | —— | 203,900 | —— | $2,018,694 | —– | 7282 | $72,096 |
| 2008 | 39 | 39.29% | 346,134 | 69.76% | $3,498,012 | 73.28% | 8875 | $89,693 |
| 2009 | 52 | 33.33% | 432,070 | 24.83% | $4,654,686 | 33.07% | 8309 | $89,513 |
| 2010 | 60 | 15.38% | 361,086 | -16.43% | $4,084,718 | -12.25% | 6018 | $68,079 |
| 2011 | 72 | 20.00% | 419,010 | 16.04% | $4,708,860 | 15.28% | 5819 | $65,401 |
| 2012 | 76 | 5.56% | 325,088 | -22.42% | $3,955,249 | -16.00% | 4277 | $52,043 |
| 2013 | 91 | 19.74% | 437,590 | 34.61% | $5,365,921 | 35.67% | 4809 | $58,967 |
| 2014 | 97 | 6.59% | 846,277 | 93.39% | $10,204,175 | 90.17% | 8725 | $105,198 |
| 2015* | 140 | 44.33% | 1,449,296 | 71.26% | $17,170,714 | 68.27% | 10,352 | $122,648 |
| 2016* | 131 | -6.43% | 1,940,760 | 33.91% | $23,919,704 | 39.31% | 14,815 | $182,593 |
| 2017 | 166 | 26.72% | 2,823,345 | 45.55% | $33,884,541 | 41.66% | 17,008 | $204,124 |
| 2018 | 224 | 34.94% | 4,623,212 | 63.75% | $54,645,209 | 61.27% | 20,639 | $243,952 |
| 2019 | 270 | 20.54% | 6,868,794 | 48.57% | $88,878,195 | 62.65% | 25,440 | $329,179 |
| 2020 | 343 | 27.03% | 7,164,029 | 4.30% | $95,638,289 | 7.61% | 20,886 | $278,829 |
| 2021 | 436 | 27.11% | 9,987,540 | 39.41% | $137,156,876 | 43.43% | 22,907 | $314,580 |
| 2022 | 520 | 19.27% | 9,236,437 | -7.52% | $135,077,506 | -1.52% | 17,762 | $259,764 |
| 2023 | 596 | 14.62% | 9,030,932 | -2.23% | $136,132,796 | 0.08% | 15,153 | $228,411 |
Scholastic has one book over a million copies (!), another one over 300k, five more over 200k, 21 more over 100k, 23 others over 50k, 34more over 20k, and an additional 26 over 10k. Whew! Any other publisher would be satisfied with a tiny fraction of that (as you will clearly see if you keep reading along) – this is also known as “the Viz Problem”
Even with the 2% year-over-year drop in circulations, Scholastic still feels like a juggernaut to me: the vast majority of their portfolio is extremely likely to continue as “perennial seller” status. And I continue to lustily fantasize about what might happen if they decided to do two streams of revenue and serialized first before eventual collection. Seriously, yo.
Solidly at #2 is one of the traditional “Big Five” book publishers: Penguin Random House. They land 38 titles into the 2022 Circana BookScan Top 750, selling 1.5 million copies for just over $28m in calculated gross sales.
Like a lot of the “big five” book publishers, these companies have lots and lots of imprints built up over decades of publishing books – enough to drive a guy like me crazy! Penguin Random House, as best as I can tell, has fourteen distinct imprints that appear in the Top 750 list for 2023 – Alfred A. Knopf, Del Rey, Dial, G.P. Putnam’s Sons Books, Inklore, Pantheon, Penguin, Random House Books For Younger Readers, Random House Graphic, Razorbill, Tarcherperigee, Triangle Square, Tundra, and Viking.
They’re also, in the long tail: (deep breath!) Ace, Ballantine, Bantam, Berkley, Blue Snake, Broadway Books, Clarkson N. Potter, Crown, Delacorte, Doubleday, Dutton, Emblem, Flammarion, Golden, Gotham Books, Grossett & Dunlap, Hudson Street, InkLit, Knopf, Labyrinth Road, McClelland & Stewart, Montena, Nan A. Talese, New American Library, One World, Philomel, Plume, Potter Style, Prestel, Price Stern Sloan, Puffin, Putnam, Riverhead, Rodale, Schocken, Schwartz & Wade, Ten Speed, Three Rivers, Villard, Waterbrook, Watson-Guptill and Yearling. (whew!)
However, they are not (Brian writes down here so he remembers this research each year – you’d be shocked how long it take me to sort through this stuff every time!) the PRH-distributed-only Angry Robot, BCN Multimedia, Beacon, Black Balloon, Booksurge, Campfire, Catapult, Charlesbridge, Devil’s Panties, Dragonfly, Fawcett, Frog In Well, Gefen, Hippo Park, Library of America, Little Bigfoot, Margeret Ferguson books, M Press, MIT Press, New York Review, Nobrow, NoStarch, North Atlantic, Other Press, Overlook Press, Pixel+Ink, Powerhouse, Pushkin Press, Quirk, Ramble House, Rizzoli, Sasquatch, Semiotext(e), Seven Stories Press, Shambhala, Smithsonian, Soft Skull, Sonoma Valley Press, Squid Works, Sunday Press, Tibet House, Toon Books, Universe, Verso, or Wordsong (I am sure I missed a few!!)
They are also the bookstore distributor for Archie, Dark Horse, DC, IDW, Marvel, and Titan
Looking at those imprints in alphabetical order, within the Top 750:
Alfred A. Knopf places two books into the Top 750, though none within PRH’s Top Twenty: Roughly 18k copies of White Bird: A Wonder Story is their best seller.
Del Rey has one placing title for 2023, the Dave Wenzel adaptation of The Hobbit for about 19k copies, and this is a solid, steady perennial volume that has consistently placed for years and years. Publication rights switch over to William Morrow in 2024, a HarperCollins company.
Dial places three books in the Top 750, and two are by Victoria Jamieson: When Stars Are Scattered (#8 for PRH over all) at almost 49k copies, Roller Girl (not in the Top Twenty) at about 12k. They also have Mexikid by Pedro Martin which sells 19k in its first frame.
G.P. Putnam & Sons places a single book in the Top 750: PAWS v2: Mindy Makes Some Space, which just cracks 20k.
Inklore is a sub-imprint of the imprint “Random House Worlds”, which makes my head all itchy – what distinguishes this from other “RHW” books, or even, for that matter, for other things published under a more generic “Random House” brand? How does it help anyone sell books? These are the mysteries of our universe. But the biggest book they publish is Rachel Smythe’s Lore Olympus which does pretty shockingly well with split formats. In hardcover, v4 is the #6 book for PRH overall, with 70k sold. Then it goes to v1 in paperback (#14 overall for PRH, 37k sold). But then it goes back to hardcover (that’s really unusual!) for v3 (#17, 34k), v1 (#18, 28k), v2 (#19, 28k) and v5 (#20, 28k), before the softcovers start placing again (between 16k and 26k each). Seriously: I don’t know that I can think of any other series where hardcovers sell better than paperbacks. Smythe has herself some fans!
Pantheon is their “literary” comics wing, and has some of PRH’s steadiest-sellers. There are seven books placing in 2023, including Art Spiegelman’s Pulitzer Prize-winning Maus, where volume 1, My Father Bleeds History (#1 for PRH overall) sells more than 236k copies. Are you old enough to remember that Maus isn’t a “graphic novel”, per se: it’s a collection of an originally serialized mini-comic that was bound into “Raw” Magazine in the early 1980s. This is one of the reasons it is actually split into two volumes, and v2, And Here My Troubles Began (#4 for PRH overall) sells about 95k copies. The complete hardcover edition of both volumes (#2) also sells another 118k copies. In addition to this, v1 Marjane Satrapi’s Persepolis (#3 for PRH overall) sells very well at 105k – this only sold 50k last year. As always surprises me with Pantheon books, way way less people read v2 – less than a tenth, at 8852 copies, not even making it into the Top 750! But the Complete edition of Persepolis (#11) sells 43k (again, massively up from 23k last year). I’m genuinely not sure that I understand these sales patterns, though my assumption is that Pantheon simply isn’t doing a good job explaining these are multi-volume series. Finally, the adaptation Anne Frank’s Diary sells 11k copies in 2023.
From Penguin Group is a bit more than 14k copies of Pencilmation: The Graphite Novel by Ross Bollinger. They also sell almost 10k copies sold of Penguin Classics: Amazing Spider-Man v1, which reprints a bit more than the first nineteen issues of ASM, along with text essays. It’s worth observing that Marvel itself also publishes this same material: in a slightly smaller “Mighty Marvel Masterworks” format for $16 (vs the $28 here), that only shifts about 7k as well in the $45 full sized “Epic” collection which sells about 2200 copies, as well as a $125 hardcover, which trickles out fewer than 500 copies sold. It’s utterly wild to me that Marvel is the worst publisher for Marvel comics, with Penguin, Scholastic, and Viz all doing meaningfully better in selling Marvel products – even the “exact same” product, as in this case.
Random House Books For Younger Readers and Random House Graphic are, unless I am really dumb, essentially the same imprint, so I will lump them together here. They have 24 placing titles within the Top 750, and several are among PRH’s personal Top 20, led by Sweet Valley Twins: Best Friends (#5 for PRH overall, 89k in sales), and Sweet Valley Friends: Teacher’s Pet (#9, 47k) Following that is Pizza & Taco v5: Rock Out! (#13, 38k sold), with another five volumes charting with sales between 11k and 26k, and that’s followed by K. O’Neill’s The Moth Keeper (#16, 34k). Other successful books for the imprint include Katie the Catsitter by Colleen Venable (three volumes selling between 17k-27k) and Judd Winick’s Hilo (v9 does 23k).
Razorbill places two volumes of Paws by Nathan Fairbairn into the Top 750 – both do right around 14k.
Tarcherperigee has a single book, Oddballs: the Graphic Novel, which sells 15k copies.
Triangle Square also places a single book: around 11k of Sex is a Funny Word by Cory Silverberg.
Tundra has nine placing volumes of Ben Clanton’s Narwahl: Unicorn of the Sea series. V1 is #10 for the company overall, with almost 44k sold, with v8 (#12 – 41k), and v7 (#15, 35k) are not far behind. The other six books sell between 11-19k each.
And finally, there is Viking with Max Brailler’s The Last Comics on Earth which is #7 for PRH overall, selling 51k copies.
Penguin Random House formed out of a merger in 2013 – prior to that they were separate publishers: Penguin, and Random House. Here’s what the Long-Tail for the combined Penguin Random House looked like in 2023 – almost 20% growth!:
| Year | # of listed items | % Change | Total Pieces | % Change | Calculated Retail Value | % Change | Av. Sale per title | Av $ per title |
| 2013 | 282 | ——- | 447,174 | ——- | $7,259,364 | ——- | 1,586 | $25,742 |
| 2014 | 252 | -10.64% | 428,634 | -4.15% | $7,415,712 | 2.15% | 1,701 | $29,427 |
| 2015* | 450 | 78.57% | 513,611 | 19.83% | $8,517,761 | 14.49% | 1,141 | $18,928 |
| 2016* | 293 | -34.88% | 435,877 | -15.13% | $7,150,087 | -16.06% | 1,488 | $24,403 |
| 2017 | 409 | 39.59% | 664,858 | 52.53% | $10,136,224 | 41.76% | 1,626 | $24,783 |
| 2018 | 613 | 49.88% | 760,314 | 14.36% | $11,136,058 | 9.86% | 1,240 | $18.166 |
| 2019 | 635 | 3.59% | 1,013,092 | 33.25% | $15,745,448 | 41.39% | 1,595 | $24,796 |
| 2020 | 551 | -13.23% | 1,380,328 | 36.25% | $21,157,243 | 34.37% | 551 | $38,398 |
| 2021 | 809 | 46.82% | 1,901,467 | 37.75% | $30,131,057 | 42.41% | 2,350 | $37,245 |
| 2022 | 760 | -6.06% | 2,330,883 | 22.58% | $41,906,282 | 39.08% | 3,067 | $55,141 |
| 2023 | 976 | 28.42% | 2,762,617 | 18.52% | $49,882,072 | 19.03% | 2,831 | $51,109 |
However, I’m not willing to pull an “We’ve always been at war with Eurasia” moment, so let’s look at the individual pieces of the past. This is what Penguin Putnam (Ace, Berkley Books, Dial, Dutton, Gotham Books, Grossett & Dunlap, Hudson Street, InkLit, New American Library, Penguin, Philomel, Plume, Price Stern Sloan, Puffin, Putnam, Razorbill, Riverhead and Viking) used to look like alone)
| Year | # of listed items | % Change | Total Pieces | % Change | Calculated Retail Value | % Change | Av. Sale per title | Av $ per title |
| 2007 | 18 | —— | 13,545 | —— | $178,260 | —— | 753 | $9,903 |
| 2008 | 28 | 55.56% | 28,606 | 111.19% | $310,856 | 74.38% | 1022 | $11,102 |
| 2009 | 39 | 39.29% | 40,288 | 40.84% | $444,928 | 43.13% | 1033 | $11,408 |
| 2010 | 45 | 15.38% | 50,628 | 25.67% | $623,650 | 40.17% | 1125 | $13,859 |
| 2011 | 53 | 17.78% | 123,749 | 144.43% | $1,576,161 | 152.73% | 2335 | $29,739 |
| 2012 | 60 | 13.21% | 121,769 | -1.60% | $1,499,660 | -4.85% | 2029 | $24,994 |
This is what Random House (Alfred A. Knopf, Ballantine, Bantam, Broadway, Crown, Del Rey, Doubleday, Pantheon, Random House, Schocken, and Three Rivers) looked like alone:
| Year | # of listed items | % Change | Total Pieces | % Change | Calculated Retail value | % Change | Av. Sale per title | Av $ per title |
| 2007 | 74 | — | 216,580 | — | $2,890,347 | — | 2,927 | $39,059 |
| 2008 | 77 | 5.47% | 383,105 | 76.89% | $5,698,922 | 97.17% | 4,975 | $74,012 |
| 2009 | 109 | 41.56% | 405,598 | 5.87% | $5,398,890 | -5.26% | 3,721 | $49,531 |
| 2010 | 132 | 21.10% | 389,410 | -3.99% | $5,831,814 | 8.02% | 2,950 | $44,180 |
| 2011 | 144 | 9.09% | 397,143 | 1.99% | $6,356,212 | 8.99% | 2,760 | $44,140 |
| 2012 | 185 | 28.47% | 375,254 | -5.51% | $7,124,794 | 12.09% | 2,028 | $38,512 |
Penguin Random House has one book over 200k, two others 100k, another four over 50k, 24 additional books over 20k, and another 32 books over 10k.
Solidly at #3 largest publisher in Western comics in Circana BookScan Top 750 in 2023: HarperCollins. Worth remembering is that HarperCollins completed the purchase of Houghton Mifflin Harcourt in 2021 – HMH was the 11th largest Top 750 Circana BookScan publisher in 2020, if you will recall. Harper places 49 books into the Top 750 for about 1.3 million copies sold, and a calculated retail cover price of almost $22 million. There’s a lot of imprints with the word “Harper” in the title in the Long Tail (Harper, Harper Paperbacks, Harper Teen, Harper Festival, Harper Teen, and so on), and Harper is also Blazer & Bray, Clarion/Etch, ET, Katherine Tegan, Mariner, Quill Tree and William Morrow (in the Top 750); as well as Amistad, Dey Street, Ecco, Fourth Estate, Friday Project, Greenwillow, Harvest, Houghton Mifflin Harcourt, Joanna Cotler, IT books, Thomas Nelson, Versify, William Collins and Zondervan (out of the Top 750)
In alphabetical-by-imprint order:
At Balzer & Bray they place six titles into the Top 750, and it continues to be all about Terri Libenson. Surprisingly Sarah is her newest book (it appears to be the seventh book in the series, though HC doesn’t refer to this in titling or metadata) and is the #7 overall best-seller for HarperCollins. It sells about 50k copies. The other five volumes sell between 10k and 20k each.
Clarion/Etch was a formerly Houghton Mifflin Harcourt middle-grade imprint. Clarion places a dozen titles within the Top 750, led by the success of the web-first Hooky by Miriam Bonastre Tur – v1 (#2 overall for HarperCollins) leads with almost 77k copies, while v2 (#4) comes in at 75k sold, while v3 (#5) sells 73k – that’s a remarkably consistent sales pattern. This is followed by the success of Kayla Miller, and six books from her, first with Crunch (37k), then Camp (27k), Clash (#10, 36k), as well as four other books from her which sell between 11k-16k. Clarion also places The Crossover (18k) and Booked (12k) by Kwame Alexander, and The Giver by Lois Lowrey (just under 10k).
It’s probably a typo, but my chart also shows an imprint called ET, but it’s another Kayla Miller book that would have otherwise been in the Etch imprint – this is a second volume of Besties which sells a smidge over 10k
At the various Harper-named imprints, they have nineteen titles within the overall Circana BookScan Top 750. Their biggest hit is from gaming stars from YouTube. FGTeev’s Out of Time! is #1 for HarperCollins, with a bit over 100k sold. This is followed by Saves The World! (#9) with 41k sold Three other FGTeev books are in the chart mostly in the mid-30ks. HarperAlley has also tried to spin that success off with other YouTubers – Prestonplayz’s The Mystery of the Super Spooky Secret House sells about 32k, while Lankybox’s Epic Adventure sells a bit under 30k. The other big success is Johnnie Christmas’ Swim Team (#8, 46k). Also of note is James Dean’s Pete the Cat and the Sprinkle Stealer which almost does 30k, a pair of Erin Hunter “Warriors” comics selling 21, and Molly Ostertag’s Dungeons & Dragons Dungeon Club: Roll Call which is just under 21k.
Katherine Tegan’s best-seller in 2023 is The First Cat In Space Ate Pizza which sold 18k in hardcover as well as 16k in paperback (unusual!).
Mariner was also a former HMH imprint, and has two in the Top 750: Alison Bechdel’s Fun Home at 17k sold, and an adaptation of George Orwell’s 1984 with 11k sold.
The Quill Tree imprint places four books, including Harper’s #3 best-seller for the year: Jerry Craft’s New Kid with 75k sold, while at #6 is Craft’s School Trip (55k), while Class Act sells 23k. And soaring up to #10 (thanks Netflix!) is N.D. Stevenson’s perennial Nimona, with 41k (up from 14k last year!)
Finally, the William Morrow imprint is in the Top 750 overall, but not a Top Twenty book for Harper – they sell 23k of the forever perennial Understanding Comics by Scott McCloud.
Here is the Long Tail for Harper, with HMH included as of 2022:
| Year | # of listed items | Percent Change | Total Unit Sold | Percent Change | Calculated Retail value | Percent Change | Av. Sale per title | Av $ per title |
| 2007 | 18 | —— | 36,940 | —— | $600,540 | —– | 2,052 | $33,363 |
| 2008 | 36 | 100.00% | 48,264 | 30.66% | $863,808 | 43.84% | 1,341 | $23,995 |
| 2009 | 42 | 16.67% | 81,774 | 69.43% | $1,308,891 | 15.53% | 1,947 | $31,164 |
| 2010 | 41 | -2.38% | 64,429 | -21.21% | $719,328 | -45.04% | 1,571 | $17,545 |
| 2011 | 50 | 21.95% | 75,394 | 17.02% | $1,083,609 | 50.64% | 1,508 | $21,672 |
| 2012 | 80 | 60.00% | 159,573 | 111.65% | $2,113,744 | 95.07% | 1,995 | $26,422 |
| 2013 | 68 | -15.00% | 197,595 | 23.83% | $2,667,933 | 26.22% | 2,906 | $39,234 |
| 2014 | 115 | 69.12% | 158,193 | -19.94% | $2,398,836 | -10.09% | 1,376 | $21,042 |
| 2015* | 109 | -5.22% | 188,181 | 18.96% | $2,646,378 | 10.32% | 1,726 | $24,279 |
| 2016* | 108 | -0.09% | 261,183 | 38.79% | $4,473,589 | 69.05% | 2,418 | $41,422 |
| 2017 | 107 | -0.09% | 357,972 | 37.06% | $5,530,994 | 23.64% | 3,346 | $51,692 |
| 2018 | 148 | 38.32% | 517,800 | 44.65% | $7,506,751 | 35.72% | 3,499 | $50,721 |
| 2019 | 154 | 4.05% | 891,701 | 72.21% | $13,894,052 | 85.09% | 5,790 | $90,221 |
| 2020 | 220 | 42.86% | 1,219,785 | 36.79% | $19,396,157 | 39.60% | 5,544 | $88,164 |
| 2021 | 403 | 83.18% | 1,668,202 | 36.76% | $26,028,053 | 34.19% | 4,139 | $64,586 |
| 2022 | 522 | 29.53% | 1,852,589 | 11.05% | $28,095,121 | 7.94% | 3,549 | $53,822 |
| 2023 | 610 | 16.86% | 1,861,205 | 0.47% | $30,626,452 | 9.01% | 3,051 | $50,207 |
Even modest growth is growth! HarperCollins has one book over 100k, another six over 50k, a further 15 books over 20k, and another 23 more over 10k.
Just for the historical record to remain intact, here is what Houghton Mifflin Harcourt used to sell before HarperCollins bought them in 2021; these numbers are not included in the above chart:
| Year | # of listed items | Percent Change | Total Unit Sold | Percent Change | Calculated Retail value | Percent Change | Av. Sale per title | Av $ per title |
| 2007 | 4 | —— | 20,474 | —— | $434,495 | —— | 5119 | $108,624 |
| 2008 | 6 | 50.00% | 14,183 | -30.73% | $307,019 | -29.34% | 2363 | $51,170 |
| 2009 | 14 | 233.33% | 24,568 | 73.22% | $436,328 | 42.12% | 1755 | $31,166 |
| 2010 | 17 | 21.43% | 29,163 | 18.70% | $532,539 | 22.05% | 1715 | $31,326 |
| 2011 | 18 | 5.88% | 24,239 | -16.88% | $450,536 | -15.40% | 1347 | $25,030 |
| 2012 | 21 | 16.67% | 23,562 | -2.79% | $402,575 | -10.65% | 1122 | $1,9170 |
| 2013 | 29 | 38.10% | 44,558 | 89.11% | $687,920 | 70.88% | 1536 | $23,721 |
| 2014 | 27 | -6.90% | 32,751 | -26.50% | $552,884 | -19.63% | 1213 | $20,477 |
| 2015* | 33 | 22.22% | 78,357 | 239.25% | $1,214,786 | 219.72% | 2374 | $36,812 |
| 2016* | 38 | 15.15% | 60,359 | -22.97% | $943,188 | 22.36% | 1588 | $24,821 |
| 2017 | 27 | -28.95% | 42,963 | -28.82% | $710,481 | -24.67% | 1591 | $26,314 |
| 2018 | 60 | 222.22% | 41,596 | -3.18% | $701,891 | -1.21% | 693 | $11,698 |
| 2019 | 59 | -1.67% | 192,157 | 361.96% | $2,909,580 | 314.53% | 3257 | $49,315 |
| 2020 | 75 | 27.12% | 253,602 | 31.98% | $3,611,395 | 24.12% | 3381 | $48,152 |
Coming in at #4 is Macmillan, owned by Holtzbrink, another of the “big five”, and is also one of those publishers with lots and lots (and lots) of imprints, although only FirstSecond, Hill + Wang, Roaring Brook and Square Fish place within the Circana BookScan Top 750 – I have also identified Farrar, Straus and Giroux, Feiwel & Friends, Griffin, Henry Holt, Imprint, Metropolitan, Picador, Rodale Press, St. Martins Griffin, Times books, and Tor. Macmillan also distributes several other publishers they don’t own (including Bloomsbury, Drawn & Quarterly, Papercutz, and Seven Seas) Holtzbrinck-owned companies placed 21 titles in the Top 750, for about 723k copies sold and about a calculated $10.5m gross combined.
First Second is their most successful imprint by far, and their biggest hit is John Patrick Green’s Investigators series. We actually start with the new spin-off series: Investigators: Agents of S.U.I.T. where v1 is #1 with 83k sold. Then it goes back to the main Investigators series with v7, All Tide Up (#2) does 73k, followed by v6, Heist and Seek (#3, 63k), v1 at #4 (49k), v5 Braver and Boulder at #7 (42k), v4 Ants in our P.A.N.T.S. at #8 (40k), and v2 Take The Plunge at #10 (35k). v3 Off the Hook would be #11 if we counted past ten (also 35k) – this is a popular series! Worth noting that none of the volume numbers or sequences are noted in any of the metadata for nearly any Macmillan published book.
Also hitting from FirstSecond is Claribel Ortega’s Frizzy (#5, 44k), Clint McElroy’s Adventure Zone v5: Eleventh Hour (#6, 43k), and Gene Yang’s American Born Chinese (#9, 38k). Also of note: Zack Weinersmith’s Bea Wolf with nearly 23k sold.
Hill & Wang places within the Top 750 with the adaptation of Ray Bradbury’s Fahrenheit 451, which sells nearly 12k.
Roaring Brook has three placers with Nick Bruel’s Bad Kitty, with what looks to be v5, Supercat selling 30k, while v2, Gets a Phone sells 23k. Additionally, Leigh Bardugo’s Demon in the Woods sells 13k.
Finally at Square Fish, Macmillan’s imprint of primarily cheaper-priced books that succeeded at other imprints (I don’t really get this strategy as a book seller, to be honest) places a single book, the adaptation of Madeleine L’Engle’s A Wrinkle in Time, which sells 12k
Here’s Macmillan’s Long Tail, which shows a solid uptick in 2023:
| Year | # of listed items | Percent Change | Total Unit Sold | Percent Change | Calculated Retail value | Percent Change | Av. Sale per title | Av $ per title |
| 2007 | 39 | —— | 31,452 | —— | $559,681 | —– | 806 | $14,351 |
| 2008 | 66 | 69.23% | 63,473 | 101.81% | $1,132,767 | 102.40% | 962 | $17,163 |
| 2009 | 88 | 33.34% | 84,090 | 32.48% | $1,438,044 | 26.95% | 956 | $16,341 |
| 2010 | 108 | 22.73% | 68,599 | -18.42% | $1,085,311 | -24.53% | 635 | $10,049 |
| 2011 | 139 | 28.70% | 114,243 | 66.54% | $1,794,084 | 65.31% | 822 | $12,907 |
| 2012 | 165 | 18.71% | 126,745 | 10.94% | $2,077,143 | 15.78% | 768 | $12,589 |
| 2013 | 187 | 13.33% | 142,375 | 12.33% | $2,395,569 | 15.33% | 761 | $12,811 |
| 2014 | 222 | 18.72% | 190,682 | 33.93% | $3,096,858 | 23.27% | 859 | $13,950 |
| 2015* | 104 | -53.15% | 99,223 | -47.96% | $1,804,001 | -41.75% | 954 | $17,346 |
| 2016* | 272 | 161.54% | 272,668 | 174.80% | $4,240,075 | 135.04% | 1,002 | $15,589 |
| 2017 | 336 | 23.53% | 437,258 | 60.36% | $6,616,130 | 56.04% | 1,301 | $19,691 |
| 2018 | 427 | 27.08% | 723,096 | 65.37% | $11,701,046 | 76.86% | 1,693 | $27,403 |
| 2019 | 494 | 15.70% | 946,680 | 30.92% | $15,814,819 | 35.16% | 1,916 | $32,014 |
| 2020 | 552 | 11.74% | 1,022,598 | 8.02% | $16,455,419 | 4.05% | 1,853 | $29,811 |
| 2021 | 602 | 9.06% | 1,214,283 | 18.74% | $18,989,371 | 15.40% | 2,017 | $31,544 |
| 2022 | 683 | 13.46% | 1,203,338 | -0.01% | $18,701,422 | -1.52% | 1,762 | $27,381 |
| 2023 | 746 | 9.22% | 1,269,148 | 5.47% | $20,650,460 | 10.42% | 1,701 | $27,682 |
Macmillan has three books over 50k, ten more over 20k, and three others over 10k.
Next in the Top 750 at #5 publisher is Andrews McMeel. This is a publisher that often has frustrated me by how they’ve been represented by Circana BookScan – as I noted, it used to be that “humor” books like Far Side and Calvin & Hobbes used to rule the Circana BookScan charts. Until, one day, poof! Almost all of those books disappeared entirely from the dataset I was given, throwing off a whole lot of my comparables. And, for the most part, comic strip reprints have stayed out of these charts for half a decade. But, they’ve started creeping back into the listings for the last few years (See below!). I’m actually fine with comic strips and comic books co-existing in the same places – at least they’re both comics – but the inconsistency just drives me nucking futz.
I found 26 titles from AMcM in the Top 750 in 2023, for 457k copies and $11.3 million in calculated dollars, but clearly that number would scale up to some degree if it listed all of the strip collections they publish. What’s interesting about Andrews McMeel is that, for the most part, their “graphic novels” are reformatted/repackaged newspaper strips. In other words, this is basically the other paid-for way one can serialize work: through syndicated newspaper pages – as diminished as it is.
2023’s top book for Andrew’s McMeel is Lincoln Peirce’s Big Nate, where v28 (Nailed It!) is #1 with nearly 40k sold. In addition, v29 “Move It or Lose It!” is #5 (26k), v27 Release the Hounds! is #6 (24k), v26 Beware of Low-Flying Corn Muffins is #9 (20k) and v2 Prank You Very Much is #10 (almost 19k). Also within the Top 750 are a few two-in-one volumes (these are not numbered for some reason): Very Funny! sells almost 19k, No Worries! does almost 18k, and Stays Classy is under 10k.
Following this is the new paperback edition of The Complete Calvin and Hobbes by Bill Watterson which is the #2 best-seller for Andrews McMeel, with 33k sold. Because this edition is $135 retail, it’s actually the #3 dollar book for the entire 2023 BookScan, selling almost $.5 million in calculated dollars. The hardcover edition of this same package sells another almost 9k copies, and because of that edition’s $225 cover price, it would have been #23 overall in calculated dollars. In addition, the newest Calvin reformat, the Portable Compendium” books, sold almost 16k copies. And, if we’re talking about conventional strips, the paperback edition of Gary Larson’s The Complete Far Side also placed in the Top 750, a bit under 10k.
Following this comes Animal Rescue Friends where v2 is #3 for Andrews McMeel, while v1 is #4 (both sell right around 27k)
Then comes Dana Simpson’s Phoebe and Her Unicorn with the self-titled v1 is #7, selling about 24k. A few others of this series place in the Top 750, with v17, Punk Rock Unicorn selling about 14k copies, v16 (Unicornado) selling about 12k, and a pair of unnumbered “two in one” editions, one selling about 12k, the other under 10k.
After that, the last title within their Top Ten is v1 of the three-in-one editions of Enola Holmes which comes in at #8 and sells about 21k. v2 of that bind-up sells about 11k. No other Andrews McMeel book sells over 20k.
Andrews McMeel’s Long Tail chart is for sure my most frustrating one because they publish a whole lot of comics (humor strips, like “Calvin & Hobbes”) where the BISAC changed to something we’re having a hard time properly getting – so almost certainly they’re doing several times better than this chart would suggest because of those books. Further, things appear and disappear in a way I’ve never been able to make sense of – it might be them changing BISACs after the fact. Most of my comparatives are terrible and counterproductive here, and I really apologize for the crappiness of my data in this specific publisher’s instance.
| Year | # of listed items | Percent Change | Total Unit Sold | Percent Change | Calculated Retail Value | Percent Change | Av. Sale per title | Av $ per title |
| 2007 | 22 | —— | 29,835 | —— | $461,238 | —– | 1,356 | $20,965 |
| 2008 | 20 | -9.09% | 25,115 | -15.82% | $388,965 | -15.67% | 1,256 | $19,448 |
| 2009 | 21 | 5.00% | 26,205 | 4.34% | $401,982 | 3.35% | 1,248 | $19,142 |
| 2010 | 19 | -9.52% | 47,181 | 80.05% | $544,852 | 35.54% | 2,483 | $28,676 |
| 2011 | 17 | -10.53% | 116,850 | 147.66% | $1,222,171 | 124.31% | 6,874 | $71,892 |
| 2012 | 31 | 82.53% | 225,546 | 93.02% | $2,737,935 | 124.02% | 7,276 | $88,320 |
| 2013 | 43 | 38.71% | 343,681 | 52.38% | $3,747,799 | 36.88% | 7,993 | $87,158 |
| 2014 | 59 | 37.21% | 373,713 | 8.74% | $4,387,252 | 17.06% | 6,334 | $74,360 |
| 2015* | 76 | 28.81% | 502,061 | 34.34% | $5,950,368 | 35.63% | 6,606 | $78,294 |
| 2016* | 85 | 11.84% | 472,145 | -5.96% | $5,147,673 | -13.49% | 5,555 | $60,561 |
| 2017 | 140 | 64.71% | 520,554 | 10.25% | $5,644,031 | 9.64% | 3,718 | $40,315 |
| 2018 | 273 | 95.00% | 735,184 | 41.23% | $11,862,349 | 210.18% | 2,693 | $43,452 |
| 2019 | 277 | 1.46% | 611,784 | -16.79% | $11,078,977 | -6.60% | 2,209 | $39,996 |
| 2020 | 288 | 3.97% | 644,390 | 5.33% | $13,539,999 | 22.21% | 2,237 | $47,014 |
| 2021 | 359 | 24.65 | 929,267 | 44.21% | $20,557,874 | 51.83% | 2,588 | $57,264 |
| 2022 | 374 | 4.18% | 913,185 | -1.73% | $17,581,342 | -14.48% | 2,442 | $47,009 |
| 2023 | 350 | -6.42% | 836,627 | -8.38% | $19,228,644 | 9.37% | 2,390 | $54,939 |
Andrews McMeel has eight books over 20k, and 14 others over 10k.
In a pretty surprising move forward this year, IDW Publishing jumps up another place to become the #6 Western publisher in the BookScan 2023 Top 750 – surprising because of whom they just moved in front of – placing seven books for a total of 286k sold, and a bit under $7m in calculated dollars. The vast majority of this growth comes down to Teenage Mutant Ninja Turtles: The Last Ronin, but any “W” is a “W”. Further, this now makes IDW the best-performing “Direct Market native” publisher in the bookstore market Top 750, which is a really big power move. IDW has a lot of imprints, including Artist Editions, Black Crown, Library of American Comics, Top Shelf, Yoe Books, and, of course, IDW itself.
As implied above, their best-seller from regular IDW branding is TMNT: The Last Ronin (#1), which sells and amazing 148k in its sophomore frame (up significantly from 66k in the previous year), and while they also sell almost 23k copies of the sequel volume TMNT The Last Ronin – Lost Years (#4). In addition, they sell a good amount of Sonic The Hedgehog comics – with Sonic & Tails: Best Buds Forever (#5) selling 21k copies, while v1 of the ongoing series is #6 with 14k sold.
The rest of their best-sellers come from Top Shelf. George Takei’s They Called Us Enemy (#2) sells nearly 44k this year, while the award-winning March is #3 for Book One (23k) and #7 for Book Three (13k) – Book Two hammocks with just 5300 copies sold, so weird how people buy things!!
Here is IDW’s Long Tail for 2023 – solid growth!
| Year | # of listed items | Percent Change | Total Unit Sold | Percent Change | Calculated Retail value | Percent Change | Av. Sale per title | Av $ per title |
| 2007 | 233 | —— | 102,118 | —— | $2,090,647 | —– | 438 | $8,973 |
| 2008 | 335 | 43.78% | 146,125 | 43.09% | $2,766,505 | 32.33% | 436 | $8,258 |
| 2009 | 477 | 42.39% | 215,907 | 47.76% | $4,346,836 | 57.12% | 453 | $9,113 |
| 2010 | 623 | 30.61% | 161,578 | -25.16% | $3,653,680 | -15.95% | 259 | $5,865 |
| 2011 | 785 | 26.00% | 206,136 | 27.58% | $4,884,606 | 33.69% | 263 | $6,222 |
| 2012 | 937 | 19.36% | 162,599 | -21.12% | $4,329,973 | -11.35% | 174 | $4,621 |
| 2013 | 1059 | 13.02% | 180,694 | 11.13% | $4,443,372 | 2.62% | 171 | $4,196 |
| 2014 | 1134 | 7.08% | 228,895 | 26.68% | $5,309,992 | 19.50% | 200 | $4,641 |
| 2015* | 959 | -15.43% | 310,512 | 35.66% | $6,478,023 | 22.00% | 324 | $6,755 |
| 2016* | 978 | 1.98% | 343,197 | 10.53% | $8,194,098 | 26.49% | 351 | $8,378 |
| 2017 | 1639 | 67.59% | 346,368 | 0.92% | $8,278,617 | 1.03% | 211 | $5,051 |
| 2018 | 1811 | 10.05% | 279,435 | -19.32% | $6,525,696 | -21.17% | 154 | $3,603 |
| 2019 | 1817 | 0.33% | 330,051 | 18.11% | $7,443,310 | 14.06% | 182 | $4,096 |
| 2020 | 1906 | 4.90% | 527,405 | 59.80% | $12,365,146 | 66.12% | 277 | $6,487 |
| 2021 | 1979 | 3.83% | 512,757 | -2.78% | $12,723,523 | 2.90% | 259 | $6,429 |
| 2022 | 1898 | -4.09% | 567,910 | 10.76% | $14,192,263 | 11.54% | 299 | $7,477 |
| 2023 | 1879 | -1.00% | 602,982 | 6.18% | $16,056,897 | 13.14% | 321 | $8,545 |
IDW has one book over 100k, three books over 20k, and another two over 10k.
 Dropping to the #7 publisher in the Top 750 is DC Comics. DC spent a really long time as the #1 Western publisher before losing it to Scholastic, and was at least #2 until 2018. If there was a traditional Direct Market publisher that already had all of the tools they needed to compete in the book market (at least, before AT&T Discovery started laying people off) it was DC, but modern DC can’t get much traction in the book market any longer, so it seems to me that the brain drain from their cost-cutting layoffs has done them dramatically more harm than good.
In 2023 they placed just 14 titles in the Top BookScan 750 for 215k units, and $4.6 million in calculated retail price. This is DC’s worst sales performace in the Top 750 since 2004. Down in the long tail we can still track America’s Best Comics, Black Label, DC Ink, CMX, Jinxworld, Paradox, Mad, Minx, Vertigo, Wildstorm, and Zoom – makes you wonder how stores still have those handful of copies to sell of imprints that in some cases have been defunct for two decades now! But a certain amount of this should be wholly in DC’s control as they control their metadata.
Here’s a year-to-year comparison chart of the Top 750 for DC (Because I started from my first BookScan survey with a complete Direct Market bias, but I hate throwing away charts, especially ones with twenty-one years of provenance):
| Year | # of placing titles | Unit sales | Calculated Retail price |
| 2003 | 74 | 336,569 | $6,151,258 |
| 2004 | 39 | 179,440 | $3,135,983 |
| 2005 | 42 | 298,484 | $5,440,001 |
| 2006 | 59 | 551,160 | $10,246,082 |
| 2007 | 58 | 487,467 | $9,953,976 |
| 2008 | 71 | 1,015,864 | $19,805,098 |
| 2009 | 93 | 1,223,733 | $24,061,834 |
| 2010 | 96 | 648,403 | $12,523,128 |
| 2011 | 107 | 660,706 | $13,083,378 |
| 2012 | 104 | 688,870 | $14,811,979 |
| 2013 | 130 | 767,686 | $15,620,981 |
| 2014 | 131 | 931,239 | $19,207,755 |
| 2015* | 119 | 1,074,304 | $21,701,088 |
| 2016* | 117 | 1,234,047 | $23,203,071 |
| 2017 | 101 | 827,544 | $15,234,525 |
| 2018 | 47 | 360,414 | $7,810,753 |
| 2019 | 33 | 413,923 | $9,691,574 |
| 2020 | 29 | 442,163 | $10,332,226 |
| 2021 | 17 | 396,475 | $8,335,338 |
| 2022 | 20 | 396,743 | $8,986,139 |
| 2023 | 14 | 214,583 | $4,614,151 |
2023 is not very good for DC in the Top 750.
DC’s #1 book via Circana BookScan reporters in 2023 is Teen Titans: Robin by Kami Garcia and Gabriel Picola, which sells 34k. This is v4 of the YA Titans graphic novel series, originally branded as being from Zoom. V3, Teen Titans: Beast Boy Loves Raven is #10, selling a little bit over 10k.
At #2 is the paperback of Alan Moore & Dave Gibbon’s Watchmen, for about 24k copies, while the hardcover edition is #9, with almost 11k more sold.
At #3 is Neil Gaiman’s Sandman where the new reformatted Book One sells 23k copies. Book Two only sells about 8300 copies, I will repeat what I said last year: As a bookseller, I’m pretty certain that moving to four $40 volumes, as opposed to ten $20 volumes a) depressed the maximize size of the audience (since far fewer people will “jump in” at the more expensive initial price point) and 2) cost them money in absolute terms ($80 vs $200 for the entire story), but I guess that’s why I “just” sell comics for a living.
This is followed by five Batman comics – Year One by Frank Miller and David Mazzucchelli is #4 (19k copies sold), I am a little surprised that the next is Batman ‘89 at #5 – a continuation of the original Tim Burton film – with about 16k sold. Killing Joke by Alan Moore and Brian Bolland is #6 (15k), while Scott Snyder & Jock’s The Batman Who Laughs is #7 (12k). Then at #8 I see a place where I messed up and miscategorized v1 of Joker: One Operation Joker by Satoshi Miyagawa, which sold 11k – that should have been in Manga! As should have Batman: Justice Buster v1 which sells under 10k. I will get those cleaned up for next year. It is worth noting that Viz’s Spider-Man manga sold nearly 50k, so these could be considered an under-performance. Either way, there’s no other “traditional” Batman comic (Dark Knight Returns, Hush, Long Halloween, Court of Owls, etc) that sells even 10k copies, which is genuinely confounding to this viewer.
The only other book that sells over 10k for DC in 2023, as reported by BookScan, is V For Vendetta by Alan Moore and David Lloyd. And that’s only by a few hundred copies.
2022 had showed some good legs for Young Adult and Middle Reader DC comics, but 2023 washed a lot of that away. Except for the above noted YA Teen Titans comics, the next most successful in 2023 is “Primer” which does less than 9k this year – dropped substantially from 14k last year. I was also a little surprised to see a fairly low number for the webtoon-originated Batman: Wayne Family Adventures where v1 only trickled in about 6700 copies. And let’s maybe try to forget the other webtoon titles Zatanna and the House of Secrets or Vixen NYC where v1 of those didn’t even sell enough copies to pay for the printing costs – 757 and 302 respectively. But if DC can’t sell traditional versions of their characters, and they are also not getting traction with either manga or YA-focused webtoon-first material, then it isn’t really looking very good for them, if you ask this observer.
Here’s DC’s Long Tail – and it is the single worst year we have ever recorded for them, despite having the most number of SKUs ever tracking.
| Year | # of listed items | % Change | Total Pieces | % Change | Calculated Retail Value | % Change | Av. Sale per title | Av $ per title |
| 2007 | 1644 | — | 1,181,218 | — | $22,033,212 | — | 719 | $13,402 |
| 2008 | 2057 | 25.12% | 1,719,330 | 45.56% | $33,609,704 | 52.54% | 836 | $16,339 |
| 2009 | 2264 | 10.06% | 1,902,181 | 10.64% | $37,816,864 | 12.52% | 840 | $16,704 |
| 2010 | 2442 | 7.86% | 1,320,262 | -30.59% | $25,982,910 | -31.29% | 541 | $10,640 |
| 2011 | 2423 | -0.07% | 1,323,630 | 0.26% | $27,130,811 | 4.42% | 546 | $11,197 |
| 2012 | 2452 | 1.20% | 1,206,198 | -8.87% | $26,729,997 | -1.48% | 492 | $10,901 |
| 2013 | 2551 | 4.04% | 1,369,850 | 13.57% | $29,881,153 | 11.79% | 537 | $11,714 |
| 2014 | 2746 | 7.64% | 1,638,901 | 19.64% | $35,388,570 | 18.43% | 597 | $12,887 |
| 2015* | 1690 | -38.46% | 1,997,577 | 21.89% | $43,031,546 | 21.60% | 1,182 | $25,462 |
| 2016* | 1214 | -28.17% | 2,262,888 | 13.82% | $47,963,215 | 11.46% | 1,864 | $39,508 |
| 2017 | 3152 | 259.64% | 1,948,037 | -13.91% | $42,921,514 | -10.51% | 618 | $13,617 |
| 2018 | 3364 | 6.73% | 1,333,836 | -31.53% | $31,844,186 | -25.81% | 397 | $9,466 |
| 2019 | 3229 | -4.01% | 1,303,807 | -2.25% | $33,428,626 | 4.98% | 404 | $10,353 |
| 2020 | 3668 | 13.59% | 1,338,405 | 2.65% | $36,315,104 | 8.63% | 365 | $9,901 |
| 2021 | 3905 | 3.46% | 1,694,306 | 26.59% | $49,650,333 | 36.72% | 434 | $12,715 |
| 2022 | 3985 | 0.20% | 1,466,165 | -13.47% | $43,450,832 | -12.49% | 368 | $10,904 |
| 2023 | 4011 | 0.65% | 1,095,006 | -25.31% | $33,170,363 | -23.66% | 273 | $8,270 |
DC has three books over 20k, and just eight more that come in over 10k.
It is a massive four-position surge forward for #8 of the Western Publishers in the Top 750, and it’s another of the “Big Five” traditional book publishers with Simon & Schuster. They manage to place nine titles into this year’s Top 750. These nine titles place 198k copies, for about $2.6m in calculated dollar sales.
Simon has several imprints, including Aladdin, Atria, Atheneum, Free Press, Gallery 13, Little Simon, Margaret K. Elderberry, Pocket, Scribner, and Touchstone, though not all of those imprints made it into the Top 750.
Simon’s #1 book is the kids-aimed Spy School (36k sold), from their self-named Simon For Younger Readers imprint, in addition to placing Spy Camp (#4, 24k sold). Both are by Stuart Gibbs.
From Aladdin is Keeper of the Lost Cities: The Graphic Novel, Part 1 V1 by Shannon Messenger, at #2, with 30k sold.
The Atheneum imprint places two books: Bunnicula by James Howe (#5, 18k), and Long Way Down by Jason Reynolds (#9, 13k)
From Little Simon is The Coldfire Curse by Jordan Quinn (#6, 16k)
Simon Spotlight has three books, all by Coco Simon: Katie and the Cupcake Cure” (#3, 29k), Emma on the Thin Icing (#7, 16k) and Mia in the Mix (#8, 16k)
Nothing other than that sells 10k
Here is Simon & Schuster’s Long Tail for 2023, very solid growth!
| Year | # of listed items | % Change | Total Pieces | % Change | Calculated Retail Value | % Change | Av. Sale per title | Av $ per title |
| 2007 | 12 | — | 8,317 | — | $158,014 | — | 693 | $13,168 |
| 2008 | 26 | 116.67% | 14,917 | 79.36% | $211,798 | 34.04% | 574 | $8,146 |
| 2009 | 41 | 57.69% | 109,558 | 634.45% | $1,430,544 | 575.43% | 2,672 | $34,891 |
| 2010 | 46 | 12.20% | 214,828 | 96.09% | $2,660,094 | 85.95% | 4,670 | $57,828 |
| 2011 | 62 | 34.78% | 187,531 | -12.71% | $2,383,491 | -10.40% | 3,025 | $38,443 |
| 2012 | 63 | 1.61% | 165,831 | -11.57% | $2,844,453 | 19.34% | 2,632 | $45,150 |
| 2013 | 67 | 6.35% | 258,931 | 56.14% | $4,165,350 | 46.44% | 3,865 | $62,169 |
| 2014 | 71 | 5.97% | 383,878 | 48.25% | $6,520,821 | 26.55% | 5,407 | $91,843 |
| 2015* | 75 | 5.63% | 910,341 | 237.14% | $13,386,461 | 205.29% | 12,138 | $178,486 |
| 2016* | 75 | —— | 618,922 | -32.01% | $9,477,798 | -29.20% | 8,252 | $126,371 |
| 2017 | 89 | 18.67% | 449,243 | -27.42% | $6,788,432 | -28.38% | 5,048 | $76,275 |
| 2018 | 88 | -1.12% | 38,804 | -91.36% | $739,664 | -89.10% | 441 | $8,405 |
| 2019 | 100 | 13.64% | 80,795 | 108.21% | $1,502,286 | 103.10% | 808 | $15,023 |
| 2020 | 128 | 28.00% | 93,785 | 16.08% | $1,841,672 | 22.59% | 733 | $14,388 |
| 2021 | 193 | 50.78% | 247,842 | 164.27% | $3,454,596 | 87.58% | 1,284 | $17,899 |
| 2022 | 287 | 48.70% | 344,299 | 38.92% | $4,526,426 | 31.03% | 1,200 | $15,772 |
| 2023 | 367 | 27.87% | 434,478 | 26.19% | $6,294,866 | 39.06% | 1,184 | $17,152 |
[Almost all of that 2018 drop was my reconsidering hybrid-prose books like Rachel Renee Russell’s “Dork Diaries” as not properly being “comics”, so that was on me, not them!]
Simon & Schuster has four books over 20k, and five more books over 10k in 2023.
Coming in at publisher #9 in the Top 750 for 2023’s BookScan is religious publisher David C Cook who publishes Sergio Cariello’s The Action Bible: God’s Redemptive Story. The book sells 167k copies – a really substantial number of copies, in fact, the eleventh best-selling book of the year, and up significantly from last year’s 107k sold.. I’m not going to make a formal long tail here, since they publish nothing else that does nearly as well – their next best-selling book is The Action Bible Christmas: 25 Stories About Jesus’ Arrival which doesn’t even pull in 6800 sold. But still: really register that those over 167k copies is more than a few publishers sell annually for everything they publish combined!
 And closing out the Top Ten publishers for the Circana BookScan Top 750 this year, at #10, while not considered one of the book world’s “Big Five”, is Harry N. Abrams. They are also not considered a traditional Direct Market publisher, putting out Abrams Comicarts, Harry N. Abrams, as well as Amulet Books. They distribute, but do not publish, U.K. publisher SelfMadeHero, and are distributed themselves by Hachette. Abrams places nine books that they publish, selling 137k copies for $2.2m in calculated dollars.
Abrams’ best-seller in 2023 is from the Abrams imprint: #1 is Nathan Hale’s Hazardous Tales v12: Above the Trenches which sells 26k. From the same series is v11 Cold War Correrespondent at #4 (13k), v7 Raid of No Return at #6 (12k), v4 Treaties, Trenches, Mud and Blood at #7 (12k), and v1 One Dead Spy at #9 with about 9400 sold.
Also placing from Abrams is Spider-Man: Animals Assemble (#3, 17k… and selling better than any native-to-Marvel title), Matthew Gubler’s The Little Kid With the Big Green Hand (#5, 12k), and The Best We Can Do by Thi Bui (#8, 10k)
Finally, from the Amulet imprint is El Deafo by Cece Bell as their #2 best-seller, selling 25k copies.
Here is your long-tail, with some reasonable growth:
| Year | # of listed items | Percent Change | Total Unit Sold | Percent Change | Calculated Retail value | Percent Change | Av. Sale per title | Av $ per title |
| 2008 | 3 | —— | 10,031 | —— | $148,675 | —— | 3,344 | $49,558 |
| 2009 | 25 | 733.33% | 24,116 | 140.41% | $640,635 | 330.90% | 965 | $25,625 |
| 2010 | 41 | 64.00% | 48,240 | 100.03% | $1,109,444 | 73.18% | 1,177 | $27,060 |
| 2011 | 49 | 19.51% | 31,846 | -33.98% | $731,054 | -34.11% | 650 | $14,919 |
| 2012 | 62 | 26.53% | 37,522 | 17.82% | $756,650 | 3.50% | 605 | $12,204 |
| 2013 | 70 | 12.90% | 72,538 | 93.32% | $3,278,063 | 333.23% | 1,036 | $46,829 |
| 2014 | 88 | 25.71% | 74,083 | 2.13% | $2,324,820 | -29.10% | 842 | $26,418 |
| 2015* | 92 | 4.55% | 145,633 | 96.58% | $1,898,267 | -18.35% | 1,583 | $20,633 |
| 2016* | 112 | 21.74% | 177,127 | 21.63% | $2,326,956 | 22.58% | 1,581 | $20,776 |
| 2017 | 124 | 10.71% | 248,580 | 40.34% | $3,449,807 | 48.25% | 2,005 | $27,821 |
| 2018 | 138 | 11.29% | 258,334 | 3.92% | $3,776,138 | 9.46% | 1,872 | $27,363 |
| 2019 | 148 | 7.25% | 265,300 | 2.70% | $4,089,631 | 8.30% | 1,791 | $27,633 |
| 2020 | 152 | 2.70% | 306,087 | 15.37% | $4,891,229 | 19.60% | 2,014 | $32,179 |
| 2021 | 181 | 19.08% | 372,948 | 21.84% | $6,803,571 | 39.10% | 2,060 | $37,589 |
| 2022 | 212 | 17.13% | 336,512 | -9.77% | $6,279,071 | -7.71% | 1,587 | $29,618 |
| 2023 | 250 | 17.92% | 362,117 | 7.61% | $6,610,786 | 5.28% | 1,448 | $26,443 |
Abrams has two books over 20k, and six more over 10k in 2023.
That is it for the top ten publishers within the Top 750 of BookScan 2023, but there’s a few more publishers that are worth singling out for attention because they have a historical importance, they are significant for either the book or comics markets, they are growing, or there is otherwise something of note about them!
Since this is a report on bookstore sales, let’s start with the last of the mainstream book world’s “Big Five”: Hachette, which includes the imprints of Algonquin, Atria, Back Bay, Basic Books, Black Dog & Leventhal, Bold Type, Carrol & Graf, Da Capo, Grand Central, Hodder, Ilex, Jimmy Patterson, JY, Little Brown, Nation Books, Orchard, Orion, Running Press, Trapeze, Virago, Voracious, Warner Books and Workman in the Long Tail. In the Top 750 only JY places anything, and it is just three books, selling 76k copies and $987k. They also publish manga as Yen which is up above in the previous manga section.
The JY imprint is home to Svetlana Chmakova’s work, and her three books are the only placers within the Top 750: Enemies (#1 with 38k sold), Awkward (#2 with 24k sold, and Crush (#3, with 14k sold). None of their other imprints manage to score any titles at 10k or over.
Here’s the Long Tail of just the Western books for Hachette. It’s not looking good in 2023
| Year | # of listed items | Percent Change | Total Unit Sold | Percent Change | Calculated Retail value | Percent Change | Av. Sale per title | Av $ per title |
| 2007 | 15 | —— | 39,181 | —— | $689,383 | —— | 2,612 | $45,959 |
| 2008 | 18 | 20.00% | 37,519 | -4.24% | $596,609 | -13.46% | 2,084 | $33,145 |
| 2009 | 18 | —— | 40,172 | 7.07% | $642,935 | 7.76% | 2,232 | $35,719 |
| 2010 | 19 | 5.56% | 160,992 | 300.76% | $3,097,996 | 381.85% | 8,473 | $163,052 |
| 2011 | 24 | 26.32% | 88,131 | -45.26 | $1,273,500 | -58.89% | 3,672 | $53,063 |
| 2012 | 28 | 16.67% | 110,897 | 25.83% | $1,565,744 | 22.95% | 3,961 | $55,919 |
| 2013 | 24 | -14.29% | 39,093 | -65.75% | $584,783 | -62.65% | 1,629 | $24,366 |
| 2014 | 32 | 33.33% | 38,853 | -0.61% | $593,667 | 1.52% | 1,214 | $18,552 |
| 2015* | 30 | -0.63% | 61,539 | 58.39% | $830,047 | 39.82% | 2,051 | $27,668 |
| 2016* | 56 | 86.67% | 81,648 | 32.68% | $1,654,511 | 99.33% | 1,458 | $29,545 |
| 2017 | 78 | 39.29% | 220,591 | 170.17% | $2,998,501 | 81.23% | 2,828 | $38,442 |
| 2018 | 203 | 260.26% | 363,575 | 64.82% | $4,541,954 | 51.47% | 1,791 | $22,374 |
| 2019 | 152 | -25.12% | 356,334 | -1.99% | $4,469,594 | -1.59% | 2,344 | $29,405 |
| 2020 | 216 | 42.11% | 359,018 | 0.75% | $5,141,443 | 15.03% | 1,662 | $23,803 |
| 2021 | 261 | 20.83% | 382,223 | 6.46% | $5,411,286 | 5.25% | 1,464 | $20,733 |
| 2022 | 270 | 3.45% | 360,902 | -5.58% | $4,894,962 | -9.54% | 1,337 | $18,129 |
| 2023 | 315 | 16.67% | 286,171 | -20.71% | $4,046,436 | -17.33% | 908 | $12,846 |
And if you add the Manga from Yen, the combined total looks slightly better, like this:
| Year | # of listed items | Percent Change | Total Unit Sold | Percent Change | Calculated Retail value | Percent Change | Av. Sale per title | Av $ per title |
| 2007 | 25 | —— | 52,077 | —— | $836,832 | —– | 2,083 | $33,473 |
| 2008 | 108 | 332.00% | 147,645 | 183.51% | $1,834,469 | 119.22% | 1,367 | $16,986 |
| 2009 | 229 | 112.04% | 371,134 | 151.37% | $4,340,048 | 132.78% | 1,621 | $18,952 |
| 2010 | 363 | 58.52% | 721,975 | 94.53% | $9,748,867 | 124.63% | 1,999 | $26,856 |
| 2011 | 484 | 33.33% | 852,256 | 18.05% | $11,227,466 | 15.17% | 1,761 | $23,197 |
| 2012 | 576 | 19.01% | 758,845 | -10.96% | $10,301,009 | -8.25% | 1,317 | $17,884 |
| 2013 | 678 | 17.71% | 731,473 | -3.61% | $10,300,204 | —– | 1,079 | $15,192 |
| 2014 | 808 | 19.17% | 720,988 | -1.43% | $10,579,169 | 2.71% | 892 | $13,093 |
| 2015* | 742 | -8.17% | 994,407 | 37.92% | $14,304,955 | 35.22% | 1,340 | $19,279 |
| 2016* | 849 | 14.42% | 1,153,656 | 16.01% | $17,174,718 | 20.06% | 1,359 | $20,229 |
| 2017 | 1481 | 74.44% | 1,199,553 | 3.98% | $16,865,176 | -1.80% | 810 | $11,388 |
| 2018 | 1940 | 30.99% | 1,253,803 | 4.52% | $17,593,705 | 4.32% | 646 | $9,069 |
| 2019 | 1998 | 2.99% | 1,240,930 | -1.03% | $17,477,769 | -0.66% | 621 | $8,748 |
| 2020 | 2226 | 11.41% | 1,449,020 | 16.77% | $20,939,201 | 19.80% | 651 | $9,407 |
| 2021 | 2408 | 8.18% | 3,400,677 | 134.69% | $49,107,307 | 134.52% | 1,412 | $20,393 |
| 2022 | 2567 | 6.60% | 3,585,248 | 5.43% | $52,808,456 | 7.54% | 1,397 | $20,572 |
| 2023 | 2972 | 15.78% | 3,156,714 | -11.95% | $48,647,036 | -7.88% | 1,062 | $16,368 |
Hachette has two titles over 20k, and one more over 10k, on the Western charts.
While not one of the “Big Five”, Hyperion/Disney Press is also a bookmarket-first publisher who has books in the Top 750. They place four books, which sell 79k, or $896k calculated
Disney Press / Hyperion is, like Marvel, also owned by Disney. Technically, that probably means I should fold them together like I do with the various individual companies that make up a publisher like Penguin Random House, but I resist, how I resist (largely because they have been distributed completely separately prior to this year where everything is now through Penguin Random House). But I have to point out that once again, Hyperion/Disney Press did better than Marvel did – Hyperion would be the #13 publisher in the Top 750, while Marvel would have only been #16. Even combined they still would only have been #11
Their best-selling title is Spidey and His Amazing Friends: Team Spidey Does It All! with 36k sold. Again: that’s the fourth publisher that sells more copies of Marvel products than Marvel itself. This is followed by the adaptation of Percy Jackson: The Lightning Thief (18k), then Gravity Falls: Lost Legends (15k), with Part of Your World: A Twisted Tale just over 10k.
Here is the Long Tail for Hyperion/Disney. Finally reversing their plunge, perhaps due to the switch in distribution to Penguin Random House.
| Year | # of listed items | Percent Change | Total Unit Sold | Percent Change | Calculated Retail value | Percent Change | Av. Sale per title | Av $ per title |
| 2007 | 10 | —– | 39,121 | —– | $336,771 | —– | 3,912 | $33,677 |
| 2008 | 19 | 90.00% | 41,005 | 4.82% | $409,051 | 21.46% | 2,158 | $21,529 |
| 2009 | 24 | 26.32% | 23,301 | -43.18% | $234,078 | -42.78% | 971 | $9,753 |
| 2010 | 26 | 8.33% | 30,860 | 32.44% | $314,067 | 34.17% | 1,187 | $12,080 |
| 2011 | 29 | 11.54% | 46,553 | 50.85% | $392,652 | 25.02% | 1,605 | $13,540 |
| 2012 | 31 | 6.90% | 33,105 | -28.89% | $376,735 | -4.05% | 1,068 | $12,153 |
| 2013 | 33 | 6.45% | 102,537 | 209.73% | $1,298,672 | 244.72% | 3,107 | $39,354 |
| 2014 | 38 | 15.15% | 77,045 | -24.86% | $1,015,188 | -21.83% | 2,028 | $26,715 |
| 2015* | 57 | 50.00% | 63,290 | -17.85% | $831,477 | -18.10% | 1,110 | $14,587 |
| 2016* | 36 | -36.84% | 61,730 | -2.46% | $926,504 | 11.43% | 1,715 | $25,736 |
| 2017 | 41 | 13.89% | 99,589 | 61.33% | $1,592,970 | 71.93% | 2,429 | $38,853 |
| 2018 | 54 | 31.71% | 132,623 | 33.17% | $2,228,412 | 39.89% | 2,456 | $41,267 |
| 2019 | 63 | 16.67% | 158,896 | 19.81% | $2,473,413 | 10.99% | 2,522 | $39,261 |
| 2020 | 49 | -22.22% | 149,565 | -5.82% | $2,362,499 | -4.48% | 3,052 | $48,214 |
| 2021 | 45 | -8.16% | 125,017 | -16.41% | $1,966,885 | -16.75% | 2,778 | $43,709 |
| 2022 | 43 | -4.44% | 86,720 | -30.63% | $1,291,665 | -34.33% | 2,017 | $30,039 |
| 2023 | 50 | 16.28% | 140,717 | 62.27% | $1,828,771 | 41.58% | 2,814 | $36,575 |
Hyperion/Disney has one book over 20k, and three more books over 10k.
Also very not a “Big Five” bookstore publisher is Candlewick, who manages to get two books into the Top 750 this year – this looks like the first time ever, despite them being a publisher of some longevity (since 1992). These books are Hoops: A Graphic Novel by Matt Tavares (17k sold) and Tom Angleberger’s Two Headed Chicken from the Walker Books imprint which is the lowest selling book on the Top 750, with just 9639 sold.
If Candlewick can place two books next year too, I’ll go back and build the historical long tail! Otherwise, they just have one book over 10k.
THE DIRECT MARKET FAVES
Outside of those bookstore-native publishers, we’ve got a couple of publishers who placed more than two titles into the Top 750. All three of these are Direct Market-natives.
Let’s do them in Alphabetical order?
First up is Dark Horse Comics. They place three titles into the Top 750 for 52k, and $972k in calculated retail value.
Dark Horse’s Western best-seller is Minecraft (v1 is #1, with 23k sold). Next comes Avatar: The Last Airbender, where the large paperback omnibus format is the king. At #2 (18k) is The Search, while at #3 (11k) is The Promise
Here’s what Dark Horse’s Western performance looks like in the Long Tail. Second year down.
| Year | # of listed items | Percent Change | Total Unit Sold | Percent Change | Calculated Retail value | Percent Change | Av. Sale per title | Av $ per title |
| 2007 | 597 | —— | 413,022 | —— | $7,607,264 | —– | 692 | $14,745 |
| 2008 | 734 | 22.95% | 552,815 | 33.85% | $9,329,828 | 22.64% | 753 | $12,711 |
| 2009 | 798 | 8.72% | 455,924 | -17.53% | $7,757,240 | -16.86% | 571 | $9,721 |
| 2010 | 955 | 19.67% | 445,248 | -2.34% | $7,852,063 | 1.22% | 466 | $8,222 |
| 2011 | 1025 | 7.33% | 389,514 | -12.52% | $7,102,710 | -9.54% | 380 | $6,929 |
| 2012 | 1133 | 10.54% | 377,322 | -3.13% | $6,907,772 | -2.74% | 333 | $6,097 |
| 2013 | 1238 | 9.27% | 383,391 | 1.61% | $7,391,831 | 7.01% | 310 | $5,971 |
| 2014 | 1420 | 14.70% | 421,708 | 9.99% | $8,982,411 | 21.52% | 297 | $6,326 |
| 2015* | 947 | -33.31% | 376,231 | -10.78% | $8,120,937 | –9.59% | 397 | $8,575 |
| 2016* | 877 | -7.39% | 461,297 | 22.61% | $9,076,526 | 11.77% | 526 | $10,350 |
| 2017 | 1598 | 82.21% | 478,658 | 3.76% | $9,256,795 | 1.99% | 300 | $5,793 |
| 2018 | 1615 | 1.06% | 485,919 | 1.52% | $9,410,362 | 1.66% | 301 | $5,827 |
| 2019 | 1612 | -0.18% | 459,996 | -5.33% | $9,617,364 | 2.20% | 285 | $5,966 |
| 2020 | 1686 | 4.59% | 971,551 | 111.21% | $20,408,830 | 112.21% | 576 | $12,105 |
| 2021 | 1894 | 12.34% | 988,766 | 1.77% | $22,230,359 | 8.93% | 522 | $11,737 |
| 2022 | 1930 | 1.90% | 806,402 | -18.44% | $18,718,651 | -15.80% | 418 | $9,699 |
| 2023 | 2002 | 3.73% | 627,703 | -22.16% | $14,977,650 | -19.99% | 314 | $7,481 |
Dark Horse, on the Western charts alone, has one title over 20k, and two more over 10k.
Dark Horse’s Manga offerings are up in that section. Dark Horse is one of the rare publishers that does a significant business in both Eastern and Western comics, and I’m sure they’d prefer all of their numbers to be represented together. In which case, their Long Tail actually looks like this:
| Year | # of listed items | Percent Change | Total Unit Sold | Percent Change | Calculated Retail value | Percent Change | Av. Sale per title | Av $ per title |
| 2007 | 938 | —— | 662,965 | —— | $10,936,728 | —– | 707 | $11,660 |
| 2008 | 1075 | 14.61% | 801,796 | 20.94% | $12,506,698 | 14.36% | 746 | $11,634 |
| 2009 | 1253 | 16.56% | 682,421 | -14.89% | $10,672,933 | -14.66% | 545 | $8,518 |
| 2010 | 1428 | 13.97% | 639,742 | -6.25% | $10,485,140 | -1.76% | 448 | $7,343 |
| 2011 | 1522 | 6.58% | 578,843 | -9.52% | $9,704,940 | -7.44% | 380 | $6,376 |
| 2012 | 1626 | 6.83% | 489,695 | -15.40% | $8,538,810 | -12.02% | 301 | $5,251 |
| 2013 | 1759 | 8.18% | 486,929 | -0.56% | $9,070,394 | 6.23% | 277 | $5,157 |
| 2014 | 1979 | 12.51% | 522,602 | 7.33% | $10,599,661 | 16.86% | 264 | $5,356 |
| 2015* | 1250 | -36.84% | 511,675 | -2.09% | $10,359,104 | -2.27% | 409 | $8,287 |
| 2016* | 1102 | -11.84% | 635,595 | 24.22% | $11,367,881 | 9.74% | 577 | $10,316 |
| 2017 | 2125 | 92.83% | 716,747 | 12.77% | $20,624,676 | 81.43% | 337 | $9,706 |
| 2018 | 2146 | 0.99% | 709,929 | -0.09% | $12,989,497 | -37.02% | 331 | $6,053 |
| 2019 | 2023 | -5.73% | 977,155 | 37.64% | $19,467,752 | 49.87% | 483 | $9,623 |
| 2020 | 2158 | 6.67% | 1,402,313 | 43.51% | $31,520,184 | 61.91% | 650 | $14,606 |
| 2021 | 2325 | 7.74% | 1,998,293 | 42.50% | $49,184,722 | 56.04% | 859 | $21,155 |
| 2022 | 2385 | 2.59% | 1,919,662 | -3.93% | $57,801,617 | 17.52% | 805 | $24,235 |
| 2023 | 2363 | -0.92% | 1,577,449 | -17.83% | $49,915,926 | -13.64% | 668 | $21,124 |
Everything down this year – however bear in mind this does not take sales in the DM itself into account.
 Image Comics comes next. Image has seven titles placing within the Top 750 in 2023, which sell 120k copies, for a bit over $6m
Because Image is a primarily Direct Market retailer, we’ve always built a special year-by-year chart for them in the Top 750 (Hey! I have my own biases!), and this is what Image’s performance has looked like over the years:
| Year | # of placing titles | Unit sales | Calculated
Retail Value |
| 2003 | 1 | 2,328 | $30,148 |
| 2004 | 1 | 402 | $5,206 |
| 2005 | 3 | 8,699 | $100,236 |
| 2006 | 1 | 5,311 | $113,465 |
| 2007 | 4 | 28,349 | $344,026 |
| 2008 | 9 | 55,033 | $830,574 |
| 2009 | 11 | 78,874 | $1,210,094 |
| 2010 | 22 | 289,044 | $6,479,930 |
| 2011 | 27 | 367,265 | $8,670,917 |
| 2012 | 33 | 701,050 | $20,389,762 |
| 2013 | 38 | 651,390 | $19,371,269 |
| 2014 | 47 | 691,804 | $17,554,492 |
| 2015 | 71 | 878,262 | $22,587,672 |
| 2016 | 72 | 908,655 | $22,917,758 |
| 2017 | 52 | 556,196 | $11,092,960 |
| 2018 | 42 | 402,584 | $7,611,777 |
| 2019 | 26 | 223,569 | $5,446,399 |
| 2020 | 6 | 55,711 | $1,927,993 |
| 2021 | 5 | 111,451 | $6,863,339 |
| 2022 | 5 | 89,662 | $4,933,090 |
| 2023 | 7 | 120,333 | $6,041,659 |
Nice to see Image back up again, in the Top 750.
The #1 book for Image was v1 of the $65 Invincible Compendium, which sold a solid 33k copies via Circana BookScan reporters, while v2 was #2 (22k) and v3 was #3 (17k). And to continue Robert Kirkman’s streak, you can find at #5 the first volume of the Walking Dead Compendium (13k)
Following that is Brian K Vaughan and Fiona Staples’ Saga where v10 is #4, with 14k, while v11 is #6 with 11k.
Bringing up the back of the Top 750 is Zoe Thorogood’s It’s Lonely at the Centre of the Earth (#7, about 9900 copies sold)
Here’s what Image’s Long Tail looks like. Another down year. This could change meaningfully in 2024 as Simon & Schuster takes over their bookstore distribution from Diamond Books? (Simon is their new distributor for bookstores as of Q3 2023)
| Year | # of listed items | Percent Change | Total Unit Sold | Percent Change | Calculated Retail Value | Percent Change | Av. Sale per title | Av $ per title |
| 2007 | 438 | —— | 116,015 | —— | $2,313,477 | —– | 265 | $5,282 |
| 2008 | 515 | 17.58% | 121,001 | 4.30% | $2,445,765 | 5.72% | 235 | $4,749 |
| 2009 | 571 | 10.87% | 156,466 | 29.31% | $3,207,033 | 31.13% | 274 | $5,617 |
| 2010 | 642 | 12.43% | 359,238 | 229.59% | $8,152,806 | 254.22% | 560 | $12,699 |
| 2011 | 749 | 16.66% | 466,637 | 29.90% | $11,041,187 | 35.43% | 623 | $14,741 |
| 2012 | 868 | 15.89% | 794,419 | 70.24% | $22,797,279 | 106.47% | 915 | $26,264 |
| 2013 | 994 | 14.52% | 776,507 | -2.25% | $22,085,860 | -3.12% | 781 | $22,219 |
| 2014 | 1006 | 1.21% | 830,735 | 6.98% | $20,309,973 | -8.04% | 826 | $20,189 |
| 2015* | 842 | -16.30% | 1,070,299 | 28.84% | $26,175,438 | 28.88% | 1,271 | $31,087 |
| 2016* | 876 | 4.04% | 1,187,316 | 10.93% | $28,267,847 | 7.99% | 1,355 | $32,269 |
| 2017 | 1531 | 174.77% | 938,991 | -20.91% | $18,564,975 | -34.32% | 613 | $12,126 |
| 2018 | 1706 | 11.43% | 769,180 | -18.08% | $14,923,335 | -19.62% | 451 | $8,748 |
| 2019 | 1757 | 2.99% | 641,353 | -16.62% | $14,305,501 | -4.14% | 365 | $8,142 |
| 2020 | 1844 | 4.95% | 511,927 | -20.18% | $11,432,907 | -20.08% | 278 | $6,200 |
| 2021 | 1888 | 2.39% | 707,850 | 38.27% | $19,509,633 | 70.64% | 375 | $10,333 |
| 2022 | 1970 | 4.34% | 622,897 | -12.00% | $17,116,221 | -12.27% | 316 | $8,688 |
| 2023 | 2160 | 9.64% | 572,481 | -8.09% | $16,779,036 | -1.97% | 265 | $7,768 |
Image has just two titles over 20k, and four more over 10k.
And Oni Press wraps up the alphabet in this section. Maia Kobabe’s amazing Gender Queer, which was the most banned book in 2022 AND 2023, is their #1 book. Gotta love it when a plan comes together, because Gender Queer sold a fantastic 31k copies. Thanks blue noses?
At #2 for Oni is the first softcover volume of Scott Pilgrim with a bit over 10k
Here is the Oni Long Tail. They keep swinging back and forth between rise in sales and dropping. But this is an up year!
| Year | # of listed items | Percent Change | Total Unit Sold | Percent Change | Calculated Retail value | Percent Change | Av. Sale per title | Av $ per title |
| 2007 | 125 | —— | 11,294 | —— | $141,829 | —– | 90 | $1,135 |
| 2008 | 138 | 10.40% | 21,843 | 93.40% | $320,799 | 126.19% | 158 | $2,325 |
| 2009 | 149 | 7.97% | 51,584 | 136.13% | $713,121 | 122.30% | 346 | $4,786 |
| 2010 | 156 | 4.70% | 446,791 | 866.14% | $5,882,247 | 824.86% | 2864 | $37,707 |
| 2011 | 177 | 13.46% | 162,275 | -63.68% | $2,786,438 | -52.63% | 917 | $15,743 |
| 2012 | 171 | -3.39% | 80,560 | -50.36% | $1,594,016 | -42.79% | 471 | $9,322 |
| 2013 | 195 | 14.04% | 68,140 | -15.42% | $1,401,748 | -12.06% | 349 | $7,188 |
| 2014 | 213 | 9.23% | 61,584 | -9.62% | $1,303,069 | -7.04% | 289 | $6,118 |
| 2015* | 165 | -22.54% | 65,254 | 5.96% | $1,478,997 | 11.35% | 395 | $8,964 |
| 2016* | 191 | 15.76% | 90,222 | 38.26% | $1,992,643 | 34.73% | 472 | $10,433 |
| 2017 | 283 | 48.17% | 117,950 | 30.73% | $2,847,629 | 42.91% | 417 | $10,062 |
| 2018 | 323 | 14.13% | 108,897 | -7.68% | $2,595,362 | -8.86% | 337 | $8,035 |
| 2019 | 378 | 17.03% | 129,934 | 19.32% | $2,786,185 | 7.35% | 344 | $7,371 |
| 2020 | 460 | 21.69% | 125,464 | -3.44% | $2,599,092 | -6.72% | 273 | $5,650 |
| 2021 | 513 | 11.52% | 195,328 | 55.68% | $3,782,328 | 45.52% | 381 | $7,373 |
| 2022 | 507 | -1.17% | 178,019 | -8.86% | $3,516,734 | -7.02% | 351 | $6.937 |
| 2023 | 495 | -2.37% | 192,444 | 8.10% | $4,216,643 | 19.90% | 389 | $8,518 |
Oni has one book over 20k, and one over 10k
Everyone from here on is just placing a single title in 2023’s BookScan Top 750, but many have Long Tails I have built for a long time. Let’s keep with the alphabetical order, shall we?
First up is Bloomsbury who sells nearly 11k copies of Roz Chast’s newest book, I Must Be Dreaming. Since Bloomsbury has never placed more than a single book, we’ve never built the long tail for them yet. Maybe next year?
Boom! Studios Sells only a single title into the Top 750 this year. Boom! uses the imprints Archaia, Boom, Boom Box, Boom Town, and Kaboom. Boom!’s biggest success is the Keanu Reeves-driven BRZRKR which sells about 9700 copies in the book market.
The Long tail for Boom!:
| Year | # of listed items | Percent Change | Total Unit Sold | Percent Change | Calculated Retail value | Percent Change | Av. Sale per title | Av $ per title |
| 2007 | 21 | —– | 10,462 | —– | $246,984 | —— | 498 | $11,761 |
| 2008 | 44 | 109.52% | 10,943 | 4.60% | $394,361 | 59.67% | 249 | $8,963 |
| 2009 | 93 | 111.36% | 25,378 | 131.91% | $485,485 | 23.11% | 273 | $5,220 |
| 2010 | 202 | 117.20% | 64,770 | 155.22% | $1,140,019 | 134.82% | 321 | $5,644 |
| 2011 | 253 | 25.25% | 75,472 | 16.52% | $1,435,514 | 25.92% | 298 | $5,674 |
| 2012 | 307 | 21.34% | 59,758 | -20.82% | $1,160,894 | -19.13% | 195 | $3,781 |
| 2013 | 347 | 13.03% | 86,637 | 44.98% | $1,650,374 | 42.16% | 250 | $4,756 |
| 2014 | 388 | 11.82% | 108,504 | 25.24% | $1,894,658 | 14.80% | 280 | $4,883 |
| 2015* | 295 | -23.97% | 126,029 | 16.15% | $2,159,071 | 13.96% | 427 | $7,319 |
| 2016* | 309 | 4.75% | 134,386 | 6.63% | $2,313,502 | 7.15% | 435 | $7,488 |
| 2017 | 633 | 104.85% | 171,133 | 27.34% | $2,983,775 | 28.97% | 270 | $4,714 |
| 2018 | 768 | 21.33% | 198,773 | 16.15% | $3,659,046 | 22.63% | 259 | $4,764 |
| 2019 | 825 | 7.42% | 228,120 | 14.76% | $4,344,256 | 18.74% | 277 | $5,266 |
| 2020 | 951 | 15.27% | 236,779 | 3.80% | $4,634,903 | 6.69% | 249 | $4,874 |
| 2021 | 1022 | 7.47% | 295,639 | 24.86% | $5,643,860 | 21.77% | 289 | $5,522 |
| 2022 | 1041 | 1.86% | 230,394 | -22.07% | $4,640,840 | -17.77% | 221 | $4,458 |
| 2023 | 1031 | -0.96% | 198,183 | -13.98% | $4,304,364 | -7.25% | 192 | $4,175 |
Boom! has no book over 10k in 2023.
Cartoon Books is the next in the alphabet with the steady and regular perennial sales of Bone: The Complete Cartoon Epic in his self-published black & white paperback. It sells a pretty dependable and predictable 11k copies. The hardcover edition adds about 700 more. No “Long Tail” chart here for Cartoon – it’s always just the one book.
Cartoon has the one book over 10k.
Drawn & Quarterly places a single book into the Top 750: Kate Beaton’s Ducks: Two Years in the Oil Sands, which sells a bit under 10k in its Sophomore year. It sold 14k in its debut.
Their Long Tail looks right here:
| Year | # of listed items | Percent Change | Total Unit Sold | Percent Change | Calculated Retail value | Percent Change | Av. Sale per title | Av $ per title |
| 2007 | 62 | — | 24,689 | — | $500,764 | — | 398 | $8,077 |
| 2008 | 82 | 32.26% | 42,038 | 70.27% | $912,774 | 82.28% | 513 | $11,131 |
| 2009 | 107 | 30.49% | 42,957 | 2.19% | $920,014 | 0.79% | 401 | $8,598 |
| 2010 | 126 | 17.76% | 44,737 | 4.14% | $1,009,387 | 9.71% | 355 | $8,011 |
| 2011 | 145 | 15.08% | 62,286 | 39.23% | $1,399,793 | 38.68% | 430 | $9,654 |
| 2012 | 155 | 6.90% | 43,098 | -30.81% | $926,233 | -33.83% | 278 | $5,976 |
| 2013 | 189 | 21.94% | 41,887 | -2.81% | $893,905 | 3.49% | 222 | $4,730 |
| 2014 | 205 | 8.47% | 46,030 | 9.90% | $1,032,032 | 15.45% | 225 | $5,034 |
| 2015* | 219 | 6.83% | 73,471 | 59.62% | $1,680,878 | 62.87% | 335 | $7,675 |
| 2016* | 233 | 6.39% | 57,326 | -21.97% | $1,266,170 | -24.67% | 246 | $5,434 |
| 2017 | 247 | 6.01% | 68,087 | 18.77% | $1,548,813 | 22.32% | 276 | $6,271 |
| 2018 | 285 | 15.38% | 79,765 | 17.15% | $2,055,019 | 32.68% | 280 | $7,211 |
| 2019 | 303 | 6.32% | 80,084 | 4.32% | $2,112,455 | 2.79% | 264 | $6,972 |
| 2020 | 329 | 8.59% | 80,384 | 0.37% | $2,302,356 | 8.99% | 244 | $6,177 |
| 2021 | 331 | 0.61% | 80,346 | -0.05% | $1,975,217 | -14.21% | 243 | $5,967 |
| 2022 | 334 | 0.91% | 82,109 | 2.19% | $2,267,686 | 14.81% | 246 | $6,789 |
| 2023 | 354 | 5.99% | 71,450 | -12.98% | $1,996,306 | -11.97% | 202 | $5,639 |
Drawn & Quarterly has no book over 10k in 2023
I am going to keep Dynamite in the alphabetical list because they have a previous long tail. However, they did not place a single book into the Top 750. Their best-seller remains v1 of The Boys Omnibus, but it just sold 8033 copies this year. Dynamite is the largest company that is still using Diamond Books as their distribution into the book market, now that Image left, so I suspect this gives booksellers less reason to order Dynamite books from here out. We shall see.
Here’s Dynamite’s long-tail – this was a very bad year for Dynamite in the book stores.
| Year | # of listed items | Percent Change | Total Unit Sold | Percent Change | Calculated Retail value | Percent Change | Av. Sale per title | Av $ per title |
| 2007 | 21 | —– | 1,082 | —– | $17,861 | —– | 52 | $851 |
| 2008 | 71 | 238.10% | 7,300 | 574.68% | $138,083 | 673.10% | 103 | $1,945 |
| 2009 | 124 | 74.65% | 23,748 | 225.32% | $485,272 | 251.44% | 192 | $3,913 |
| 2010 | 177 | 42.74% | 31,194 | 31.35% | $660,904 | 36.19% | 176 | $3,734 |
| 2011 | 246 | 38.98% | 57,801 | 85.30% | $1,300,079 | 96.71% | 235 | $5,285 |
| 2012 | 288 | 17.07% | 38,798 | -32.88% | $887,083 | -31.77% | 135 | $3,080 |
| 2013 | 347 | 20.49% | 32,296 | -16.76% | $799,021 | -9.93% | 93 | $2,303 |
| 2014 | 405 | 16.71% | 31,528 | -2.38% | $788,130 | -1.36% | 78 | $1,946 |
| 2015* | 192 | -52.59% | 31,452 | -0.24% | $797,977 | 1.25% | 164 | $4,156 |
| 2016* | 174 | -9.38 | 42,280 | 34.43% | $997,956 | 25.06% | 243 | $5,735 |
| 2017 | 552 | 217.24% | 38,053 | -10.00% | $868,682 | -12.95% | 69 | $1,574 |
| 2018 | 630 | 14.13% | 50,538 | 32.81% | $1,227,967 | 41.36% | 80 | $1,949 |
| 2019 | 654 | 3.81% | 81,198 | 60.67% | $2,112,720 | 72.05% | 124 | $3,230 |
| 2020 | 682 | 4.28% | 100,008 | 23.17% | $2,735,911 | 29.50% | 148 | $4,012 |
| 2021 | 662 | -2.93% | 73,595 | -26.41% | $1,971,384 | -27.94% | 111 | $2,978 |
| 2022 | 678 | 2.42% | 87,671 | 19.13% | $2,544,245 | 29.06% | 129 | $3,753 |
| 2023 | 713 | 5.16% | 49,839 | -43.15% | $1,384,048 | -45.60% | 70 | $1,941 |
Dynamite has no book over 10k.
Next is Fantagraphics Books which has one book in Top 750: a bit more than 11k copies of Monica by Daniel Clowes
Fantagraphics hasn’t appeared in this list since 2019 – I had to go back and fill in the missing years for this long tail!: Welcome back!
| Year | # of listed items | Percent Change | Total Unit Sold | Percent Change | Calculated Retail value | Percent Change | Av. Sale per title | Av $ per title |
| 2007 | 201 | — | 35,903 | — | $640,565 | — | 179 | $3,187 |
| 2008 | 239 | 18.91% | 43,675 | 21.65% | $1,126,587 | 75.87% | 183 | $4,714 |
| 2009 | 263 | 10.04% | 46,562 | 6.61% | $1,149,082 | 2.00% | 177 | $4,369 |
| 2010 | 304 | 15.59% | 50,332 | 8.10% | $1,156,205 | 0.62% | 166 | $3,803 |
| 2011 | 339 | 11.51% | 57,278 | 13.80% | $1,327,308 | 14.80% | 169 | $3,915 |
| 2012 | 387 | 14.16% | 47,476 | -17.11% | $1,094,131 | -17.57% | 123 | $2,827 |
| 2013 | 422 | 9.04% | 52,278 | 10.11% | $1,266,936 | 15.79% | 124 | $3,002 |
| 2014 | 440 | 4.27% | 53,215 | 1.79% | $1,685,171 | 33.01% | 121 | $3,830 |
| 2015* | 394 | -10.45% | 58,938 | 10.75% | $1,835,796 | 8.94% | 150 | $4,659 |
| 2016* | 421 | 6.85% | 67,241 | 14.09% | $1,975,421 | 7.61% | 160 | $4,692 |
| 2017 | 509 | 20.90% | 81,076 | 20.58% | $2,599,552 | 31.59% | 159 | $5,107 |
| 2018 | 617 | 21.22% | 95,600 | 17.91% | $2,843,762 | 9.39% | 155 | $4,609 |
| 2019 | 673 | 9.08% | 86,569 | -9.45% | $2,707,583 | -4.79% | 129 | $4,023 |
| 2020 | 733 | 8.92% | 92,472 | 6.82% | $2,897,755 | 7.02% | 126 | $3,953 |
| 2021 | 785 | 7.09% | 111,475 | 20.55% | $3,650,443 | 25.97% | 142 | $4,650 |
| 2022 | 807 | 2.80% | 94,148 | -15.57% | $3,430,125 | -6.04% | 117 | $4,250 |
| 2023 | 843 | 4.46% | 95,580 | 1.52% | $3,477,732 | 1.39% | 113 | $4,125 |
Fantagraphics has one book over 10k in 2023
And, finally, we have Marvel Comics – the overwhelming majority of sales within the Direct Market; the absolute 800 pound gorilla…. But they’re not much of a player in the Bookstore channel, at least as represented by Circana BookScan.
I will apologize, I can not help but editorialize like mad in this section. First off, let’s here’s the last of my DM-centric charts I have been building since forever, showing Marvel’s overall performance in the BookScan Top 750!
| Year | # of placing titles | Unit sales | Calculated
Retail value |
| 2003 | 73 | 455,553 | $8,428,962 |
| 2004 | 50 | 227,985 | $3,756,764 |
| 2005 | 26 | 153,317 | $2,459,027 |
| 2006 | 33 | 294,852 | $5,702,307 |
| 2007 | 37 | 376,918 | $7,599,057 |
| 2008 | 38 | 303,639 | $6,446,359 |
| 2009 | 34 | 226,541 | $5,019,216 |
| 2010 | 33 | 206,273 | $4,979,323 |
| 2011 | 27 | 128,364 | $3,303,496 |
| 2012 | 32 | 141,145 | $3,872,683 |
| 2013 | 39 | 187,598 | $4,229,242 |
| 2014 | 53 | 342,706 | $8,341,787 |
| 2015* | 63 | 478,076 | $10,611,981 |
| 2016* | 60 | 555,715 | $12,088,278 |
| 2017 | 50 | 378,689 | $7,840,198 |
| 2018 | 44 | 363,360 | $7,885,015 |
| 2019 | 27 | 220,845 | $4,151,908 |
| 2020 | 6 | 49,838 | $1,292,944 |
| 2021 | 0 | 0 | 0 |
| 2022 | 1 | 16,822 | $588,602 |
| 2023 | 1 | 12,481 | $199,571 |
So, for the good news? They at least placed a single book into the Top 750. Hooray? But this seems paltry when you see that at least four other publishers licensed to publish Marvel characters (Viz with the Manga Spider-Man: Fake Red; 50k, Disney with Spidey & His Amazing Friends: Team Spidey Does it All!, Scholastic with Miles Morales: Shock Waves, 34k; and Abrams with Spider-Man: Animals Assemble”, 16k) beat every single comic Marvel itself published, while Penguin’s reprint of Penguin Classics: Amazing Spider-Man at 9822 beat them all except for Marvel’s #1 best-seller.
If nearly everyone can do better than you selling your characters, it makes one wonder why you’re still in the publishing business. Even more so, Marvel’s bookstore distribution switched from Hachette to Penguin Random House on April 1 2022, so they’ve had nearly a year to see if new distribution could change their trajectory, and it’s very very hard to say that it is.
Marvel has only one book over 10k this year: Spider-Punk: Battle of the Banned (selling 12k) – and that would seem to be a direct result of the second Spider-Verse animated film. Given the huge success of that film, 12k sold seems pretty paltry?
Once again, let’s state the obvious: Marvel is literally synonymous with the very idea of “comics” for a meaningful percentage of the American population, they have utterly dominated pop culture for multiple years here, and the source material of comics is actually usually better realized than the various bits stolen by the adaptations. Plus, on top of that, they have Star Wars (and also all of the 20th Century Fox library now) – it is absolutely incomprehensible to this observer that they are not entirely dominating the sales of western comics to adults. And yet, they can only sell a single book into the book market at over 10k copies? My considered opinion says to me “Someone isn’t doing their job”.
It’s possible, I suppose, that they’re making it all up in the Direct Market, but since there are no longer any sales charts to establish this, and since I know so many retailers who run fairly specifically Marvel-driven stores who are complaining incessantly about the drops in sales of Marvel periodicals, I’m going to strongly doubt that this is actually the case (at least in a sustainable, non-“Franklin Mint” kind of fashion). It’s too bad: a strong comics market could really really use a strong Marvel that leads the market; instead we are stuck with leadership that doesn’t appear to have any vision besides just following trends… and not even doing that especially well. It makes me sad.
With the change to Penguin Random House, there has been some major changes to Marvel’s meta-data, with Marvel being broken into many many “imprints”. Here is the list of those: “Licensed Publishing”, “Marvel”, “Marvel Comics” “Marvel Universe”, “Max”, “Outreach/New Reader” and “Ultimate Universe”. What actually differentiates several of those from one another is utterly unclear to me, or how or if booksellers or consumers could tell one from the other?
Here is Marvel’s Long Tail. They’re not looking very good in 2023, even after a change in distribution. Down double digits, ow.
| Year | # of listed items | % Change | Total Pieces | % Change | Calculated Retail value | % Change | Av. Sale per title | Av $ per title |
| 2007 | 1230 | — | 1,034,023 | — | $19,947,737 | — | 841 | $16,218 |
| 2008 | 1559 | 26.75% | 1,032,394 | -0.01% | $20,128,825 | 0.01% | 662 | $12,911 |
| 2009 | 2067 | 32.58% | 954,335 | -7.56% | $19,608,696 | -2.58% | 462 | $9,487 |
| 2010 | 2551 | 23.42% | 870,597 | -8.77% | $19,485,662 | -0.06% | 352 | $7,638 |
| 2011 | 2852 | 11.80% | 852,187 | -2.11% | $20,225,728 | 3.80% | 299 | $7,092 |
| 2012 | 3083 | 8.10% | 726,542 | -14.74% | $18,848,013 | -6.81% | 236 | $6,114 |
| 2013 | 3203 | 3.89% | 730,826 | 0.59% | $17,820,299 | -5.45% | 228 | $5,564 |
| 2014 | 3352 | 4.65% | 918,595 | 25.69% | $24,369,961 | 36.75% | 274 | $7,270 |
| 2015* | 1882 | -43.85% | 1,114,414 | 21.32% | $28,021,290 | 14.98% | 592 | $14,889 |
| 2016* | 1841 | -2.18% | 1,277,046 | 14.59% | $31,402,330 | 12.07% | 694 | $17,057 |
| 2017 | 3578 | 94.35% | 1,142,061 | -10.57% | $28,201,535 | -10.19% | 319 | $7,882 |
| 2018 | 3662 | 2.35% | 1,180,202 | 3.34% | $29,651,745 | 5.14% | 322 | $8,097 |
| 2019 | 3692 | 0.82% | 1,064,633 | -9.79% | $26,249,715 | -11.47% | 288 | $7,110 |
| 2020 | 4375 | 18.50% | 785,201 | -26.25% | $20,798,624 | -20.77% | 179 | $4,754 |
| 2021 | 5034 | 15.06% | 1,030,272 | 31.21% | $30,480,039 | 46.55% | 205 | $6,055 |
| 2022 | 5022 | -0.24% | 932,781 | -9.46% | $31,414,866 | 3.07% | 186 | $6,255 |
| 2023 | 5116 | 1.87% | 799,905 | -14.25% | $28,205,729 | -10.22% | 156 | $5,513 |
Marvel just has one book over 10k, despite having over five thousand different SKUs circulating in bookstores
Whew! That’s done!
A few final bits of number-crunching for fun before we go for the year!
First and foremost: for those of you who have personally seen a Circana BookScan chart, I’m sure you noticed that one of the columns is listed as “publishers”. I’ve never been able to understand why: that column is clearly the distributor column, with the weird exceptions of DC and Marvel Comics. DC and Marvel (and Dark Horse, and IDW, and others) are distributed by Penguin Random House in the bookstore market, not Diamond. Image and Boom! and Viz are distributed by Simon, and so on. Dynamite are the primary remaining Diamond Books Distribution publisher in the book market. Now, most analysis that I do I get fairly rigorous about going in and fixing problems in data, but this is a simple top level search where I’m just going to accept what it tells me without question. So who are the leaders for distribution, over the breadth of the entire Circana BookScan list?
This is by pieces sold, of all 44.7 million books sold in 2023 that Circana BookScan reported. There are two hundred and fifteen different distributors listed for books this year (though many of those individual listings are clearly data entry mistakes!)
Turns out it looks like this in 2023:
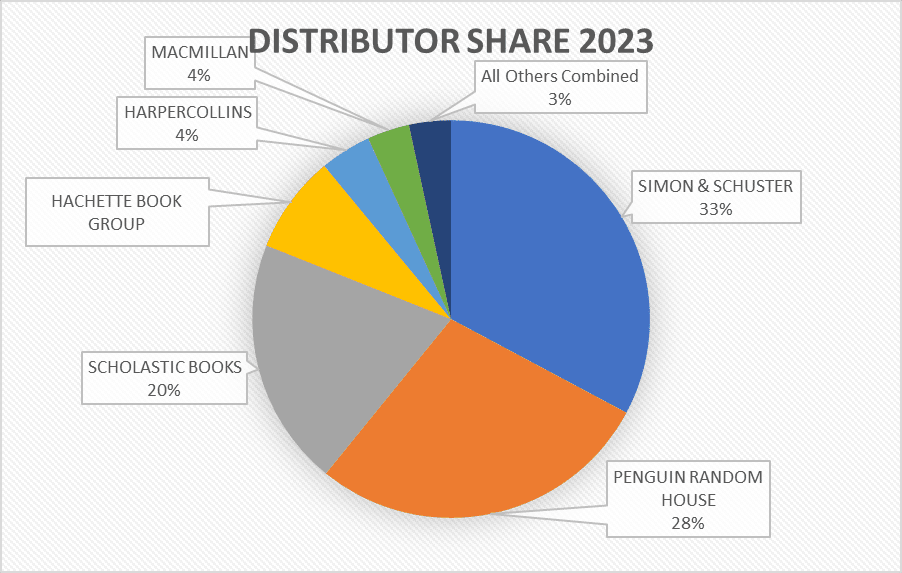
Probably not what you pictured in your head, through the normal Direct Market-driven perceptions and reporting.
Anyway, that’s pretty much what Circana BookScan in 2023 looks like to these eyes.
How does it look to you?
* * * * * * * * * *
How Does The Sausage Get Made???
I like methodology, so here is entirely too much detail on what I do, and how I do it each year.
Short version:
I will summarize a few things top level concepts up-front: all sales reported here are generated by Circana, which runs Circana BookScan. These reflect actual sales made through bookstores that report to Circana, which includes Amazon. Circana believes that some 85% or more of book sales are captured by them – so even best-case scenario, these are a little light. They also include a few comic book specialty stores via those stores that use the “ComicsHUB” point-of-sale system, though it is extremely unclear just what percentage of comic store sales they are capturing. HUB is absolutely no better than the #2 POS system, and they could be significantly smaller as reporting says “over 100” stores use ComicsHUB – last industry wide data suggests there are over three thousand comics stores. (More comprehensive thoughts of Direct Market purchases in 2023 can be found in the excellent reports by John Jackson Miller’s Comichron)
But this BookScan report obviously only includes books sold through the venues that report to Circana BookScan – it absolutely doesn’t include sources of sales like, for example, school library purchases, or direct-to-consumer sales through things like the Scholastic book fairs. In some cases, those numbers could potentially be many multiples of the retail trade. I certainly expect that something as broadly popular as Dog Man: 20,000 Fleas Under The Sea (the #1 book in 2023’s BookScan report) is selling at least twice as many copies (and maybe much much more!) through academic channels. However, this is very much beyond the scope of this survey.
This also only includes physical books sold! No digital of any kind. (Super broadly: non-native digital is a nearly insignificant channel, comprising single digit percentages of most printed books. There are a handful of exceptions, but not as many as you’d think.)
The first thing that I have to do once I receive the report from Circana BookScan is to edit the data I am sent, removing all of the things that are not comics. I literally hand-checked thousands of items every YEAR against Amazon’s “Look Inside” feature” to say “is this a comic or not?” I defined “comics” like this: either a) it has multiple panels sequentially producing a narrative (those don’t have to be on ONE PAGE, so someone like Mo Williams is certainly comics) OR b) a single image that, taken solely by itself, provides a complete thought. So, The Far Side is comics, but, no, Diary of a Wimpy Kid is NOT (but very glad to see that number as a comparative)
Using these working definitions, starting in 2018 I decided to cut some items that had previously been included: chief among best-sellers would be Rachel Renee Russell’s Dork Diaries – they have words, they have pictures, but they don’t work together in the way I’d think we’d commonly agree is “comics”. I also removed prose-driven books like DK Publishing’s “Marvel Encyclopedia”, which, while nominally about comics or comics culture, is factually an encyclopedic prose book with pictures. Or “Wonder Woman: Warbringer” which is a straight-up prose novel that happens to feature a comics character, or “DC Super Heroes: My First Book of Girl Power” where the Amazon “Look Inside” clearly shows is an illustrated reader for 2nd graders. There is clearly an enormous market for these kinds of material – in fact, in many cases a larger market than for the actual comics themselves – it just isn’t the “comics” market, as I would define it. [Editor’s note: this purge also included The Boy, the Mole, the Fox and the Horse by Charles Mackesy, which on the unedited list was the #5 graphic novel of the year, settling a staggering 357,832 copies. The book is essentially an inspirational picture book, but by the gods of Bisac is always on the GN list.]
And since I am the one writing this analysis, I get to make the definitions!
The long version!
“Direct Market” stores (also known as “your Local Comics Shop”) buy much of their material for resale from Diamond Comics Distributors (though, not, by any means, all of the material your LCS has for sale – many DM stores are also buying from book-market wholesalers, or directly from publishers and have been for years). While many DM stores have Point-of-Sales (POS) systems, because our market typically buys non-returnable what we track in our side of the industry is what sells-in to the store, not what sells-through to the eventual consumer. In a very real way, this means that the DM store owner is the actual customer of the publisher, as opposed to the end consumer.
The bookstore market, however, buys their material semi-returnable, where they can send back some portion of titles that don’t sell (but not, usually, all unsold product). Because of this, bookstores track sell-through data. Bookstores that have POS systems are able to report their sales to Circana BookScan, a subsidiary of The Circana Group (they bought it from Nielsen).
Circana BookScan tracks the specific sales to consumers through its client stores. I had several well trained spies who have, for many years, provided me with access to the Circana BookScan reports at the end of each year. However, since 2018 we have been getting the Circana BookScan reports directly from The Circana Group, with no filter or middleman! This is our third year of doing so.
However, getting “official” details brought a major change: Circana Group no longer wants us releasing the actual data, even the pretty tight “Top 750” as has been our historical practice. I am fairly certain that, if you know how to search the internet, you could probably turn up previously published links from 2003 through 2017, but going forward, you will have to trust my abstract of the charts, rather than seeing the charts themselves. So sorry!
(For points of comparison, try these links to the earlier pieces. A number of these are now, sadly, likely dead:
2022: My Analysis
2021: My Analysis
2020: My Analysis
2019: My Analysis
2018: My Analysis
2017: My Analysis
2016: My Analysis
2015: My Analysis
2014: My Analysis
2013: My Analysis
2012: My Analysis
2011: My Analysis
2010: My Analysis
2009: My Analysis
2008: My Analysis
2007: My Analysis
2006: My Analysis
2005: My Analysis
2004: My Analysis
2003: My Analysis)
2013: BookScan Report and My Analysis
2012: BookScan Report and My Analysis
2011: BookScan Report and My Analysis
2010: BookScan Report and My Analysis
2009: BookScan Report and My Analysis
2008: BookScan Report and My Analysis
2007: BookScan Report and My Analysis
2006: BookScan Report and My Analysis
2005: BookScan Report and My Analysis
2004: BookScan Report and My Analysis
2003: BookScan Report and My Analysis)
For some historical context, we have three “eras” of data: 2003-2005 numbers are “what is YTD sold, IF it made the chart in the last week of the year?”
2006-2016: the full “here’s everything that sold throughout the entire year”, but filtered through a leaker – almost certainly accurate, but absolutely missing some bits due to methodology changes and differences, even year-by-year. Important: in 2015 and 2016 I received lists that appeared to be lightly edited, potentially down to “books that are in print at the publisher level only” (obviously, there’s still stock out there on the shelves of stores and in warehouses that is not “in print” per se). Those two years are asterisked to reflect that!
2017-now: “Everything” sold in the calendar year, with no filter. (Though see further notes below!)
Just bear this all in mind if you compare the various “eras” against one another. These are not inherently apples-to-apples comparisons as a result! Moving forward there should be a much deeper consistency of data.
The biggest and most obvious difference when doing straight comparisons will be in the lower ends of the chart. This year, the “worst selling” book in the Top 750 is just about eleven thousand copies (a drop from about twelve thousand copies last year) In ’03-‘05 there would be many items that didn’t have YTD sales in anything like that amount.
Also of major note is that starting in 2007, I have had the “full and entire” Circana BookScan listing, down to books that have only one copy sold YTD. However, I’ve never tried to really analyze that entire list because that’s too much data, even for a data-junkie like myself. I’ve cut the list off at 750 items because that’s what we’ve historically reported. Still, I have the deeper data, and I’ve summarized it as we go along. As long as I continue to get that much data going forward, I should be able to tell you a few things about “The Long Tail”. In 2023, I possess data on 53,466 items! (in 2022 this was 50,056 items).
This is important, however: this is not a list of every book that sold through every book store – the report is limited to those stores that report to Circana BookScan. According to Circana BookScan, more than 7500 venues report to them, but this still leaves many venues that don’t.
Neilsen claimed in 2013 that approximately 85% of retail, physical book sales are tracked through them, though this number appears very much in doubt as an actionable percentage for any specific individual book. A quick internet search can find any number of cases of authors saying that Circana BookScan numbers show half or less of their royalty statements. There’s some really excellent discussion on why and by how much Circana BookScan numbers might be off right here.
Circana BookScan says “Barnes & Noble, Amazon, Costco, General Independents, Hastings, Target, BJ’s, K-Mart, Hudson Group, Meijers, Follett Books, Books-A-Million, CEO Read, Powells, Toys R Us, Shoprite, SuperValu, Sam’s Club and Walmart are among our many data providers.”
What sales do Circana BookScan not track? Among others, this would include libraries, schools, specialty stores (like most comic book stores!) and book clubs and fairs. Circana BookScan does not track sales at most independent bookstores. For many books those are very very important sales channels, and thus, Circana BookScan under-reports by some potentially significant degree, and don’t, in any way, represent all physical book sales or even all “book stores” selling comic book material.
There’s also a certain amount of miscategorization going on. As an example, for almost all of the last twenty years the purely-prose novel Bloody Crown of Conan appeared on my list, while other books (see; Dork Diaries above) might appear one year, and disappear another. I do not know what the actual extent of miscategorization might be and how it would impact any of the general data analysis! There are simply too many potential data points to possibly connect them all together in the time I have to assemble this column.
I’ve done the best I can to try and root out any items “of significance” that should be on the chart that I’m given, but are not – for example, I have to have The Complete Persepolis and Maus manually pulled for me every year because of how BISAC codes work. Because this relies on me catching these titles to get them on to the list this means there’s almost certainly comics material missing that I didn’t catch. If you can think of a book I might have missed, please email me, and I’ll try to track down the sales for it, and update my listings for the future! Even with my multiple safeguards, the datastream is too wide for me to not make mistakes. I make constant mistakes, as you’ll see further down in the body of the column.
Either way, what I’m trying to get across to you is that this really is entirely unreliable data in terms of the absolute and total number of books sold, and is only able to give the broadest possible outline of what’s happening in book stores, based upon the data-set that I’m being given, which is in no way comprehensive. I still think that’s much much better than having no information, so I persevere in writing this each year. Also, now that I am getting directly from the Circana Group, I feel much more confident that I at least know where the potential problems generally are.
Again, I want to stress that I’m doing my primary analysis on the Top 750 items: the reason for this is that is all that I was able to get in the first four years of this analysis, and otherwise the percentage changes I’m discussing will be even more wrong than they would be otherwise. The Top 750 represents more than half of the total of the full list, and has consistently for years – in 2023 the Top 750 was roughly 24.6 million books sold; the bottom fifty-three thousand-ish represents about 20.1 million books sold. While there are significant sales below the Top 750, the Top 750 probably represents the majority of items you’d be able to “easily” find on the shelf of a bookstore in America. I’d love to analyze the full “long tail” list, but I’m afraid that this might take these little essays to triple their current size, and keeping your attention just through this seems hard enough to me! Maybe if someone paid me by the word…!
Finally, it is probably worth mentioning that although I’m analyzing primarily units sold, I also have some calculations that are purely my own of dollars that they would have been if they were sold at full retail. Circana BookScan does not report on the price that a book actually sold for, so the extrapolation of dollars that I made could be dramatically overstated. More than “could be”: it probably is… because Amazon sells so many books, often at crazy steep discounts. In no way should you take any “Calculated Retail Value” as TRUE – these are just to provide a series of benchmarks, and to help you see the impact and differences that “cover price” can make in sales.
If it was not obvious, this only counts physical books, and does not include any digital sale of any kind; it does however, include physical books sold through Amazon.
One of the things I really never talk about is how I get this data each year. I certainly don’t have a Circana BookScan account (they’re pretty expensive!), so I have historically dependent on leaks from industry sources. But this means that the methodology with which the data was generated may actually be very different from year to year. The thing is, since I don’t generate these, Circana BookScan methodology is still largely a Black Box to me. For a guy who writes these reports for 21 (!) years, I still have only really a passing knowledge of how things work. I am learning, slowly, though!
Now that the Circana Group is directly providing us data, we can assume that the methodology itself will not change going forward, yay!
A Bunch of Information about BISAC codes and how this report is generated!
Here’s where we learn a little bit about the Book Industry Standards and Communications (or “BISAC”) codes. It turns out that the publishers assign them themselves, and that publishers are allowed to assign up to four different BISAC codes per item. For example: “Diary of a Wimpy Kid” is classified as “Juvenile Fiction: Humorous Stories”; “Juvenile Fiction: Comics & Graphic Novels: General”; and “Juvenile Fiction: Social Issues: General”. But the kicker is that Circana BookScan reports will only spit out for the first BISAC listed for any given book. That is why “Diary of a Wimpy Kid” never ever showed on any of our previous reports, because the “comics” designation of the BISAC is listed second for that series! Conceptually I could also ask for “Juvenile Fiction: Humorous Stories” report, too – but that’s going to have thousands and thousands of prose-only, not-even-slightly-comics items on it, and working to cut those would quintuple the hours I spend on this (no thanks!) This is also why I have to manually ask for titles like “Maus” or “Persepolis” or “Understanding Comics” each and every year – not because they don’t contain the BISAC for comics (“CGN00xxxx” are the primary ones, for the record), but because that BISAC isn’t listed first!
Now, historically, this has really been opaque to me, to the point where I didn’t even really know what BISAC was, but The Circana Group has been incredibly forthcoming, and I’m learning enough that I almost understand it. First and foremost, we’re now having the report generated using the codes for “Comics & Graphic Novels” (CGN), as well as the “comics” portions of “Juvenile” fiction (JUV) and nonfiction (JNF), and Young Adult Fiction (YAF) and non-fiction (YAN). Please note that the J and Y series of codes extend far past “comics”, but our search is for the narrower section. In addition to that, the Circana Group pulled records for three prominent authors that seldom showed up without intervention: Art Spiegelman, Marjane Satrapi, and Scott McCloud (As well as a small handful of books that I crosschecked against my own best sellers)
So you know, there are more than seventy-five “main” BISACs that we’re pulling in full.
Again, the publishers are the ones who assign the BISACs, and they can assign up to four per book. But reports can only generate (for now) from what the first BISAC code is listed – The Circana Group tells me they’re working on fixing that, but it’s a limitation of the current tools. That’s why they pulled by Author for Art Spiegelman – and look at how MAUS breaks down: the first individual volume has a primary BISAC of HIS022000 (“History: Jewish”), while the complete hardcover is BIO006000 (“Biography: Historical”). But the box set of the two paperbacks is BIO000000 (“Biography: General”), and METAMAUS (the book, with supporting documentation) for some reason is categorized as LIT017000 (“Literary: Comics & Graphic Novels”) which I’m not at all certain how that is different from CGN006000 (“Comics & Graphic Novels: Literary”) – but my point is that you have essentially one book that the publisher itself doesn’t really know what the “primary” BISAC should be.
There’s also more than a few dumb-ass choices, like how JUV008010 (Juvenile Fiction: Comics & GNs/Manga) features a not-even-slightly “manga” HILO by Judd Winick. These kinds of categorization problems pepper the entire database.
Additionally, only (apparently) the publishers can change BISACs, so even if I find errors year after year, it’s really very difficult to convince folks that it matters enough to devote man-hours to fixing up, even if the folks at The Circana Group agree.
If you want to learn more about the theory and practice of BISAC codes, you can go and follow this link. (It’s a trap!)
The main thing to know is that while BISAC is a pretty good system for categorizing books because it is solely in the publisher’s hands it has some pretty extreme limitations when creating reports with it as the sole basis. There is not, however, any other way to generate this data without using those limitations, to the best of my knowledge.
Either way, prior to 2017 numbers, the exact methodology from my leakers was slightly different every year and sometimes we got weird spikes and discrepancies. For example, as far as I can tell, in 2014 and prior we were always getting every book that sold one copy anywhere, then in 2015, and slightly in 2016, we’re getting a lightly edited list that only listed in-print books from some (but not all!) publishers. I put an asterisk on 2015 and 2016 because it was missing several thousand data points… But those very strongly appeared to be datapoints that may not materially affect the actual bottom-line health of dollars and pieces the charts (you’ll see this year, I think). Either way, I really must once again urge you to treat every datapoint presented here as only part of the possible picture!
Hopefully this gave you a good understanding of my methodology.
Sponsored by Battle Quest Comics
**************************
Brian Hibbs has owned and operated Comix Experience in San Francisco since 1989, was a founding member of the Board of Directors of ComicsPRO, has sat on the Board of the Comic Book Legal Defense Fund, and has been an Eisner Award judge. Feel free to e-mail him with any comments. You can purchase a collection of the first Tilting at Windmills (originally serialized in Comics Retailer magazine) published by IDW Publishing, as well as find an archive of pre-CBR installments right here.


The top 20 list is formatted incorrectly, as the column headers are in spot #1, then it jumps to title 3, 7, then 8-20. so you’re missing the last few titles of the top 20. I’m sure it’s a cut/paste error
“Ook and Gluk” was probably bought by Pilkey collectors, or as right-wing spite purchases, as Pilkey has disowned it due to what he now regrets as racial stereotypes in the book.
Great work, as always, Brian!
Dunno if it is my browser or what, but like many articles from The Beat, this is almost unreadable due to the number of intrusive and content blocking ads that CAN NOT be removed or X-ed out. Struggled through the intro plus part of the report and it’s just too much work. Sad because Brian, I always enjoy your work and learn from it.
Brian lists Maus, vol. 1 as the #5 comic, but it’s not listed in his top 20 list. I’m guessing this is due to (as Brian says at the end) Maus not being classified as a GN.
Also, including “Persepolis” as an “American comic” is funny to me. : )
I’d love to know how many copies Ducks sold in Canada.
Unfortunately, these ads enable us to continue our work here and compensate Brian for his 20+ days of working on this article.
You can of course install an ad blocker. We haven’t gone so far as to install one of those “Turn off your ad blocker” pop-ups.
Great write up as always, Brian. I look forward to reading this deep dive of yours every year. I did notice a small math error in regards to Sandman. The comparison should be $160 vs. $200, not $80 vs. $200.
Thanks for the huge work as always!
Shouldn’t the 7th manga publisher in the pie chart be Webtoon Unscrolled and not Tokyopop?
Great work as always, Brian. I look forward to reading this every year.
I was wondering if you could provide information on how Archie Comics did. Top comics? Total sales? Its rank in and percentage of the “Western comics” and the market as a whole?
Very insightful summary that must represent an insane amount of work, as it does each year. Thank you The Beat for organising such a valuable resource for all.
Great work as always Brian. I have to say, DC being on the list at all is a good thing considering how their parent company is currently baffling christendom by continuing to live.
Also Attack on Titan will probably fall off the list completely as it finished airing last quarter. The whole series is done done. Not sure how the publisher is going to plug that whole in their line-up.
Hi Brian,
there seems to be an error in your calculation. When I take your list of complete sales for 2023, and set retail value vs. books sold, I get an average price of about $18,1 instead of about $15 as in your calculation, which makes total sense, since the drop in numbers sold is bigger than the drop in retail dollars, which strongly implies higher prices. You seem to have calculated the number of listed items vs the retail value, but in a strange way: if I calculate 812 thousand dollars vs. 53.000 listed items, I get the 15 bucks from your list. But of course it’s 812 million dollars.
Please tell me if and/ or where I’m wrong.
Greets
Comments are closed.