
Continuing our look at August’s sales distribution charts for comics in the Direct Market, it’s time to look at Image and the independent publishers. First up, Image:

This is roughly you expect to see from Image, which can fluctuate a bit since its titles do tend to take more breaks than other publishers… except Walking Dead, which anchors the line with ~65.1K orders. An enviable number in this market. The second issue, which is to say the first ordered issue, of Die!Die!Die! gets ordered in at ~35.3K, so it looks like dropping the first issue unannounced was a viable launch strategy. Magic Order gets ~30.8K orders. Oblivion Song drops just below 30K to ~29.3K.
Notable debuts include Leviathan #1 at ~23K, Crowded #1 at ~13.3, Cold Spots #1 at ~11.6K and Hey Kids! Comics! #1 at ~7.3K.
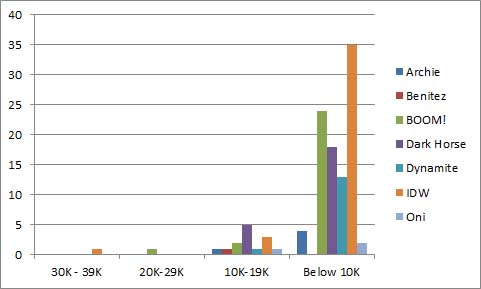
For the rest of the independent publishers, the big winner was IDW’s Rick & Morty vs. Dungeons & Dragons #1. ~31.6K orders is a very healthy number for IDW. BOOM! also got ~25.9K orders for Mighty Morphin Power Rangers Shattered Grid #1. The Power Rangers are a hot property these days.
Other notable sellers include Mighty Morphin Power Rangers #30 with ~18.3K orders, Archie Meets Batman ’66 #2 at ~18.1K, Rick & Morty #41 at ~15.2K, Go Go Power Rangers #12 at ~13.9K, The Seeds #1 at ~13.6K and Sonic the Hedgehog #8 at ~13.4K.
The Seeds, from Dark Horse/Berger Books is the top selling creator owned comic of the month not published by Image.
What happens when we merge the Image and indie charts? Here are a couple views:
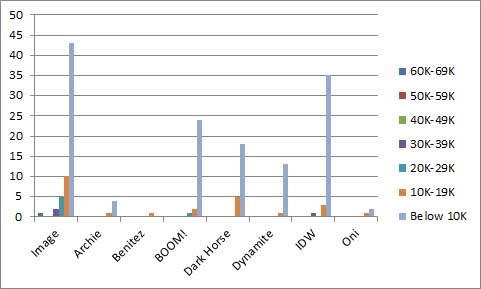
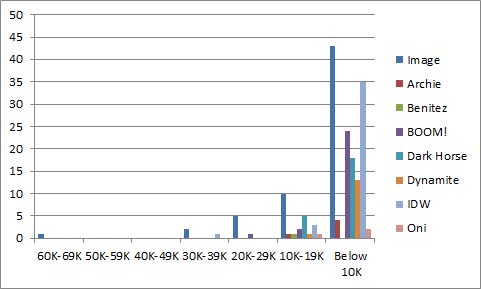
Only two of the other indie title hit at 20K+, so Image still dominates this chart… although we don’t see anyone else hitting 30K+ every month. That’s somewhat unusual, although everyone would be happy if it happened more often.
Standard disclaimers: The numbers are based on the Diamond sales charts as estimated by the very reliable John Jackson Miller. These charts are pretty accurate for U.S. Direct Market sales with the following caveats: 1) you can add ~10% for UK sales, which are not reflected in these charts; 2) everyone’s best guess is you can add ~10% for digital sale – while some titles do sell significantly better in digital (*cough* Ms. Marvel *cough*), that’s the average rule of thumb; 3) it’s not going to include reorders from subsequent months, although reorders will show up in subsequent months if they’re high enough. So if you’re a monster seller in Southampton and it took the US audience 3 weeks to reorder, it’s probably not going to be reflected here.
What’s a sales band? It’s another way to have a higher level view of the market. The general idea is to divide the market into bands of 10K copies sold and see how many issues are in each band. How many issues sold between 90-99K copies, 80-89K copies, etc. etc. In very broad terms, the market is healthier when there are several titles selling in the 70K-100K+ range because titles that move a lot of copies give the retailers some margin of error on their ordering. When you see titles selling in the 20-29K band and especially below, there’s a pretty good chance a lot of retailers aren’t ordering those titles for the shelf (pull box/pre-order only) or minimal shelf copies at best.
For the purposes of these sales band charts, we really are looking for titles that are selling 10K and over, so only publishers with an issue that topped 10K will be listed here. The sad fact is, most independent comics sell under 10K and it’s when they cross that line that they really start getting noticed. The May estimates have the top *500* single issues, which means everything above 980 copies ordered, so this is probably a fairly complete list compared to the old top 300.
Want to learn more about how comics publishing and digital comics work? Try Todd’s book, Economics of Digital Comics


