
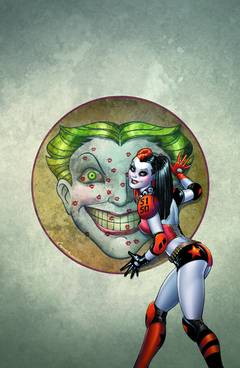
Marvel edged out DC for sales, but DC had a strong 1-2 punch in the top comics for November with Batman and, surprisingly, the all-star Harley Quinn #0 issue. Marvel’s top book was Amazing X-Men #1.
It was a four-week month so sales were down overall, against last month, and year to year, although graphic novels held their own. Sales are still up overall 11% over 2012 and graphic novels are up over 5%.
Perhaps the big news was the performance of the “Next Seven” with incremental gains for publishers down the charts claiming a more substantial share of the dollars for the month. All those giant omnibuses are paying off. I think JJ Miller has a chart that shows every publisher’s share month to month and this would be a good time to look at it.
Marvel Comics was November’s top publisher, edging DC Entertainment 29.97% to 29.24% in Dollar Share and 33.65% to 31.90% in Unit Share.
In the graphic novels, to no one’s surprise, Walking Dead Volume 19 led the way.
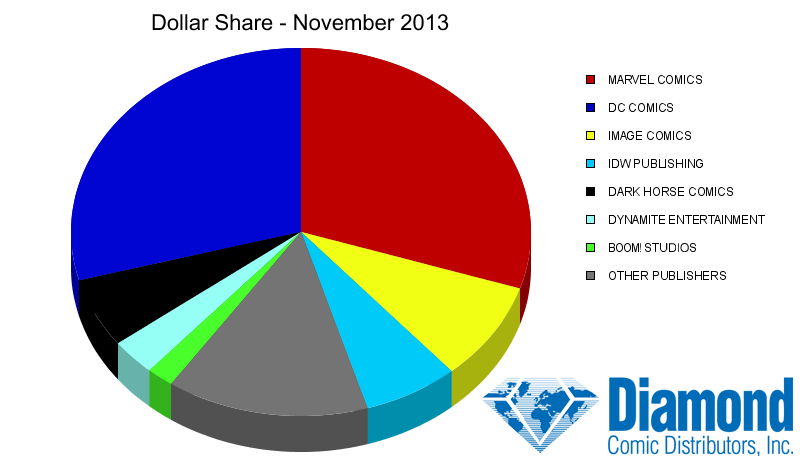
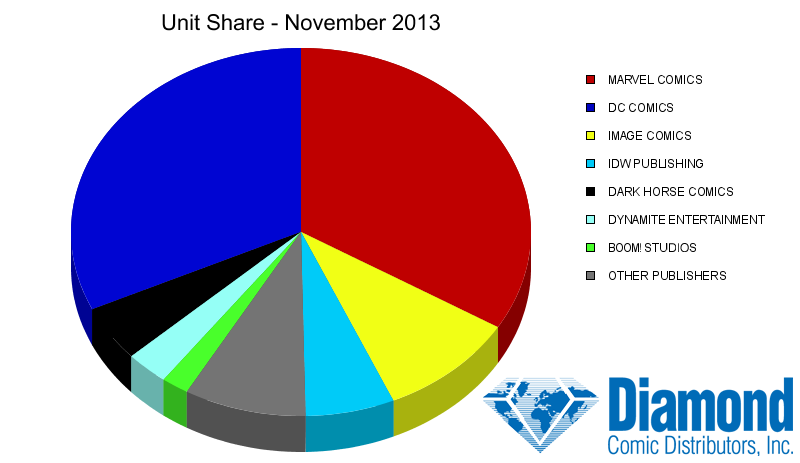
TOP COMIC BOOK PUBLISHERS
|
PUBLISHER |
DOLLAR SHARE |
UNIT SHARE |
| MARVEL COMICS |
29.97% |
33.65% |
| DC ENTERTAINMENT |
29.24% |
31.90% |
| IMAGE COMICS |
8.67% |
9.77% |
| IDW PUBLISHING |
6.68% |
6.26% |
| DARK HORSE COMICS |
6.11% |
4.91% |
| DYNAMITE ENTERTAINMENT |
3.20% |
3.00% |
| BOOM! STUDIOS |
1.90% |
1.92% |
| EAGLEMOSS COLLECTIONS |
1.86% |
0.44% |
| VALIANT ENTERTAINMENT |
1.58% |
1.74% |
| VIZ MEDIA |
1.19% |
0.42% |
| OTHER NON-TOP 10 |
9.59% |
5.99% |
NEW TITLES SHIPPED
|
PUBLISHER |
COMICS SHIPPED |
GRAPHIC NOVELS SHIPPED |
MAGAZINES SHIPPED |
TOTAL SHIPPED |
| DC ENTERTAINMENT |
85 |
29 |
1 |
115 |
| MARVEL COMICS |
74 |
34 |
0 |
108 |
| IDW PUBLISHING |
46 |
31 |
0 |
77 |
| DARK HORSE COMICS |
37 |
31 |
0 |
68 |
| IMAGE COMICS |
42 |
14 |
0 |
56 |
| DYNAMITE ENTERTAINMENT |
30 |
18 |
0 |
48 |
| VIZ MEDIA |
0 |
25 |
0 |
25 |
| BOOM! STUDIOS |
20 |
3 |
0 |
23 |
| VALIANT ENTERTAINMENT |
8 |
2 |
0 |
10 |
| EAGLEMOSS COLLECTIONS |
0 |
0 |
9 |
9 |
| OTHER NON-TOP 10 |
64 |
116 |
16 |
196 |
COMPARATIVE SALES STATISTICS
|
|
DOLLARS |
UNITS |
|
NOVEMBER 2013 VS. OCTOBER 2013 |
||
| COMICS |
-18.80% |
-18.95% |
| GRAPHIC NOVELS |
-9.72% |
-14.98% |
| TOTAL COMICS/GN |
-16.07% |
-18.65% |
|
NOVEMBER 2013 VS. NOVEMBER 2012 |
||
| COMICS |
-1.21% |
-8.43% |
| GRAPHIC NOVELS |
14.59% |
11.44% |
| TOTAL COMICS/GN |
3.39% |
-7.12% |
|
YEAR-TO-DATE 2013 VS. YEAR-TO-DATE 2012 |
||
| COMICS |
11.09% |
7.69% |
| GRAPHIC NOVELS |
5.55% |
3.92% |
| TOTAL COMICS/GN |
9.33% |
7.39% |
TOP 10 COMIC BOOKS
|
RANK |
DESCRIPTION |
PRICE |
ITEM CODE |
VENDOR |
|
1 |
BATMAN #25 |
$4.99 |
SEP130143-M | DC |
|
2 |
HARLEY QUINN #0 |
$2.99 |
SEP130227-M | DC |
|
3 |
AMAZING X-MEN #1 |
$3.99 |
SEP130740-M | MAR |
|
4 |
SUPERMAN UNCHAINED #4 |
$3.99 |
AUG130213-M | DC |
|
5 |
FOREVER EVIL #3 |
$3.99 |
SEP130164-M | DC |
|
6 |
INFINITY #6 |
$5.99 |
SEP130661-M | MAR |
|
7 |
ALL-NEW X-MEN #18 |
$3.99 |
SEP130749-M | MAR |
|
8 |
SUPERIOR SPIDER-MAN #22 |
$3.99 |
SEP130697-M | MAR |
|
9 |
BATMAN/SUPERMAN #5 |
$3.99 |
SEP130223-M | DC |
|
10 |
SUPERIOR SPIDER-MAN #21 |
$3.99 |
SEP130696 | MAR |
TOP 10 GRAPHIC NOVELS & TRADE PAPERBACKS
|
RANK |
DESCRIPTION |
PRICE |
ITEM CODE |
VENDOR |
|
1 |
THE WALKING DEAD VOL. 19: MARCH TO WAR TP |
$14.99 |
SEP130566 | IMA |
|
2 |
YU-GI-OH! 5DS VOLUME 5 GN |
$9.99 |
SEP131376 | VIZ |
|
3 |
FAIREST IN ALL THE LAND HC (MR) |
$22.99 |
JUL130257 | DC |
|
4 |
BATMAN: NIGHT OF THE OWLS TP (N52) |
$19.99 |
AUG130291 | DC |
|
5 |
THE MANHATTAN PROJECTS VOLUME 3 TP |
$14.99 |
MAY130427 | IMA |
|
6 |
INJUSTICE: GODS AMONG US VOLUME 1 HC |
$19.99 |
JUL130242 | DC |
|
7 |
NOWHERE MEN VOLUME 1: FATES WORSE THAN DEATH TP |
$9.99 |
MAY130486 | IMA |
|
8 |
BATMAN IN DETECTIVE COMICS VOL. 2: SCARE TACTICS (N52) |
$16.99 |
AUG130290 | DC |
|
9 |
S.H.I.E.L.D. ORIGINS TP |
$7.99 |
SEP130732 | MAR |
|
10 |
HAWKEYE VOLUME 1 HC |
$34.99 |
JUN130677 | MAR |
TOP 10 BOOKS
|
RANK |
DESCRIPTION |
PRICE |
ITEM CODE |
VENDOR |
|
1 |
DOCTOR WHO: THE ESSENTIAL GUIDE TO 50 YEARS OF DOCTOR WHO |
$20.00 |
JUL131467 | PEN |
|
2 |
DC SUPER HEROES: BATMAN: HARLEY QUINN’S SHOCKING SURPRISE TP |
$4.95 |
AUG131589 | CAP |
|
3 |
STAR TREK: LIGHT UP STARSHIP ENTERPRISE KIT |
$12.95 |
JUL131508 | RUN |
|
4 |
LEGEND OF ZELDA: HYRULE HISTORIA HC |
$34.99 |
SEP120055 | DAR |
|
5 |
STAR WARS: DEATH STAR OWNERS TECHNICAL MANUAL |
$30.00 |
SEP131510 | RAN |
|
6 |
SPECTRUM VOLUME 20 TP |
$35.00 |
AUG131579 | PUB |
|
7 |
THE SHADOW DOUBLE NOVEL VOLUME 78 |
$14.95 |
SEP131509 | SAN |
|
8 |
DOCTOR WHO OFFICIAL ANNUAL 2014 |
$12.99 |
MAR131467 | PEN |
|
9 |
THE ART OF SEAN PHILLIPS HC (MR) |
$39.99 |
JUL130989 | DE |
|
10 |
DC SUPER HEROES: BATMAN: BAT MITE’S BIG BLUNDER TP |
$4.95 |
JUL131458 | CAP |
TOP 10 TOYS
|
RANK |
DESCRIPTION |
ITEM CODE |
VENDOR |
|
1 |
DC COMICS: THE NEW 52 SUPER HEROES VS. SUPER VILLAINS 7-PACK | JUN130321 | DC |
|
2 |
MICHAEL JORDAN: REAL MASTERPIECE #23 “ROAD UNIFORM” FIGURE | MAR138258 | ENT |
|
3 |
SUPERMAN/WONDER WOMAN: THE KISS STATUE | MAY130269 | DC |
|
4 |
BATMAN BLACK & WHITE: THE JOKER STATUE BY GREG CAPULLO | MAY130280 | DC |
|
5 |
MARVEL SELECT: CLASSIC THOR ACTION FIGURE | JUL138075 | DST |
|
6 |
MARVEL SELECT: THOR: THE DARK WORLD: THOR ACTION FIGURE | MAY131784 | DST |
|
7 |
BATMAN BLACK & WHITE: BATMAN STATUE BY GREG CAPULLO | MAY130281 | DC |
|
8 |
BATMAN: ARKHAM ORIGINS SERIES 1: THE JOKER ACTION FIGURE | JUL130282 | DC |
|
9 |
JUSTICE LEAGUE: WE CAN BE HEROES 7-PACK BOX SET | AUG120308 | DC |
|
10 |
BATMAN: ARKHAM ORIGINS SERIES 1: BATMAN ACTION FIGURE | JUN130307 | DC |
TOP 10 GAMES
|
RANK |
DESCRIPTION |
ITEM CODE |
VENDOR |
|
1 |
MARVEL HEROCLIX: INVINCIBLE IRON MAN BOOSTER BRICK | SEP132436 | NEC |
|
2 |
RISK: THE WALKING DEAD SURVIVAL EDITION | OCT128267 | USA |
|
3 |
MONOPOLY: THE WALKING DEAD SURVIVAL EDITION | OCT128266 | USA |
|
4 |
GAME OF THRONES: WESTEROS 4D CITYSCAPE PUZZLE | AUG132098 | 4D |
|
5 |
MARVEL HEROCLIX:AVX: AVENGERS STARTER SET | AUG138092 | NEC |
|
6 |
MARVEL HEROCLIX: AVX: X-MEN STARTER SET | AUG138093 | NEC |
|
7 |
MARVEL HEROCLIX: INVINCIBLE IRON MAN BOOSTER PACKS | SEP132435 | NEC |
|
8 |
THE WALKING DEAD TV BOARD GAME: THE BEST DEFENSE | MAR132230 | CRY |
|
9 |
DC HEROCLIX: BATMAN: ARKHAM ORIGINS BOOSTER PACKS | JUL138429 | NEC |
|
10 |
FIREFLY BOARD GAME | MAY132319 | ALL |


The market share graphs of which you speak are here:
http://www.comichron.com/vitalstatistics/marketshares.html
And yeah, good eye. I thought Marvel and DC’s combined dollar share of 59.21% looked low-ish, but it is in fact the first time it’s been under 60% since April 2003, when Dreamwave had the #2 book. The lowest the combined total has been in the Diamond Exclusive Era is 48.03% in February 1998, when bankruptcy-era Marvel had a truncated slate of titles.
Updated my post to reflect your finding: http://blog.comichron.com/2013/12/november-2013-graphic-novels-drive.html
How often does the “other” hit 33% or greater?
The high month for Other on that chart in my data is April 1998 — and in those days, Other meant anything but Marvel, DC, Image, and Dark Horse. Wizard broke 3% but wasn’t really a comics publisher, and of the rest, only Viz had grown to the point of breaking the 2% mark. In later years, I did add two more publishers to the graphic — Crossgen and IDW — including retroactively removing their contribution to the Other category — but obviously, there wasn’t any in April 1998. The more standardized look at “Other” is simply Diamond’s sum of non-Top-10 publishers — and in April 1998 it was very high, nearly 20%.
It gets there because Marvel and DC’s slates were so small, and even with Image much larger then (around 15%) the other titles made for more of Diamond’s stock. There were 41 (!) publishers in the Top 300 — contrast that to 15 or 16 most months these days. When you look at just the Top 300, the other 37 publishers had 114 titles on the list, with a dollar share of the list approaching 20% — and then the after-300s are almost all indies, with cover prices well above what the four largest publishers were charging. $1.95 and $1.99 were still the modal prices at DC and Marvel and for Spawn; the indies were $2.95 and higher. I think there’s also a manga effect on the TPB list starting to come into play.
It’s not an ideal graphic in that what it includes does change over time — but if I just had it always display the Top 5, we wouldn’t be able to see individual publishers by name.
Correction — the high for “Other” on the chart does pass 33%, in February 1998, a dead month for the major publishers if there ever was one.
There’s another element that in the mid-1990s was pumping up smaller publisher performance on Diamond’s charts: Diamond’s market shares up until September 1998 reflect preorders, not what actually shipped. Diamond continued to publish preorder and final data side-by-side for a while after that, and we saw that there was a slight bias toward smaller publishers in the preorder data: they solicited more things that did not come out. So “Other” rates before September 1998 may be inflated — by a point at most, probably.
Comments are closed.