

 Secret Empire contued to make the top ten, but it was Zdarsky, Kubert, and Bellaire’s Spider-Man that led what was a pretty blah June, accoridng to sales figures just released by Diamond.
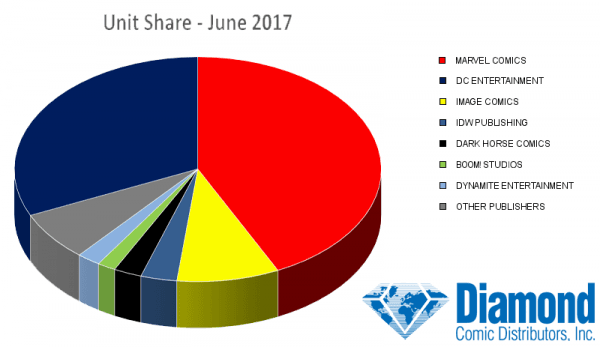
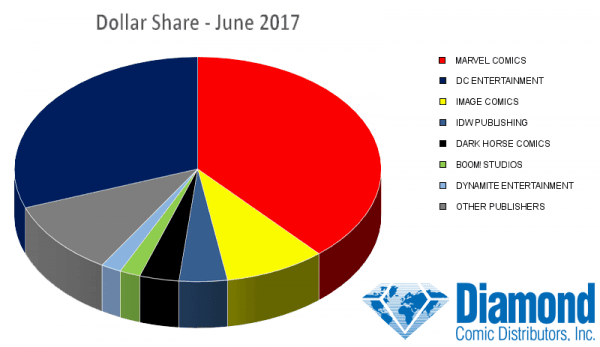
Marvel and DC both improved their market share a bt, and the cgap between the two stayed fairly stable from May – Marvel led with a 38.54% dollar share and a 42.82% unit share’ DC had 30.61% dollar share and a 31.76% unit share.
However the big story was drops in just abut every comparison. Part of this is due to last June being five month week and June 2017 being four weeks, but the year to dates are also down significantly – especially in graphic novels which are down 12.99% in dollars and 13.5% in units.
In the good news, sales are UP fron 1Q numbers. John Jackson Miller has his own take at Comichron and points out that last year’s June was just a monster, with the biggest sales in comics in 20+ years thanks to Civil War and Rebirth. He adds:
The news isn’t all dire, so let’s hit the brighter spots first: Under the hood, if you divide sales by the number of weeks in the month, the individual weeks in June were the strongest all year to date. That $46.09 million divides to $11.52 million per shipping week, the highest total since October. The second quarter beat the first quarter this year by 7.84% — as it should in any kind of normal situation — and 2017’s new comics units so far, though infused with overship and 25-cent Imagecopies, are up from the year-to-date last year by 2.56%.
On the other hand, that’s the only category that’s up for the year. Comics dollars are slightly off, and combined comics, graphic novels, and magazines stand at $261.18 million for the year, off from $280.16 million in the more editorially front-loaded 2016. We were off even more, though, by this time in June 2011, and DC’s New 52 relaunch brought the market almost to even by the end of the year.
The big laggard this year continues to be graphic novels, possibly in part a reflection of a weaker fall and winter last year for new releases, since now is when those comics are being collected. There may also be a dynamic of retailers keeping their powder dry, as July has a heavy release slate coming. Flying Colors‘ Joe Field tweeted yesterday about the challenges involved with ordering for July.
Field’s tweet threads discusses the vast amount of product put into the market to debut at SDCC with some publishers output up 40-50% for the week. I doubt that worrying about July product dumping is behind the general softening of GN sales however.
|
PUBLISHER |
DOLLAR SHARE |
UNIT SHARE |
| MARVEL COMICS |
38.54% |
42.82% |
| DC ENTERTAINMENT |
30.61% |
31.76% |
| IMAGE COMICS |
8.86% |
9.00% |
| IDW PUBLISHING |
4.24% |
3.18% |
| DARK HORSE COMICS |
3.46% |
2.47% |
| BOOM! STUDIOS |
1.83% |
1.61% |
| DYNAMITE ENTERTAINMENT |
1.79% |
2.07% |
| TITAN COMICS |
1.02% |
0.76% |
| VIZ MEDIA |
1.01% |
0.36% |
| ONI PRESS INC. |
0.79% |
0.59% |
| OTHER NON-TOP 10 |
7.84% |
5.37% |
COMPARATIVE SALES STATISTICS
|
DOLLARS |
UNITS |
|
|
JUNE 2017 VS. MAY 2017 |
||
| COMICS |
-0.43% |
-5.91% |
| GRAPHIC NOVELS |
-13.01% |
-8.00% |
| TOTAL COMICS/GN |
-4.31% |
-6.08% |
| TOYS |
-18.49% |
-38.75% |
|
JUNE 2017 VS. JUNE 2016 |
||
| COMICS |
-18.38% |
-20.16% |
| GRAPHIC NOVELS |
-28.04% |
-30.14% |
| TOTAL COMICS/GN |
-21.34% |
-21.06% |
| TOYS |
-20.11% |
-37.01% |
|
YEAR-TO-DATE 2017 VS. YEAR-TO-DATE 2016 |
||
| COMICS |
-3.84% |
2.56% |
| GRAPHIC NOVELS |
-12.99% |
-13.50% |
| TOTAL COMICS/GN |
-6.77% |
1.15% |
| TOYS |
-2.84% |
-6.29% |
|
SECOND QUARTER 2017 VS. FIRST QUARTER 2017 |
||
| COMICS |
8.21% |
1.37% |
| GRAPHIC NOVELS |
6.99% |
17.06% |
| TOTAL COMICS/GN |
7.84% |
2.47% |
| TOYS |
-12.46% |
-6.82% |
|
SECOND QUARTER 2017 VS. SECOND QUARTER 2016 |
||
| COMICS |
-7.68% |
-4.64% |
| GRAPHIC NOVELS |
-15.03% |
-13.50% |
| TOTAL COMICS/GN |
-10.01% |
-5.41% |
| TOYS |
-3.19% |
-11.96% |
NEW TITLES SHIPPED
|
PUBLISHER |
COMICS SHIPPED |
GRAPHIC NOVELS SHIPPED |
MAGAZINES SHIPPED |
TOTAL SHIPPED |
| MARVEL COMICS |
101 |
39 |
0 |
140 |
| DC ENTERTAINMENT |
84 |
36 |
1 |
121 |
| IMAGE COMICS |
55 |
15 |
1 |
71 |
| IDW PUBLISHING |
51 |
17 |
0 |
68 |
| DARK HORSE COMICS |
22 |
20 |
0 |
42 |
| BOOM ENTERTAINMENT |
23 |
9 |
0 |
32 |
| TITAN COMICS |
15 |
14 |
2 |
31 |
| DYNAMITE ENTERTAINMENT |
23 |
2 |
0 |
25 |
| VIZ MEDIA |
0 |
22 |
0 |
22 |
| ONI PRESS INC. |
12 |
6 |
0 |
18 |
| OTHER NON-TOP 10 |
116 |
142 |
19 |
277 |
TOP 10 COMIC BOOKS
|
RANK |
DESCRIPTION |
PRICE |
ITEM CODE |
VENDOR |
|
1 |
PETER PARKER: THE SPECTACULAR SPIDER-MAN #1 |
$4.99 |
APR170970-M | MAR |
|
2 |
DARK DAYS: THE FORGE #1 |
$4.99 |
APR170259-M | DC |
|
3 |
STAR WARS: DARTH VADER #1 |
$4.99 |
APR171101-M | MAR |
|
4 |
BATMAN #24 |
$2.99 |
APR170279-M | DC |
|
5 |
DARK KNIGHT III: THE MASTER RACE #9 |
$5.99 |
MAR170359-M | DC |
|
6 |
BATMAN #25 |
$3.99 |
APR170281-M | DC |
|
7 |
EDGE OF VENOMVERSE #1 |
$3.99 |
APR170962-M | MAR |
|
8 |
SECRET EMPIRE #4 |
$3.99 |
APR170922-M | MAR |
|
9 |
SECRET EMPIRE #5 |
$3.99 |
APR170928-M | MAR |
|
10 |
THE WALKING DEAD #168 (MR) |
$2.99 |
APR170902-M | IMA |
TOP 10 GRAPHIC NOVELS & TRADE PAPERBACKS
|
RANK |
DESCRIPTION |
PRICE |
ITEM CODE |
VENDOR |
|
1 |
THE WICKED & THE DIVINE VOL. 5: IMPERIAL PHASE I TP |
$16.99 |
APR170909 | IMA |
|
2 |
DC SUPER HERO GIRLS VOL. 3: SUMMER OLYMPUS TP |
$9.99 |
MAR170353 | DC |
|
3 |
MOTOR CRUSH VOLUME 1 TP |
$9.99 |
MAR170820-M | IMA |
|
4 |
DESCENDER VOLUME 4: ORBITAL MECHANICS TP |
$16.99 |
APR170785 | IMA |
|
5 |
SPIDER-MAN/DEADPOOL VOLUME 2: SIDE PIECES TP |
$16.99 |
MAR171162 | MAR |
|
6 |
TEEN TITANS VOL. 1: DAMIAN KNOWS BEST TP |
$16.99 |
MAR170410 | DC |
|
7 |
HARLEY QUINN VOL. 2: THE JOKER LOVES HARLEY TP |
$16.99 |
MAR170404 | DC |
|
8 |
STAR WARS: DOCTOR APHRA VOLUME 1: APHRA TP |
$17.99 |
MAR171129 | MAR |
|
9 |
A.D.: AFTER DEATH HC |
$24.99 |
FEB170689-M | IMA |
|
10 |
NIGHTWING VOL. 2: BACK TO BLUDHAVEN TP |
$16.99 |
MAR170406 | DC |
TOP 10 BOOKS
|
RANK |
DESCRIPTION |
PRICE |
ITEM CODE |
VENDOR |
|
1 |
THE SHADOW DOUBLE NOVEL VOLUME 118 SC |
$14.95 |
MAR172353 | SAN |
|
2 |
ART OF ATARI POSTER COLLECTION SC |
$24.99 |
APR171557 | DYN |
|
3 |
APPLE AND AN ADVENTURE HC |
$14.99 |
FEB171299 | BOO |
|
4 |
BLOODBORNE OFFICIAL ARTWORKS SC |
$44.99 |
MAR172148 | UDO |
|
5 |
EVIL DEAD 2 ADULT COLORING ACTIVITY BOOK TP |
$14.99 |
APR171958 | SPA |
|
6 |
FAMILY GUY COLORING BOOK |
$14.95 |
MAR172109 | RAN |
|
7 |
MANGA IN THEORY & PRACTICE HC |
$19.99 |
APR172155 | VIZ |
|
8 |
TOYBOX TIME MACHINE HC |
$29.99 |
FEB170491 | IDW |
|
9 |
5 MINUTE SPIDER-MAN STORIES HC |
$12.99 |
APR172266 | HAC |
|
10 |
NEIL GAIMAN’S AMERICAN GODS OFFICIAL COLORING BOOK |
$16.99 |
JAN178881 | HAR |
TOP 10 TOYS
|
RANK |
DESCRIPTION |
ITEM CODE |
VENDOR |
|
1 |
DC DESIGNER SERIES: THE JOKER BY BRIAN BOLLAND STATUE | JAN170427 | DC |
|
2 |
BATMAN BLACK & WHITE STATUE: NIGHTWING BY JIM LEE | DEC160417 | DC |
|
3 |
DRAGONBALL SUPER DRAGON STARS ACTION FIGURES | DEC168377 | BAN |
|
4 |
DC UNIVERSE: HARLEY QUINN ARTFX+ STATUE | NOV162698 | KOT |
|
5 |
LEGEND OF ZELDA: TWILIGHT PRINCESS: LINK FIGMA DX | AUG168804 | GOO |
|
6 |
SUPERGIRL TV: SUPERGIRL STATUE | OCT160339 | DC |
|
7 |
MARVEL GALLERY: OLD MAN LOGAN PVC FIGURE | OCT160011 | DST |
|
8 |
FINAL FANTASY VII PLAY ARTS KAI: CLOUD STRIFE REMAKE FIGURE | NOV168102 | SQU |
|
9 |
X-MEN LEGENDS 6-INCH ACTION FIGURES | FEB178702 | HAS |
|
10 |
MARVEL GALLERY: CLASSIC IRON MAN PVC FIGURE | JAN172648 | DST |
TOP 10 GAMES
|
RANK |
DESCRIPTION |
ITEM CODE |
VENDOR |
|
1 |
MARVEL HEROCLIX 15TH-ANNIVERSARY WHAT IF BOOSTER BRICK | MAR173399 | NEC |
|
2 |
MAGIC THE GATHERING TCG: KALADESH BOOSTER PACKS | AUG163175 | WIZ |
|
3 |
MACHI KORO CARD GAME | MAY142831 | IDW |
|
4 |
MARVEL HEROCLIX 15TH-ANNIVERSARY WHAT IF STARTER SET | MAR173400 | NEC |
|
5 |
GUARDIANS OF THE GALAXY VOL. 2 MONOPOLY | MAY173213 | USA |
|
6 |
YU-GI-OH! MAXIMUM CRISIS SPECIAL EDITION | APR173279 | KON |
|
7 |
DC DICE MASTERS: BATMAN | SEP168742 | NEC |
|
8 |
CHEMISTRY FLUXX CARD GAME | MAR173363 | LOO |
|
9 |
TEENAGE MUTANT NINJA TURTLES: SHADOWS OF THE PAST BOARD GAME | APR160482 | IDW |
|
10 |
YU-GI-OH! PENDULUM EVOLUTION BOOSTER PACKS | APR173278 | KON |


Basically sales are down, but can anyone know the cause absolutely or just speculate? I can’t imagine marvel events are still selling, but have a lot of people just stopped going into comic book stores?
When was the last time a kid’s graphic novel hit #2 (or #1)? (Not in 2016 or 2017)
November 2016
3 5.21 DC SUPER HERO GIRLS TP VOL 02 HITS AND MYTHS $9.99 DC 6,296
June 2016
4 2.26 DC SUPER HERO GIRLS TP VOL 01 FINALS CRISIS $9.99 DC 6,338
For the record, when Raina Telgemeier’s Ghosts debuted last September:
45 1.34 RAINA TELGEMEIER GHOSTS GN $10.99 SCH 1,863
Question:
1) How does this data compare to 2015, if 2016 had record sales?
2) Does anyone keep track of the comparisons? Is there a 2017>2016 chart, and a 2016>2015 chart?
Comichron does. Mind, considering the Hasting bankruptcy, it’s pretty amazing that the numbers aren’t even worse.
http://blog.comichron.com/2016/07/civil-war-ii-1-sells-381k-copies-batman.html
How many comic shops even carry Raina Telgemeier’s books? Meanwhile, those sell like gangbusters via regular book market (likely way more via schools). Reckon the sales via DM are pretty negligible.
Every Comichron monthly page keeps track of one-, 5-, 10-, 15-, and 20-year comparisons, where possible; you can also see it in the “box summary” we do monthly. Here’s June 2017’s — http://blog.comichron.com/2017/07/june-2017-comics-estimates-average.html
We don’t compare other years, but we’re down by a much lesser amount from the Star Wars-powered June 2015 ($48.72 million) and up quite a lot from June 2014 ($41.68 million).
Comments are closed.