

Wrapping up our sales distribution charts, the comparison chart of DC, Marvel and Image for July 2018. So we can see where the biggest sales sit on the Direct Market Landscape. (Methodology explained at the bottom of the page.)
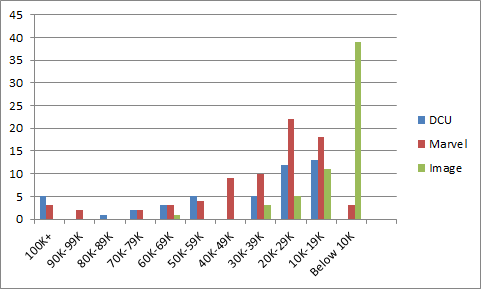
Wow. Every sales band with at least one book in it! That almost looks healthy. Ah, but we’re in a period of relaunches. What happens when we pull the Event books and all of Marvel’s #1s with wacky variants and terms:
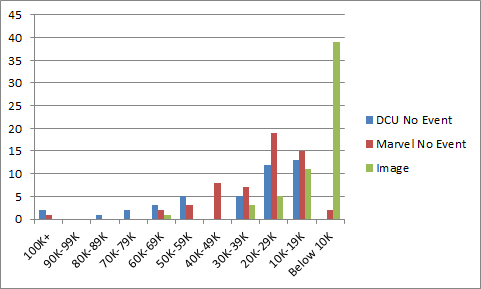
Yeah, that takes the edge off the good news, particularly on the Marvel side of things. But what are we looking at here? Early returns on the DC relaunches of Justice League and the Superman franchises are positive. They need to hold onto that, but it’s something. While Avengers and Thor are quickly sliding back to pre-relaunch type numbers, Amazing Spider-Man #2 still had ~114K orders (although you need to take that with a grain of salt when it’s a double shipping month for Spidey). Immortal Hulk looks like the bestselling Hulk comic in a spell, if not quite a hit.
DC and Marvel have really been cleaning up their sub-10K ongoing titles.
Image’s Die!Die!Die! had a total of somewhere around 90K copies ship to stores, around 80K of which were free and around 10K of which were paid reorders. We don’t have sellthrough number, but 10K reorders on that indicate at least a moderately successful launch there.
The problem is that far too many titles are still selling below 30K. The bulk of DC’s and Marvel’s sales are still below the 30K line with not quite half of it being below 20K. This isn’t as much of a problem for Image, since fewer shops tend to carry Image titles, so the copies per store level is generally higher, but Image has a LOT of very low selling titles, even when factoring in the smaller section of the Direct Market that stocks them.
If there are more hits, this isn’t nearly as much of a problem, but despite the steps DC and Marvel have taken to clean up the lowest of the low sellers, there just hasn’t been enough SUSTAINABLE action on the top end of the chart.
Standard disclaimers: The numbers are based on the Diamond sales charts as estimated by the very reliable John Jackson Miller. These charts are pretty accurate for U.S. Direct Market sales with the following caveats: 1) you can add ~10% for UK sales, which are not reflected in these charts; 2) everyone’s best guess is you can add ~10% for digital sales – while some titles do sell significantly better in digital (*cough* Ms. Marvel *cough*), that’s the average rule of thumb; 3) it’s not going to include reorders from subsequent months, although reorders will show up in subsequent months if they’re high enough. So if you’re a monster seller in Southampton and it took the US audience 3 weeks to reorder, it’s probably not going to be reflected here.
What’s a sales band? It’s another way to have a higher level view of the market. The general idea is to divide the market into bands of 10K copies sold and see how many issues are in each band. How many issues sold between 90-99K copies, 80-89K copies, etc. etc. In very broad terms, the market is healthier when there are several titles selling in the 70K-100K+ range because titles that move a lot of copies give the retailers some margin of error on their ordering. When you see titles selling in the 20-29K band and especially below, there’s a pretty good chance a lot of retailers aren’t ordering those titles for the shelf (pull box/pre-order only) or minimal shelf copies at best.
Want to learn more about how comics publishing and digital comics work? Try Todd’s book, Economics of Digital Comics


