Sales charts. Once we loved them, pored over them, and argued about them. But since the distribution changes of the last three years, the comic book sales chart has been one of the most notable victims. Diamond stopped doing them when DC left, started again briefly, and stopped again, with their last sales chart being released in April, 2022.
It’s understandable that the Diamond numbers were less and less meaningful without Marvel and DC, the two biggest periodical comics publishers, being included. But that left us with no clear numbers…except John Jackson Miller’s heroic efforts at Comichron, but even there he only has Diamond’s advance reorder charts in recent months.
It’s not much to go on.
As someone who has been putting up sales analysis since this site began, I’m frustrated by the lack of info, and so are many other people. Of course, other parties don’t want any numbers out there, and they seem to have the largest say.
I’m not quite sure why Diamond doesn’t do charts any more for their remaining publishers – or Lunar and Random house’s reasons for keeping theirs private. I know some of these publisher would like to trumpet sales successes – but others want to lie low. I’m certainly not imputing any dastardly motives to anyone – at the end of the day, it is private information. But it is something I’ve been investigating on and off for a while, so consider this just an introduction. And what follows is some off the cuff thoughts, not a statistical analysis – for that I’ll leave it to Miller in the comments.
But the topic has come up recently in a few places, and they all seem worth noting.
First and most brutally, Paul Levitz rinsed CBR over an egregious piece called “10 Best-Selling DC Comics Of All Time, Ranked” that only went back a decade or so. Over on FB, Levitz wrote:
If there’s anyone out there who works for Comic Book Resources these days (all my old contacts are gone), you’re getting less and less accurate…and the current post on “best selling DC Comics of all time” is ridiculously inaccurate. It’s a great click bait title, but if you’re going to do things like this, understand “all time” didn’t start when you started reading comics. And while there’s not a comprehensive accurate source of the full sales information, there’s easy reference that would show you wiser choices than this.
As the former president and publisher of DC, Levitz has as much knowledge of DC sales as anyone living, and he might be thinking – among other thoughts – that the Death of Superman in Superman #75 sold some 6 million copies, according to Wikipedia. I’m bad at math, but that is more than 574,700 copies.
Ultimately we don’t know the best selling DC comic of all time, or Marvel comic, or anything else, because we just don’t have the numbers. But the CBR list seemed to only cover the last 15 years or so, and also had horrible headlines like this:
“Was negative sold well” – could be the motto for an entire era of comics.
Despite the japery they endured, CBR’s sister site Screen Rant is still showing an article called 10 Best Selling Image Comics Of All Time which tops out at King Spawn #1 (2021) – 480,650.
This would come as a shock to the Image founders, who regularly sold 1 million copies or so in the naughty Nineties. According to Comichron, back in ’92 Spawn #1 sold 1.7 million copies through various channels, for instance.
The Valnet sites seem to be scraping selected Comichron numbers for these content farm stories, but come on, the comics industry didn’t start in 2008!
I’m a big believer that sell-through charts would be a big shock to the system of comics, but maybe lead to a different kind of accountability. But Miller pointed out that sell-in is important for collectors, tweeting:
The problem is sell-through is of less use to collectors, numerically the major consumers for the data. It doesn’t matter to the aftermarket how many copies shops sold initially; what matters is how many existed. Early 1990s comics are WAY less rare than sell-through would show.
While I have no beef with the collector market, viewing periodical sales purely through that lens doesn’t seem the most healthy approach, either. Morgan Perry, currently brand manager at Skybound but previously the retail sales lead at Boom, then chimed in with an interesting point, writing:
https://twitter.com/geauxta/status/1610754327894949888
As someone who relies on these reports (both sell in and sell through) to project market viability and find appropriate comps for creators & series, I would really like this data back. I would hope other folks in publishing feel the same because it’s market awareness for all.
And this is indeed a reason why most industries have some kind of success rankings – bestseller lists, box office charts, Billboard – it’s easier to sell something new when you say it’s like something that already sold a lot of copies, or made a lot of people go to the movies.
Perry and Miller both agreed that we were back to the dark times, when publishers had to put together their own numbers and do their own comps. But they do it, because they want data.
This is part of a much longer piece, but the periodical/floppy/pamphlet seems to be in trouble again. David Harper at Sktchd has been doing the most reporting on this, based on his conversations with retailers, and I’m hearing much the same. Too many books without a clear audience, too many variant covers, too much stuff. Sales have been dipping and the captive audiences of the Pandemic era are out doing other things now, and not buying as many comics, or books. It’s not a disaster….yet. In his discussion of the unease out there, Harper points out that some publishers don’t want sales charts – I think this is because some just don’t want their bad numbers to get out there, and others aren’t that interested in sell-through to readers. The direct market is a hell of a drug.
Whatever all the reasons, I will stand by my belief that there is a psychological value in saying “Spawn Meets Squirrel Girl was the #1 comic of the month!” Having top sellers implies success, no matter what the numbers. And on this day in January 2023, there is no creator in the direct market who can puff out their chest and say “I have the #1 book of the month!”
Of course they can still have the best selling graphic novel in bookstores, thanks to Bookscan. And we know that things like Dog Man and Wimpy Kid and Chainsaw Man and Spy x Family continue to be bestsellers, even at the New York Times. (CBR has a more accurate piece about this very topic right now.)
That brings us back to point three: comics periodical and graphic novel sell-through charts DO exist. ICv2 runs a monthly report from Comichub, a POS (point of sale) system used by over a hundred retailers. That is a small reporting base, so these numbers don’t get tossed around as much. They don’t offer actual sales numbers industry wide – but it’s something.
But these charts disappeared for a long time due to a data problem – and have just now returned, ICv2 reports!
ICv2 has updated its reporting of comic and graphic novel sales rankings based on sales tracked at point-of-sale by the ComicHub system at stores selling American comics around the world through the end of 2022. Reporting was paused after publication of the August 2022 charts while a reporting issue was resolved. It was determined that a change in report structure related to distribution changes in the comics business beginning in October 2022 was impacting ICv2’s reports of graphic novel sales rankings. The issue affected a handful of hardcover graphic novel titles in the October 2021 through August 2022 period; those charts have now been corrected to include those titles, and steps taken to ensure that the problem does not recur. New charts reporting on sales rankings through the end of December have also been published.
I think this is a hopeful sign. And in the spirit of hope, here are Comichubs’s top 10 comics for the month of December (don’t worry Milton, this is just a one time thing.)
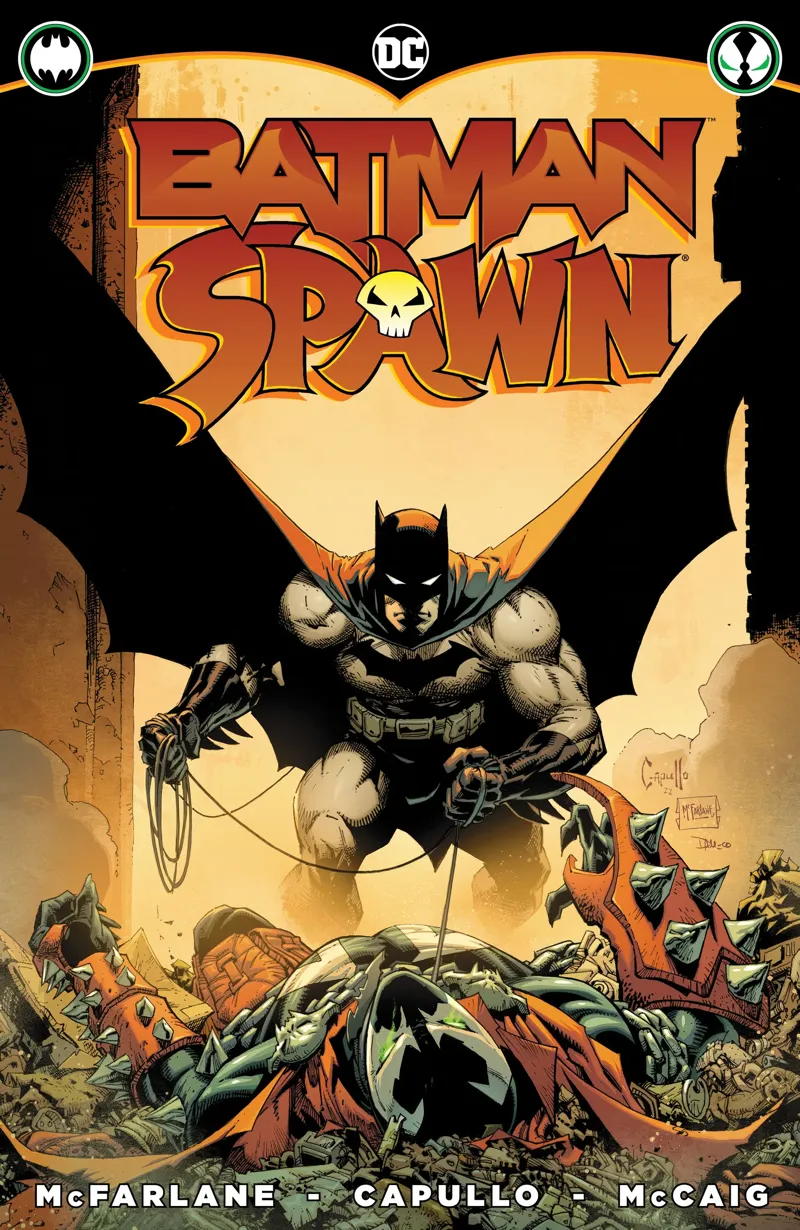
1 Batman Spawn #1 (One-Shot) DC Comics
2 Miles Morales Spider-Man #1 Marvel Comics
3 Batman #130 DC Comics
4 Amazing Spider-Man #15 Marvel Comics
5 Dark Web #1 Marvel Comics
6 Dark Crisis On Infinite Earths #7 (Of 7) DC Comics
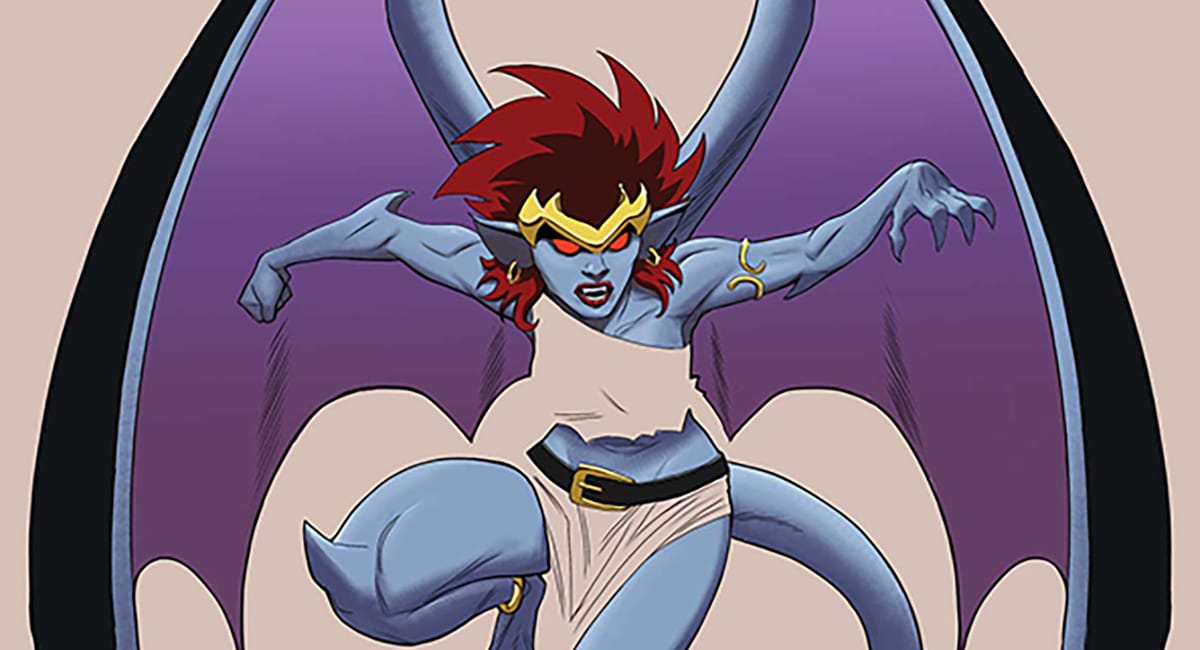
7 Gargoyles #1 Dynamite Ent.
8 Batman & The Joker The Deadly Duo #2 (Of 7) (Mature) DC Comics
9 Daredevil #6 Marvel Comics
10 Thor #29 Marvel Comics
Gargoyles #1 is reported to have sold 179,000 copies to retailers, due to a bunch of variants, but also…people love Gargoyles. It’s what you call a sleeper hit. Seeing how successful it is is a nod to the power of the franchise, Dynamite’s success in rolling it out, and proof that not all bestsellers are from Marvel or DC or Image.
Anyway, I think you are getting my drift: perhaps we should have sales charts because they are, ultimately, good for morale. Even if the actual numbers are low, these numbers are rarely reported, and it feels good to have a top 10 or top 50 or even top 100 book.
It’s nice at the top. Call me crazy, but I actually think the lack of sales charts is hurting comics periodicals more than it is helping for this very reason. Nobody feels like a winner. And when people hear “Oh that book is a hit!” they might want to pick it up to see what the fuss is about.
It’s ironic that in a digital world we have even less solid information than ever, but due to the accuracy of the numbers, people are more dedicated to hiding them than ever (cf: Netflix). But maybe there are some workarounds. Given my love of charts, and interest in success, I’ll be digging in more to whatever metrics we have available in the coming weeks. Webtoons, Kickstarter, individual comics shop. There are numbers out there and I’m going to try to put them into some kind of order.
And if you’re reading this and have a top 10 list you’d like to get out there…just hit me up at heidi @ comicsbeat.com.




There’s never been accuracy reporting in any media. I know this first hand working as a reseacher in the television and movie industry, harking back to my days at Sony TV (circa 2007 – 2009), if my boss didn’t like the numbers for either Wheel of Fortune or Jeopardy! (our two big breadwiiners at the time, in addition to Seinfeld re-runs, of which I was responsible for reporting) on any given Monday morning when we got the overnights and the L+3 or L+7, he’d be on the horn yelling at Nielsen to fix that rating – because those shows had to be the top 1 and 2 rated syndicated shows across the country – NO MATTER WHAT, or otherwise force to lose advertising dollars to all the car manufactors and whoever is floating the big bucks to advertise on those shows, because no one really wants to back a No. 2 show.
These days I come across a few shenanigans when I’m researching streaming data. No two charts are ever the same. Nielsen needs a better system than reporting on minutes watched, Netflix just throws up whatever they please without checking with outside sources and the one I utilize the most, Parrot Analytics constantly posts their findings late. Heck, the last time I checked the chart, two Netflix shows, Warrior Nun and 1899, two shows recently cancelled by the streamer are still showing up in the top ten most watched streamed shows!
I think retailers need to form their own kind of ratings reporting coalition- ten to twenty stores per state to release their own pre-ordering data compared to what they actually sell by the end of the week ready for review every Monday morning. That way, everybody’s happy.
Great reporting, as always, Heidi!
~
Coat
Heidi,
What you want to see
is probably impossible.
Without DC , Marvel , Image giving us some type of numbers
For example there are 10 stores within 10 mile radius
All but one of the stores are run really well
I shop at 9 of the 10 stores , regularly
Have a good enough relationship
with the owners/managers
and discuss sales
one thing that I have noticed , you are a Marvel or a DC Store
The Indie stores do not exist
anymore in this area
All 9 of those stores , Batman is #1 (even the Marvel stores)
#2 thru #10
seem to be totally different
at all 9 stores
For what it’s worth, that 6 million for Superman Vol. 2 #75 seems to come from Larry Tye’s Superman (2012) book, but he does not attribute it and I have been trying to find an official verification for years. Capital City’s orders on the collector’s edition were only 281,000.
As to the sell-in/sell-through distinction, the same argument against sell-in has been used in the past against price guides. But not publicizing supply levels doesn’t make speculation go away — it makes it more destructive. We’ve seen that in the past.
Ultimately, it’s up to the journalist and the venue to decide what’s worth focusing on. I tend to think omitting sell-in data won’t stop the “collector mentality” any more than decades of omitting betting lines in a lot of sports reports stopped gambling, but it is a defensible choice.
I love sales charts if only to see who’s kicking whose butts!
I do agree with what Cary wrote in his last paragraph, about retailers creating a coalition, just not sure if they would find something like that beneficial enough to want to spend the time on it. I would definitely find it worthwhile to seeing what is actually selling to the end customers. I was for many decades a regular pull customer, but as of 2021 no more. Now I read blogs like the comics beat to learn what I will purchase from week to week.
As an aside, the last retailer I pulled from gave me the best buying advise:
1.) Only buy what you like
2.) Avoid the hype
Maybe we should change our way of thinking.
Instead of looking at sales, perhaps the best way to get accurate numbers for would be to look at the number of copies of a title that are printed, instead of being ordered or sold. I’m sure invoices detailing copies of each issue (including variant cover runs) would give a more accurate picture of what was actually produced (i.e. printed for purposes of sale). A company that wants to stay in business would not drastically overprint an issue based on a whim, but on preorders and potential additional sales (up to a point–there would not be multiple printings of a title unless there was a perceived demand from consumers). If printing invoices (bills to the publisher(s)) could be obtained, they could be used as a “sniff test” to determine the accuracy of released numbers from publishers.
The vast majority of comics publishers in the Direct Market era are printing very close to the number of orders they receive — that’s one of the benefits of Final Order Cutoff — so a list of print runs would not be a whole lot different from what Diamond was kicking out every month, except that it would include the U.K. copies.
Up through 2011, Marvel was also still doing postal filings, which have a category for comics printed but not sent to market — it seldom accounted for much. (That’s distinct from comics returned from the newsstand, which has its own category.)
So the thing we had was serviceable, at least. I did explore getting both orders and print runs directly from some publishers in 2020, and some provided me that information — but if you can’t do it for every publisher (and some will never participate), it loses some value. It was also logistically hard to manage, as you might imagine.
It’s amazing how we haven’t had any sales info for a while but people still say diverse comics don’t sell well.
In theory, the lack of a sales chart should mean that publishers should cool it on variant covers. One of the reason for going so hard on them was to boost sales numbers on books. They’re getting out of hand at the moment and likely hurting smaller books.
I’ll end it there because my rant on variant covers is going off topic and could go on for ages.
I’ll have whatever Trevor Van As is having.
~
Coat
Coupled with the inability for at least one of the big publishers to keep variant cover sequence data correct…
Comments are closed.