


 Sales charts! You know I love ’em! So a couple of developments this week in the Great Sales Chart Miasma that I think are significant in getting better data out there. But before I dig in, I want to refer you to David Harper’s Marvel Seems to be Broken. Let’s Fix Them!, his annual report on The Marvel Malaise. I’ll have more to say on this paywalled piece next week, but it lays out a lot of problems with Marvel’s content mix, and some ideas for improving things. The first idea is “Fix: “They need to enter reality and admit there is a problem.”
One way they might admit that their line is stagnating (a widespread belief) would be falling sales. Anecdotally, retailers report that they are selling fewer Marvel books, but is this really showing up? The charts we do have show Dc whupping Marvel most months or weeks for the last while (i’m not going to do a super deep dive on that right now) so one assumes that Marvel’s internals are showing a decline as well.
Since we are not going to see Marvel’s numbers, we can only infer things from the data we do have, which is ranking only, not numbers, unless you subscribe to ICv2 Pro – which you should if you like sales charts.
But as I mentioned, the data is growing! Or at least the sources reporting the data are.
Over at ICv2 this week they announced that they are adding Comic Shop Assistant numbers to their monthly sale chart rankings. CSA is a POS system, so the numbers are actual sales to customers. This adds CSA’s 100 stores to ComicHub’s 125 stores. From the release:
“Getting data for more stores helps make our sales charts more representative of the total market, and that helps the comics industry make better decisions,” ICv2 CEO Milton Griepp said of the expanded data set. “ComicHub has been a great partner, helping us provide sales charts when reporting based on Diamond Comic Distributors sales collapsed, and we appreciate founder Stu Colson’s help in getting us to this point. With the addition of Comic Shop Assistant data, we’re nearly doubling the number of stores on which the charts are based, and we want to thank Django Bohren and Jeff Figley from CSA for joining in this worthy project.”
ICv2’s Top 50 Comics in April, based on combined data, can be seen here. I normally don’t copy ICv2’s data, but just this once I’d like to look at the Top Ten for the combined numbers:
| Top 50 Comic Books by Dollars – April 2026 | |||||
| Rank | Title | Publisher | Price | ||
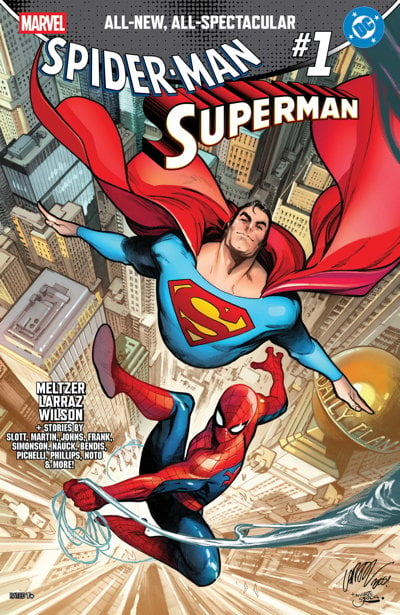
| 1 | Marvel DC – Spider-Man / Superman #1 (One-Shot) | Marvel Comics | $7.99 | ||
| 2 | Absolute Batman #19 | DC Comics | $4.99 | ||
| 3 | DC Marvel – Superman / Spider-Man #1 (One-Shot) | DC Comics | $7.99 | ||
| 4 | Absolute Wonder Woman #19 | DC Comics | $4.99 | ||
| 5 | Daredevil #1 | Marvel Comics | $5.99 | ||
| 6 | Web of Venom #1 | Marvel Comics | $5.99 | ||
| 7 | Amazing Spider-Man #26 (Death Spiral) | Marvel Comics | $4.99 | ||
| 8 | Amazing Spider-Man #27 (Death Spiral) | Marvel Comics | $4.99 | ||
| 9 | Batman Wonder Woman Truth #1 (One-Shot) | DC Comics | $5.99 | ||
| 10 | Batman #8 | DC Comics | $4.9 | ||
Now you might recall that last year when the first Batman/Deadpool crossover came out, Marvel’s edition outsold DC’s despite DC’s having arguably a slightly better creative team. Retailer Brian Hibbs attributed this to Marvel’s coming out first, and various other reasons.
So when the second epic crossover came out, you’d think DC’s Superman/Spider-Man, which came out first, would sell better, right? Although it looks like Marvel beat DC again, DC’s came out on March 25 and Marvel’s on April 22. Superman/Spider-Man was indeed the #1 comic for March, so a triumph for both publishers. I’d be interested to read Brian Hibbs take on THIS epic crossover’s sales.
The second big change in sales chart reporting is that Prana Direct Market Solutions is going to start reporting MONTHLY market shares for publishers. Prana’s numbers are only reported on their weekly YouTube livestream and sent out in the weekly Prana Bullet newsletter, so they are not quite as accessible as ICv2’s.
Prana’s numbers are based on a larger reporting pool, they say, made up of 80,000+ consumers and 600+ stores in various markets, all based on reporting from Comic Shop Assistant AND Manage Comics, a platform which is many things, but for the purpose of this discussion, it counts pull lists and other customer behavior.
Prana has been doing weekly charts for the top 400 comics and publisher market shares for a while, but in the case of publisher market shares, a monthly report is a lot more indicative of overall sales, as releases volume varies so much every week.
The Prana Bullet comes out late every Friday, and I can’t seem to subscribe to it no matter how much I try. However the results are discussed on the weekly Prana livestream so I screencapped the results from this week’s show.
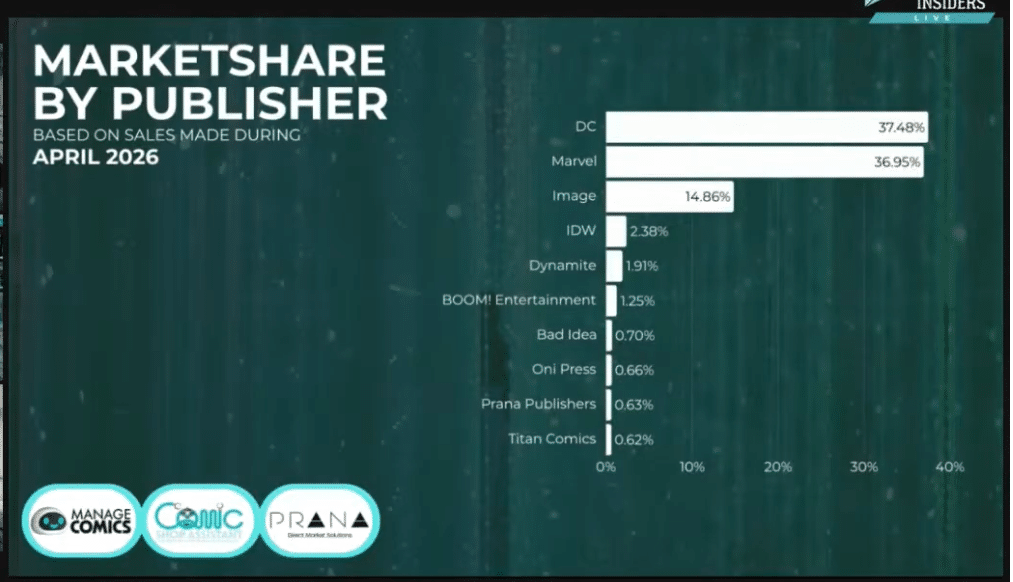
In case this is a little hard to read, here’s a text version:
| Publisher | Market Share |
| DC | 37.48% |
| Marvel | 36.95% |
| Image | 14.86% |
| IDW | 2.38% |
| Dynamite | 1.91% |
| BOOM! Entertainment | 1.25% |
| Bad Idea | 0.70% |
| Oni Press | 0.66% |
| Prana Publishers | 0.63% |
| Titan Comics | 0.62% |
I didn’t watch the whole 90 minute video – sorry gang, but this week has been HECTIC – but scanning the transcript, it seems getting the data to work took some massaging, but as I always like to say, it’s a metric.
This particular metric shows DC less than a point ahead of Marvel, one assumes boosted by the sales of Spider-Man/Superman and TWO big #1 issues. (I don’t yet have access to the single issue chart.)
ICv2 does not give out monthly publisher shares, but they did report on Q1, and the headline DC EXPANDS LEAD OVER MARVEL doesn’t need much interpretation. This is based on ComicHub data, and just this once, let’s look at the rankings:
| Comic Store Market Share (Dollars) – Q1 2026 [ComicHub Data, via ICv2] | ||
| Rank | Publishing | Market Share |
| 1 | DC Comics | 34.7% |
| 2 | Marvel Comics | 29.4% |
| 3 | Image Comics | 11.8% |
| 4 | IDW Publishing | 4.2% |
| 5 | Dark Horse Comics | 2.9% |
| 6 | VIZ Media | 2.3% |
| 7 | Dynamite Entertainment | 2.3% |
| 8 | BOOM! Studios | 1.7% |
| 9 | Kodansha Comics | 1.1% |
| 10 | Oni Press | 1.1% |
| All Others | 8.5% | |
Again, this is for January-March 2026, so has no relation to the Prana chart above.
ICv2 also reported on Q1 for 2025 (but no other quarters are easily findable) and that was very different at the top.
| Comic Store Market Share (Dollars) – Q1 2025 [ComicHub Data, via ICv2] | ||
| Rank | Publisher | % Share |
| 1 | Marvel Comics | 37.9% |
| 2 | DC Comics | 25.5% |
| 3 | Image Comics | 12.0% |
| 4 | IDW Publishing | 3.9% |
| 5 | Dark Horse Comics | 3.6% |
| 6 | BOOM! Studios | 2.5% |
| 7 | Dynamite Entertainment | 2.1% |
| 8 | VIZ Media | 2.0% |
| 9 | Oni Press | 1.0% |
| 10 | Kodansha Comics | 0.9% |
| All Others | 8.6% | |
DC 12 points behind to 5 points ahead in a year is a good comeback! Marvel dropping 8 points looks not as good.
However just to throw a monkey wrench into all this, the ICv2 publishers shares are based on DOLLARS not UNITS. This is a good metric for publishers who are making out a balance sheet, but I prefer to compare units as it shows how many customers were purchasing each publisher’s offerings. (Prana’s chart is based on units.)
So where does this leave Marvel’s wake-up call? Well, maybe they don’t even need one. The entire market has expanded in a year so 25% of Q1 ‘26 might be MORE profitable than 37% of Q1 ‘25.
OR it could be a whole lot less, if you believe retailer reports of readers shunning Marvel’s recent output. But the numbers appear to show that the shunning is not as hardcore as you might think.
The bottom line is, all these snapshots are giving us a piece of the elephant but the total shape of the critter is still not clear.
But…we’re getting a bit closer.
On another note, Prana’s monthly market share report has a few surprises. To answer one: I’m guessing it doesn’t include manga because it is only for periodical format comics. Hence floppy-only Bad Idea showing up. I have some other questions about the chart that I’m going to try to clarify, and I’ll update this report. Because if there’s one thing The Beat loves….it’s accurate sales charts! Our quest shall never dim!
")


Unless my eyes device me, Prana’s chart is missing Dark Horse.
Bad Idea hasn’t been floppy only for awhile now.
I think an important caveat is how the business is fueled by variant covers now.
Comments are closed.