

And finally, the comparison chart of DC, Marvel and Image for June 2018. So we can see where the biggest sales sit on the Direct Market Landscape. (Methodology explained at the bottom of the page.)
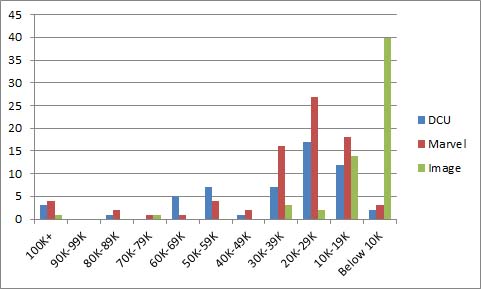
Now remember, that 100K+ listing for Image allegedly had some special discounts involved and the word around the water cooler is the DM retailer orders were probably somewhere in the 70Ks.
That aside, DC and Marvel look somewhat similar. Marvel’s putting out a lot more issues, but the distribution follows a similar pattern.
Let’s see what happens when we take out the #1s and Events.
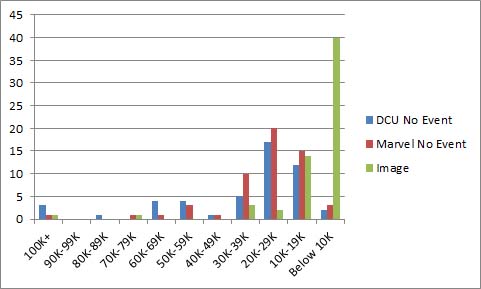
Even if you take out the Man of Steel issues in the 60Ks sales band as an Event, DC is having a better run on the left hand side of the chart and Marvel needs to prove that this relaunch can keep a few titles at 60K+ sales levels.
This month there’s a bit more activity between that 60K – 99K. The second issues of Justice League, Thor and Venom. (We’ll see where those settle, Venom #3 was not such a lofty order.) Man of Steel. Walking Dead. We know Walking Dead will be there next month and one suspects Justice League will be. We’ll have to see where everything else lands.
Image doesn’t appear to measure up quite the same with this month’s slower performance in the 20K-29K sales band, but however you want to regard Magic Order, they’ve got 2 books in the 70+ club and three more over 30K – all with sales totals that would be considered a hit at DC and Marvel.
The relaunches continue and, for the moment, DC looks like it might have more momentum going on the relaunches than Marvel, but these things can change rapidly. We’ll see if the trends continue when the July estimates arrive.
- DC chart for June
- Marvel chart for June
- Image chart for June
Standard disclaimers: The numbers are based on the Diamond sales charts as estimated by the very reliable John Jackson Miller. These charts are pretty accurate for U.S. Direct Market sales with the following caveats: 1) you can add ~10% for UK sales, which are not reflected in these charts; 2) everyone’s best guess is you can add ~10% for digital sales – while some titles do sell significantly better in digital (*cough* Ms. Marvel *cough*), that’s the average rule of thumb; 3) it’s not going to include reorders from subsequent months, although reorders will show up in subsequent months if they’re high enough. So if you’re a monster seller in Southampton and it took the US audience 3 weeks to reorder, it’s probably not going to be reflected here.
What’s a sales band? It’s another way to have a higher level view of the market. The general idea is to divide the market into bands of 10K copies sold and see how many issues are in each band. How many issues sold between 90-99K copies, 80-89K copies, etc. etc. In very broad terms, the market is healthier when there are several titles selling in the 70K-100K+ range because titles that move a lot of copies give the retailers some margin of error on their ordering. When you see titles selling in the 20-29K band and especially below, there’s a pretty good chance a lot of retailers aren’t ordering those titles for the shelf (pull box/pre-order only) or minimal shelf copies at best.
Want to learn more about how comics publishing and digital comics work? Try Todd’s book, Economics of Digital Comics

")


")


Comments are closed.