One day it will all be over…and everyone will forget that this was the moment.
This is when it turned. And it wasn’t the mighty Fleet, it wasn’t some fancy new weapon. It was a drill instructor named Zim who captured a Brain.
–Starship Troopers
So before all hell broke loose with the massive restructuring at DC on Monday, this was to be my lead story this week: the return of the sales charts…and this time with sell-through!
The end result will be a little different in this new world order, but bear with me.
One victim of DC’s prior move to two new distributors and away from Diamond was the End of the Sales Charts as We Knew Them™. Diamond used to send out listings every second Friday of the month or so, and Milton Griepp and John Jackson Miller and John Mayo would break them down for pie charts, market shares, retail dollars and many other things. Winners would be crowned, #1s would be celebrated and on it went.
But with DC gone, Diamond has yet to release a new sales chart. (Some say that not being the perpetual #2 to Marvel in the Diamond charts was a small part of DC’s motivation to move away, even.)
Although Lunar and UCS have yet to make any kind of sales rankings public, I’m told that some new versions of the charts are on the way from Miller, et al. And meanwhile Griepp at ICv2 has done something long threatened and run charts for both periodicals and graphic novels sales based on ComicHub’s point of sale information.
This is essentially sell-through information, not sell-in information, such as the previous Diamond charts counted, and in the past I thought this would be the most revolutionary things possible in the comics industry. And indeed, if COVID-19 hadn’t happened, it still could be.
You see, Diamond’s numbers were and are based on sell-in to comics retailers, basically the orders on what they think they can sell. This makes retail stores the end customer of the direct sales market, and this is why you see all the marketing methods you see in the industry, like scheduling things around final order cut-off (FOC), readers being forced to go through a 500-page industry catalog to preorder things they would like to read and much more.
It is the retailers who sell to customers/readers, and it’s essentially a parallel (but symbiotically connected) system entirely.
While good retailers know very closely what their customers will buy, there is still no substitute for sell-through sales data — this is what NPD BookScan measures, what Box Office charts measure, what bestseller lists chart, and so on. It is the industry standard.
And now, ICv2 is giving us the Q2 sell-through rankings via ComicHub. I am not 100% certain how these numbers are arrived at but since ComicHub is a POS system, it would seem to measure cash register sales.
Let’s take a look at these charts shall we (with the permission of Milton Griepp and ICv2)?
In his first periodical chart, Griepp notes
These are unit and dollar sales rankings based on sales tracked at point-of-sale by the ComicHub system at stores selling American comics around the world. During the period for which these reports were generated, there were roughly 85 stores using the ComicHub system, with rapid increases in the number of stores reporting expected as we incorporate future months. As this is a small, non-random sample of over 3,000 stores selling American comics worldwide, these rankings may not be typical for all stores, but do represent a variety of locations and store emphases. And for the first time, these sales rankings represent actual sales to consumers during the period, not sales to stores.
We are reporting bestsellers for Q2, as there were only a handful of new titles released in April and May, and many stores were shut down or operating in a limited capacity in those months (and in some cases, in June as well). We will release Q2 Top Graphic Novel charts soon, and we will begin monthly charts with July rankings.
As noted, 85 stores is a very small sample, but it is a sample and it’s all we have for now. I’ll get back to the very firm objections to these numbers that I’ve heard in a moment but let’s look at the charts! I’ll just give the Top 10 for periodical units. (You can see dollar chart in the link.)
| Top 20 Comics By Units – Q2 2020 | |||||
| Rank | Title | Publisher | Price | ||
| 1 | Dark Nights Death Metal #1 (Of 6) | DC | $4.99 | ||
| 2 | Batman #92 | DC | $3.99 | ||
| 3 | Joker 80th Ann. 100 Page Super Spectacular #1 | DC | $9.99 | ||
| 4 | Venom #25 | Marvel Comics | $5.99 | ||
| 5 | Batman #93 | DC | $3.99 | ||
| 6 | Catwoman 80th Ann. 100 Page Super Spectacular #1 | DC | $9.99 | ||
| 7 | X-Men #9 DX | Marvel Comics | $3.99 | ||
| 8 | Batman The Adventures Continue #1 (Of 6) | DC | $3.99 | ||
| 9 | Amazing Spider-Man #43 | Marvel Comics | $3.99 | ||
| 10 | DCeased Unkillables #3 (Of 3) | DC | $4.99 | ||
We don’t have sales numbers here, but they would seem to track pretty closely to what you would have expected from the old numbers.
In the Graphic Novel Units Charts however…shock!
| Top 20 Graphic Novels By Units – Q2 2020 | |||||
| Rank | Title | Publisher | Price | ||
| 1 | Batman Last Knight On Earth HC | DC | $29.99 | ||
| 2 | Bog Bodies OGN (Mature) | Image Comics | $12.99 | ||
| 3 | Once & Future Vol. 1 | BOOM! Studios | $16.99 | ||
| 4 | Doomsday Clock Part 2 HC With Slipcase | DC | $24.99 | ||
| 5 | Superman Smashes The Klan | DC | $16.99 | ||
| 6 | Saga Vol. 1 (Mature) | Image Comics | $9.99 | ||
| 7 | Snotgirl Vol. 3: Is This Real Life | Image Comics | $15.99 | ||
| 8 | X-Men By Jonathan Hickman Vol. 1 | Marvel Comics | $17.99 | ||
| 9 | Harleen HC (Mature) | DC | $29.99 | ||
| 10 | Something Is Killing Children Vol. 1 | BOOM! Studios | $14.99 | ||
The appearance of Bog Bodies at #2 and Snotgirl Vol. #3 at all could be said to be surprises, and there are more on the rest of the chart. Could this be a quirk of the small sample size? Undoubtedly yes, but this is why SELL-THROUGH reveals so much. There are always surprises like this.
This week ICv2 rolled out a publisher’s share chart. It’s in dollars and DC is #1 — which is not surprising because they shipped 95 comics in May and June compared to Marvel’s 18.
| Comic Store Market Share (Dollars) – Q2 2020 | |
| Publisher | Market Share |
| DC Entertainment | 37.4% |
| Marvel Comics | 25.7% |
| Image Comics | 10.3% |
| BOOM! Studios/Archaia | 4.3% |
| IDW Publishing/Top Shelf Productions | 4.2% |
| Dark Horse Comics | 4.0% |
| VIZ Media/Perfect Square/Sublime | 2.1% |
| Dynamite Entertainment | 1.3% |
| Oni Press/Lion Forge/Limerence | 1.2% |
| First Second Books/Square Fish/St Martins | 0.7% |
| Other | 8.8% |
These are a bit astray from what we would have seen in Diamond charts, with publishers other than Marvel and DC represented at higher numbers. In January, the Big Two accounted for 69% of the market and 70% in February, as compared to a mere 63% in this chart for Q2. Again given the sample size — and the weirdness of this COVID-time market — it is more of an odd statistic than a hard fact, but there it is for a conversation starter.
I should note that industry observers I contacted are united in questioning the usefulness of charts that are such a small sample size. For instance, Brian Hibbs questioned Snotgirl‘s ranking and told me that such inaccurate data could actually be harmful to people understanding the industry. I would concur that at this point there’s not enough to measure. However, for an industry that is sorely lacking in this kind of data…ya gotta start somewhere.
Just for reference, the weird, janky world of direct market comics retail has had many milestones. Back in the ’80s, Marvel’s Carol Kalish encouraged retailers to get cash registers via a co-op program, and thus being able to count the amount of money you made in a day began. I don’t have any specific memories of the lessons learned from this science advance but I’m sure they were extensive.
Then came POS (point of sale) systems, which started in the ’90s but accelerated in the early aughts with Diamond’s ComicsSuite (again heavily subsized for shops)… you know, the kind of things that every business uses to track inventory and sales. I’m not sure where you can find Brian Hibbs’s own column on his early POS discoveries, but I remember that they were extensive.
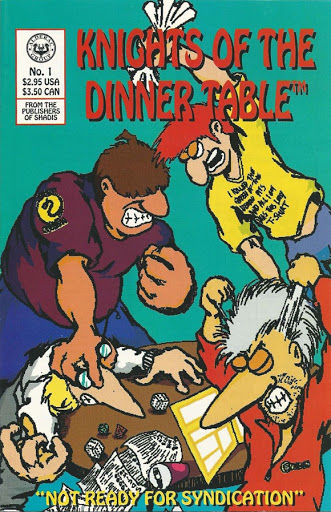
Sell-through charts give us all these discoveries, just like the NPD BookScan charts did. They also allow for unexpected hits and new voices. Back in the ’90s, the industry magazine Comics and Games Retailers, edited by John Jackson Miller, ran sales charts via retailer reporting, and there was always a lot of talk among my friends around the lines of “What the hell is ‘Knights of the Dinner Table?’” This was actually a comic based on an RPG and it was always a bestseller on these retailer lists — shocking comics folk of the day but predicting the rise of all those huge gaming podcasts and Adventure Zone and so on.
But you won’t see Knights of the Dinner Table remembered much as a comics bestseller. It was an authentic hit before we had a name for such things. (Countdown to Miller appearing in the comments to explain more about this in 3…2…1)
In the pre-COVID, pre-DC cutbacks days, it was my hope that giving real sell-through numbers would move publishers away from what they hoped would sell (endless tie-ins to events) to what readers really wanted, making a stronger industry for everyone. We’ve had BookScan numbers for graphic novels for 20 years and now graphic novels outsell periodicals, with some books selling in the millions of copies. Accurate information only grew the market.
It’s going to take a while to do that in the COVID-crippled world we’re dealing with now, but when we rebuild the comics shop market at the end of all this, I’m hopeful that this kind of information will matter as much as ever.
PS: lest you think I am pestering Brian Hibbs as he recovers, he is keenly following industry news, and volunteered his thoughts and is already talking about a new column.


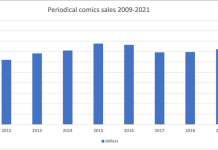


Manga (via Borders) showed bookstores that graphic novels would sell in large numbers. (This goes back to Viz Media being distributed by Publishers Group West since 1986. In 1999, Pokemon infested America on multiple fronts, making manga and anime mainstream.)
With Nielsen numbers (Bookscan started in 2001), mainstream book publishers noticed a new trend. Random House, via Pantheon, had historical data back to the 1980s, as they published Maus and Life in Hell. Others entered the market, and as comics publishers gained bookstore distribution, libraries could easily order obscure titles once only available via comics shops.
Mainstream publishers know how to market to libraries, bookstores, and readers. Add in a comics diaspora of fans and professionals working at these publishers, and the learning curve is reduced as these employees work on comics instead of prose titles. And here we are…
Reporting for duty, but not much to add. It’s another club in the bag, and those are always welcome. Retailers today and short-term collectors can use information about what consumers bought; back-issue retailers and long-term collectors will still want to know how many nonreturnable copies retailers bought. Different measures for different needs.
We worked and worked on the C&GR project trying to come up with something representative, but it was a challenge for a variety of reasons. One thing we added later was a “turnout” statistic that served as a warning when a title only saw bestseller status in a handful of shops. But as a whole I was never very happy with those charts, especially for all the hours we put into them.
Since you mentioned it: if there’s one thing Knights of the Dinner Table is, it’s enduring — monthly issues #273, #274, and #275, released digitally, all came out today via Diamond. Todd McFarlane may have gotten the world record for longest-running indie title, but we’re just a couple of years out from Jolly Blackburn unseating Dave Sim for longest sequential run as writer/artist.
Whatever happened to The Beat’s own sales chart analysis with the separate Marvel, DC, and Indy columns? They were by far my favorite feature of the site. I’ve asked Heidi multiple times directly (and in a respectful way) about their disappearance and possible return and am always ignored. Doesn’t make a very long time reader of the site feel very good. Yet I ask again, what’s up and can we please have them resume?
So David Carter could no longer do his columns because it was a COI for him and I decided to put a hold on them all while I found a new writer but…I never did and now it’s too late!!
I heartily approve. Sell-through numbers for the win. These numbers should more closely track with Comixology top sellers lists. I never understood the value of listing what comic shops were ordering. I mean, the shops typically had tons of what I did not want, and none of what I wanted.
.
I guess the closest thing we had before was what stores re-ordered. But these were distorting in their own right, as you’d think that stores would re-order what was selling best, but that might not always be the case. They could also be jumping on the newest hype, figuring they could use some extra stock to mark up in the future. Or they’d like to re-order a book but discover it’s sold out, so that book will not show up as ‘hot’ by being re-ordered. I’m assuming Diamond didn’t count re-orders they couldn’t fullfill.
Not too surprised that DC topped Marvel in dollars during Q2 since DC was still putting stuff out during the Diamond shutdown and Marvel had a prolonged ramp up time after Diamond emerged from lockdown. But if those were the numbers for 2019 Q4, 2020 Q1, or 2020 Q3 then I would be surprised.
@ Dave Peterson:
The reason comic shop order numbers were used for charts in the beforetime was that (1) those were the numbers that were most easily available for a very large sample size [i.e., all of Diamond’s North American market] and (2) it was a reflection of revenue that the publishers were seeing for each product on the market.
Having said that, I fully agree that if one wants to know what the best selling comics are from the consumer POV, then sell-through numbers are what you need.
To understand the overall health of the direct market as a whole, I actually think that both sets of numbers are what is needed since it would provide a look at how much product retailers take in that they are actually able to unload to consumers.
If I am remembering correctly Ryan Higgens said that part of the reason Bog Bodies being so high is because Big Bang Comics in Ireland was pushing them and Shalvey is a local so they always do big events/promotions with him.
Be nice if we got sell in #s and sell through #s with a %, ranked by unit sales. That way we can see what did better than expected and what bombed (it might put a lie to some of those “Sold out! Going back to Press!” promotions). That’s what publishers really need to know. Otherwise they see sell In numbers and try to sell more of it, wasting time and resources producing and promoting books that retailers are not likely to order in large numbers.
Bog Bodies does well in our local comic shop in Amsterdam, as does Snotgirl, so I’m not surprised! Both great comics with an original vision that can be hand-sold by staff. One WOULD expect a perennial evergreen such as Watchmen to show up, but apparently this isn’t the case. The hard-core crowd that keeps up the comic buying habit during Covid probably has this book already.
Nice to see Superman Smashes The Klan did well in the graphic novel charts.
Comments are closed.