
By Brian Hibbs
“There are three kinds of lies: Lies, Damned Lies, and Statistics”
Implausibly, this is the seventeenth annual BookScan report of something that is hard to exactly perceive and understand: the size and shape of the sales of graphic novels and trade paperbacks through the bookstore market, as seen through the prism of NPD BookScan.
This is a crazy and insane thing for me to be writing today, because this feels like a message in a bottle from a far distant past, and from something that may never be working in the same way again as book retail goes through what I think everyone imagines will be an incredible sea change due to COVID-19. But, we can look at a sweet and halcyon past, so let’s do that.
You can see my notes on my methodology at the end of my analysis.
Some preamble:
“Direct Market” stores (also known as “your Local Comics Shop”) buy much of their material for resale from Diamond Comics Distributors (though, not, by any means, all of the material your LCS has for sale – many DM stores are also buying from book-market wholesalers, or directly from publishers and have been for years). While many DM stores have Point-of-Sales (POS) systems, because our market typically buys non-returnable, what we track in our side of the industry is what sells-in to the store, not what sells-through to the eventual consumer. In a very real way, this means that the DM store owner is the actual customer of the publisher, as opposed to the end consumer.
The bookstore market, however, buys their material semi-returnable, where they can send back some portion of titles that don’t sell (but not, usually, all unsold product). Because of this, sell-through is the data that is tracked and trended. Bookstores that have POS systems are able to report their sales to NPD BookScan, a subsidiary of The NPD Group (they bought it from Nielsen in 2017).
NPD BookScan tracks the specific sales to consumers through its client stores. I had several well-trained spies who have, for many years, provided me with access to the NPD BookScan reports at the end of each year. However, I am very excited to say that we are now getting the NPD BookScan reports directly from The NPD Group, with no filter or middleman! This is our third year of doing so.
However, getting “official” details has brought a major change as of last year: NPD Group no longer wants us releasing the actual data, even the pretty tight “Top 750,” as has been our historical practice. I am fairly certain that, if you know how to search the internet, you could probably turn up previously published links from 2003 through 2017, but going forward, you will have to trust my abstract of the charts, rather than seeing the charts themselves. So sorry!
(For points of comparison, try these links to the earlier pieces:
2018: My Analysis
2017: My Analysis
2016: My Analysis
2015: My Analysis
2014: My Analysis
2013: My Analysis
2012: My Analysis
2011: My Analysis
2010: My Analysis
2009: My Analysis
2008: My Analysis
2007: My Analysis
2006: My Analysis
2005: My Analysis
2004: My Analysis
2003: My Analysis)
2019 Overview
The main thing that has to be done in editing the data I am sent is removing all of the things that are not comics. I literally hand-checked thousands of items against Amazon’s “Look Inside” feature” to say “is this a comic or not?” I defined “comics” like this: either a) it has multiple panels sequentially producing a narrative (those don’t have to be on ONE PAGE, so someone like Mo Williams is certainly comics) OR b) a single image that, taken entirely by itself, provides a complete thought. So, “The Far Side” is comics, but, no, “Diary of a Wimpy Kid” is NOT (but very glad to see that number as a comparative).
Using my new working definition, I have decided to cut some items that had previously been kept in: chief among those is Rachel Renee Russell’s “Dork Diaries” – they have words, they have pictures, but they don’t work together in the way I’d think we’d commonly agree is “comics”. I also removed prose-driven books like DK Publishing’s “Marvel Encyclopedia,” which, while nominally about comics or comics culture, is factually an encyclopedic prose book with pictures. Or “Wonder Woman: Warbringer” which is a straight-up prose novel that happens to feature a comics character, or “DC Super Heroes: My First Book of Girl Power,” which the Amazon “Look Inside” clearly shows is an illustrated reader for 2nd graders. There is clearly an enormous market for this kind of material – in fact, in many cases a larger market than for the actual comics themselves – it just isn’t the “comics” market, as I would define it.
Here’s the big picture for just the Top 750 in 2019:
| Year | Total Unit | Growth | Calculated Retail Value | Growth |
| 2003 | 5,495,584 | ——- | $66,729,053 | ——– |
| 2004 | 6,071,123 | 10.5% | $67,783,487 | 1.6% |
| 2005 | 7,007,345 | 15.4% | $75,459,669 | 11.3% |
| 2006 | 8,395,195 | 19.8% | $90,411,902 | 19.8% |
| 2007 | 8,584,317 | 2.3% | $95,174,425 | 5.3% |
| 2008 | 8,334,276 | -2.9% | $101,361,173 | 6.5% |
| 2009 | 7,634,453 | -8.4% | $93,216,014 | -8.0% |
| 2010 | 6,414,336 | -15.9% | $85,266,166 | -8.5% |
| 2011 | 5,696,163 | -11.2% | $79,961,951 | -6.2% |
| 2012 | 5,438,329 | -4.53% | $89,918,354 | 12.45% |
| 2013 | 5,654,351 | 3.97% | $96,062,709 | 6.83% |
| 2014 | 6,659,031 | 17.77% | $112,768,709 | 17.39% |
| 2015* | 8,762,983 | 31.60% | $141,226,518 | 25.24% |
| 2016* | 9,967,907 | 13.75% | $159,510,075 | 12.95% |
| 2017 | 10,310,682 | 3.44% | $154,026,517 | -3.44% |
| 2018 | 11,755,903 | 14.02% | $165,885,527 | 7.70% |
| 2019 | 15,537,520 | 32.17% | $226,370,566 | 36.46% |
That’s nothing less than the best year of comics that we’ve ever tracked in the Top 750! Not just in terms of raw numbers (the market has more than doubled since 2014!), but also in terms of percentages of growth. And the calculated retail dollars (again: only a measure of what the gross sales would be if every book was bought at full cover price… which assuredly they are not!) is up even more than the raw circulation figures. WOW!
 (I want to remind you that while I asterisk 2015-2016 in terms of the sheer number of data points that I was getting was probably edited, it appears to be that the top 750 itself was fairly rock solid.)
The trend for print books in general (not just looking at comics) through bookstores, according to the NPD group and NPD BookScan appears to be a general drop of 1.3% in 2019, which does nothing but continue the now six-year trend of comics-material being significantly stronger than the general curve. For 2019, we could change that to “wildly stronger”!
(For what it is worth, overall book [only] sales through Diamond in the Direct Market appear to be down by about 2%, (in dollars; ComicChron isn’t calculating pieces here) so the comics market performed incredibly better in the book category – however, I want to reiterate that “Direct Market” retailers are not necessarily buying their book stock from Diamond; certainly, I’ve moved the overwhelming majority of my own purchases directly to book publishers and distributors. Diamond only directly reports the Top 300 best-sellers each month, and those Top 300s in the DM sum up to just over $65m worth of books sold, though obviously there are a LOT of periodicals on top of that (another $307m). Deep, deep into the micro, my own individual sales were up about 3.7% in dollars at my main store in 2019.
As I noted in the methodology, I primarily write about the top 750 because a) that’s all the data I was initially leaked back in 2003, b) it’s a “manageable” chunk of data, and c) “as above, so below” – the top 750 represents about half of sales. However, since 2007, I’ve received the “entire” database, which now gives us a solid ten years of data to track. Sometimes we refer to this as “the Long Tail.”
BookScan 2019 Overview
Here’s what the yearly sales of all comics sales NPD BookScan tracks in this category look like – but, seriously, let me remind you that the data set changes enough each year so that this is a kind of meaningless set of comparisons! Even putting aside “the asterisk years,” prior to 2013 this didn’t include Walmart, for just one example of the lack of direct comparison.
| Year | # of listed items | Percent Change | Total Unit Sold | Percent Change | Calculated Retail Value | Percent Change | Av. Sale per title | Av $ per title |
| 2007 | 13,181 | —– | 15,386,549 | —– | $183,066,142 | —– | 1167 | $13,888.64 |
| 2008 | 17,571 | 24.98% | 15,541,769 | 1.00% | $199,033,741 | 8.02% | 885 | $11,327.40 |
| 2009 | 19,692 | 12.07% | 14,095,145 | -9.31% | $189,033,736 | -5.02% | 716 | $9,599.52 |
| 2010 | 21,993 | 11.68% | 12,130,232 | -13.94% | $172,435,244 | -8.78% | 552 | $7,840.32 |
| 2011 | 23,945 | 8.88% | 11,692,058 | -3.61% | $175,634,490 | 1.86% | 488 | $7,334.91 |
| 2012 | 23,365 | -2.42% | 9,562,236 | -18.22% | $164,415,366 | -6.39% | 409 | $7,036.82 |
| 2013 | 24,492 | 4.82% | 10,153,628 | 6.18% | $176,419,370 | 7.30% | 415 | $7,325.63 |
| 2014 | 26,976 | 10.14% | 11,820,324 | 16.41% | $207,598,355 | 17.67% | 438 | $7,695.56 |
| 2015* | 22,431 | -16.85% | 15,269,550 | 29.18% | $259,807,532 | 25.15% | 681 | $11,582.52 |
| 2016* | 21,295 | -5.06% | 17,302,891 | 13.32% | $293,583,180 | 13.00% | 813 | $13,786.48 |
| 2017 | 35,338 | 65.95% | 18,385,086 | 6.25% | $302,300,435 | 2.97% | 520 | $8,554.54 |
| 2018 | 38,424 | 8.73% | 19,965,469 | 8.60% | $318,345,707 | 5.31% | 520 | $8,855.07 |
| 2019 | 40,745 | 6.06% | 24,694,686 | 23.69% | $399,322,754 | 25.44% | 606 | $9,800.53 |
Overall, this is our top-line conclusion for NPD BookScan 2019: Up 6% in total number books listed, up a shocking 24% in Units Sold, and up 25% in the calculated retail value of all books sold for cover price (they didn’t, not in the “bookstore” market)
But, as great as those top-line numbers look, please remember that it is largely “hits” that are driving the business – the “average” book still only sold approximately 600 copies, nationwide, in the entire year. Almost no one can earn a living from that.
Let’s take a look at the Top 20 best-selling items on the 2019 chart; it looks like this:
| Rank | Titlle | Author | Imprint | YTD |
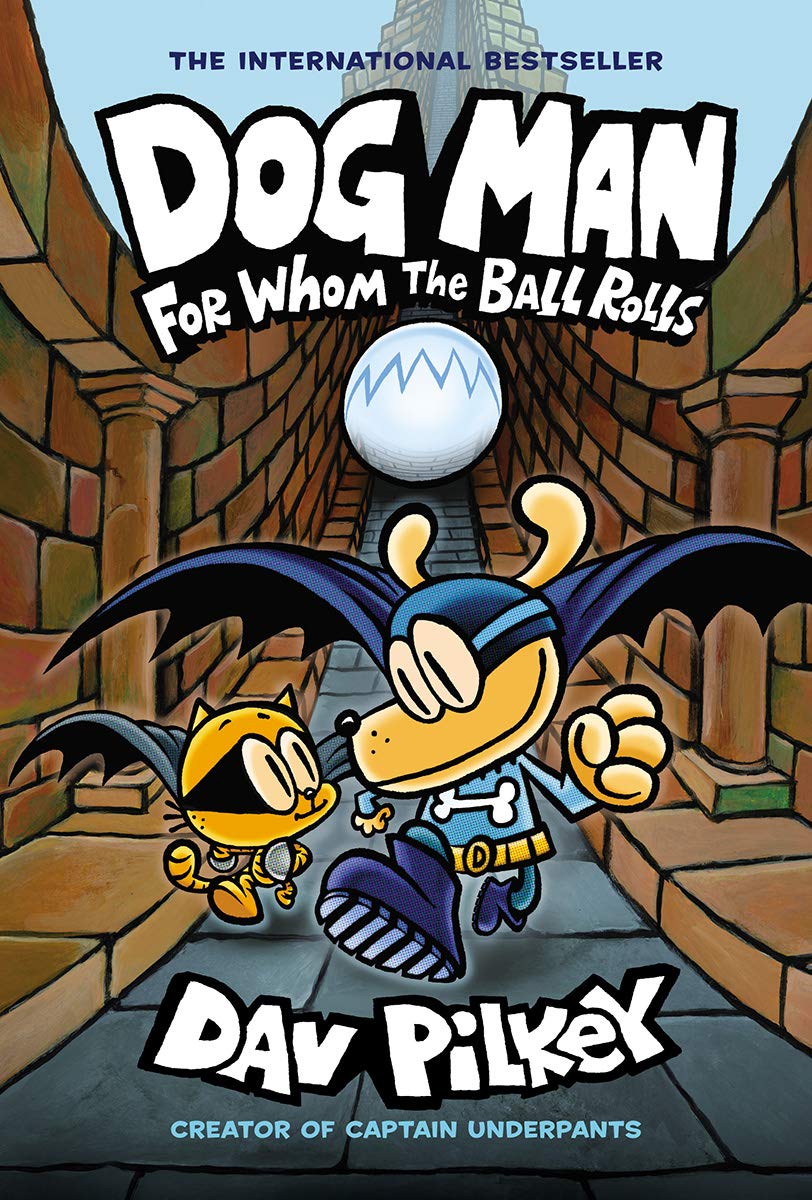
| 1 | DOG MAN: FOR WHOM THE BALL ROLLS | PILKEY, DAV | GRAPHIX | 1,095,532 |
| 2 | DOG MAN: BRAWL OF THE WILD | PILKEY, DAV | GRAPHIX | 789,489 |
| 3 | DOG MAN: FETCH-22 | PILKEY, DAV | GRAPHIX | 608,483 |
| 4 | GUTS | TELGEMEIER, RAINA | GRAPHIX | 454,603 |
| 5 | DOG MAN: LORD OF THE FLEAS | PILKEY, DAV | GRAPHIX | 379,390 |
| 6 | DOG MAN AND CAT KID | PILKEY, DAV | GRAPHIX | 296,041 |
| 7 | DOG MAN | PILKEY, DAV | GRAPHIX | 285,484 |
| 8 | DOG MAN UNLEASHED | PILKEY, DAV | GRAPHIX | 279,525 |
| 9 | DOG MAN: A TALE OF TWO KITTIES | PILKEY, DAV | GRAPHIX | 253,025 |
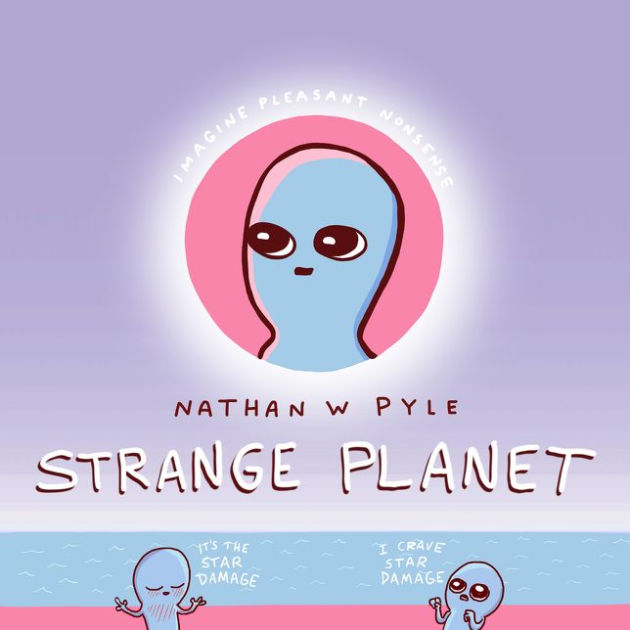
| 10 | STRANGE PLANET | PYLE, NATHAN W. | MORROW GIFT | 242,793 |
| 11 | DRAMA | TELGEMEIER, RAINA | GRAPHIX | 165,463 |
| 12 | BOY-CRAZY STACEY | GALLIGAN, GALE | GRAPHIX | 156,222 |
| 13 | SMILE | TELGEMEIER, RAINA | GRAPHIX | 143,056 |
| 14 | BEST FRIENDS | HALE, SHANNON | FIRST SECOND | 134,442 |
| 15 | THE LOST HEIR (WINGS OF FIRE GRAPHIC NOVEL #2) | SUTHERLAND, TUI T. | GRAPHIX | 128,713 |
| 16 | SISTERS | TELGEMEIER, RAINA | GRAPHIX | 124,984 |
| 17 | GHOSTS | TELGEMEIER, RAINA | GRAPHIX | 113,036 |
| 18 | THE DRAGONET PROPHECY | SUTHERLAND, TUI T. | GRAPHIX | 111,800 |
| 19 | JUST JAIME | LIBENSON, TERRI | BALZER & BRAY/HARPERTEEN | 105,294 |
| 20 | MY HERO ACADEMIA, VOL. 1 | HORIKOSHI, KOHEI | VIZ MEDIA | 98,720 |
Eighteen of the 20 are aimed at younger readers – only “Strange Planet”, a collection of webcomics, cracks the Top 20 for “Western” creators, while only “My Hero Academia v1” breaks in for Manga. The first Marvel/DC comic comes in at #36 (“Watchmen” – although that’s for the new 2019 edition, if you added in the older edition that DC was depreciating, it would have been #28).
 Clearly, Dav Pilkey and his “Dog Man” series of books are the current rulers of comic sales in the bookstores. What’s critical to remember about this is that Scholastic is also presumably selling a metric shedload of these books through the Scholastic Book Fairs, to elementary and middle school libraries, and any number of other places that don’t report to NPD BookScan. This continues to be just the tip of the iceberg.
So strong is Pilkey’s hold on the current charts that he takes the eight of the first nine spots on the charts. The #1 best-seller (“Dog Man: For Whom The Ball Rolls”) sold almost 1.1 million copies. No, that’s not a misprint, it is over a million copies sold.
At #2 is “Brawl of the Wild” (789k), #3 is “Fetch-22” (608k), #5 is “Lord of the Fleas” (379k), #6 is “Dog Man & Cat Kid” (296k), #7 is v1, just titled “Dog Man” (285k), #8 is “Dog Man Unleashed” (280k), and #9 is “A Tale of Two Kitties” at a staggering 253k copies. Any one of those, in any other year, would be an insanely high number by itself – add them all together and you have almost four million copies of one single series sold in one single year.
Let’s underline just how huge “Dog Man” is: these eight volumes together represent sixteen percent of all comics sold through NPD BookScan.
If Pilkey is the current King of comics sales, then the Queen can’t be anyone other than Raina Telgemeier, because her books take up the next swath, including #4, with the new-for-2019 “Guts” (455k in just three months time!), #11, “Drama” (165k), #13 with “Smile” (143k), #16 with “Sisters” (125k), #17 with “Ghosts” (113k). Every one of her original graphic novels places in the top 20.
The only thing that breaks these two author’s hold on the top 10 is “Strange Planet” by Nathan Pyle, which is a collection of Instagram cartoons – which comes in at #10, selling 243k copies. This comic is aimed at adults, and is the highest-placing adult-oriented comic on the charts.
Sixteen of the top 20 are published by one publisher: Scholastic. In addition to Pilkey and Telgemeier, they also place a “Baby-Sitter’s Club” adaptation, from Gale Galligan, which is the seventh release in that series (“Boy-Crazy Stacey”) coming in at #12, with 156k copies. They also place two volumes of the adaptations of “Wings of Fire”, with volume 1, “The Dragonet Prophecy” being book #18 (112k sold), and volume 2 (“The Lost Heir”) coming in at #15 (129k sold).
 Rounding out the top 20 is Shannon Hale & LeUyen Pham’s “Best Friends” at #14 (134k), Terri Libenson’s “Just Jaime” at #19 (105k), and our first piece of Manga, “My Hero Academia v1”, at #20, just missing the 100k club at 99k sold.
As is increasingly the situation, you may want to consider the fact that not one of these books was created “for” the traditional Direct Market audience, and that the DM (as purchased through Diamond at least) does a mediocre job stocking or selling any of these books – in fact, of the top 500 DM best-sellers in 2019, only seven of the NPD BookScan top 20 even appear at all – and really only “My Hero Academia v1” (at #25 with 10k copies) can be said to be “successful.” The best selling of the Scholastic hits (“Guts” at #256 sold just over 3k copies into the Direct Market via Diamond), while the best selling “Dog Man”, “Brawl of the Wild” barely registers at #441 with 2200 copies. Now, to be fair, many DM stores are buying these books from non-Diamond sources, but clearly the model is really starting to shift.
How about if we sort things by author? Here are people who sold more than 100k copies combined in the Top 750 in 2019:
| 4,198,699 | PILKEY, DAV |
| 1,299,528 | TELGEMEIER, RAINA |
| 702,482 | HORIKOSHI, KOHEI |
| 334,330 | SUTHERLAND, TUI T. |
| 306,324 | GALLIGAN, GALE |
| 272,932 | PEIRCE, LINCOLN |
| 258,473 | CLANTON, BEN |
| 254,796 | SIMPSON, DANA |
| 242,793 | PYLE, NATHAN W. |
| 223,837 | KIBUISHI, KAZU |
| 211,665 | LIBENSON, TERRI |
| 207,629 | ONE |
| 201,405 | ISHIDA, SUI |
| 181,774 | HALE, SHANNON |
| 152,631 | ITO, JUNJI |
| 151,173 | MOORE, ALAN |
| 145,795 | ARAKI, HIROHIKO |
| 138,860 | MCELROY, CLINT |
| 133,987 | CHMAKOVA, SVETLANA |
| 132,688 | TORIYAMA, AKIRA |
| 131,690 | HALE, NATHAN |
| 125,401 | POPULARMMOS |
| 124,093 | SHIRAI, KAIU |
| 115,983 | GOTOUGE, KOYOHARU |
| 112,474 | HIMEKAWA, AKIRA |
| 109,196 | WAY, GERARD |
| 103,834 | MILLER, KAYLA |
These 27 people represent 68 percent of sales in the Top 750 in 2019!
What you can take from this is that only a tiny number of creators drive the majority of the business in comics (and books in general, I think); and conversely, this probably means that the numerical majority of comics aren’t actually significantly profitable in any given year.
Let’s switch our attention to looking at how publishers performed.
As a way to make the publisher breakdowns more readable, I split the chart into “Eastern” (Manga) and “Western” comics, because I think there are a few clear market distinctions between those categories. So, without further ado:
2019 Manga Sales
Overall sales are up strongly for the Manga category in 2019 – about 34% in pieces within the Top 750, and just under 39% in calculated dollars.
Here’s a year-to-year comparison chart for the Top 750:
| Year | # of placing titles | Unit sales | Calculated Retail Value |
| 2003 | 447 | 3,361,966 | $34,368,409 |
| 2004 | 518 | 4,603,558 | $45,069,684 |
| 2005 | 594 | 5,691,425 | $53,922,514 |
| 2006 | 575 | 6,705,624 | $61,097,050 |
| 2007 | 575 | 6,837,355 | $61,927,238 |
| 2008 | 514 | 5,624,101 | $53,033,579 |
| 2009 | 451 | 4,414,705 | $41,068,604 |
| 2010 | 436 | 3,117,019 | $30,212,561 |
| 2011 | 392 | 2,627,570 | $27,017,081 |
| 2012 | 367 | 1,908,186 | $21,324,368 |
| 2013 | 315 | 1,665,487 | $21,256,777 |
| 2014 | 271 | 1,748,185 | $22,601,720 |
| 2015* | 279 | 2,033,534 | $26,191,474 |
| 2016* | 311 | 2,629,366 | $35,915,488 |
| 2017 | 284 | 2,427,380 | $35,433,489 |
| 2018 | 299 | 2,641,158 | $35,955,537 |
| 2019 | 332 | 3,539,031 | $49,900,429 |
All three indicators are up for the category in 2019, and this year would be the fifth best year for Manga since we’ve tracked things! Much like Western comics (see below), pieces are up by more than a third, and dollars are up almost 39% in the Top 750! What’s even more interesting is that this is from a relatively low number of placing books, historically speaking. As is typical with Manga, this is driven by the near-exclusive domination of series in the manga world – when there’s not a strong anime driving sales, manga tankobon series start to perform more like periodicals than books (albeit over a wider horizon); rather than generally building a strong core backlist that sells forever, year-in-and-year out, manga tends instead to ebb and flow with culture and fashion (and what anime is airing currently, especially).
I think we can see this very clearly with the category leader in 2019, “My Hero Academia” – 29 volumes of the series (or spin-off books) show up in the Manga Top 750, and represent almost one-in-four of Manga volumes sold, combined, in the Top 750.
Nine of the Top Ten Manga in 2019 were “My Hero Academia” volumes, starting with v1 at the #1 spot (99k sold), v2 at #2 (69k), v3 at #3 (53k), v17 at #4 (50k), v18 at #5 (42k), v4 at #6 (40k), v19 at #7 (39k), v16 at #8 (37k), and v20 at #9 (36k) –each and every volume of the series charts within the Top 750. MHA v1 sold just over 61k in 2018, by way of comparison, so the property is growing for now.
The only non-“MHA” book in the Manga Top Ten is “Uzamaki” by Junji Ito, which comes in #10 with just under 36k copies sold. This would be the rare example of “steady selling core backlist”.
One other thing that the nature of multi-book series means is that there tends to be less diversity overall in what’s being promoted – of the 299 different “manga” books, I only counted only 79 distinct “series” this year. This is down from 81 in 2018, and 84 in 2017.
Manga, as a category, has a “Long Tail,” where we’re looking at all sales for the year, and not just within the Top 750 best-sellers:
| Year | # of listed items | Percent Change | Total Unit Sold | Percent Change | Calculated Retail Value | Percent Change | Av. Sale per title | Av $ per title |
| 2007 | 6231 | —— | 11,323,487 | —— | $108,770,537 | —– | 1817 | $17,456 |
| 2008 | 7842 | 20.54% | 10,173,091 | -11.31% | $100,800,283 | -7.91% | 1297 | $12,854 |
| 2009 | 8756 | 11.66% | 8,148,490 | -19.90% | $81,770,442 | -18.78% | 931 | $9,339 |
| 2010 | 8764 | —— | 6,239,725 | -23.42% | $67,092,668 | -17.95% | 712 | $7,655 |
| 2011 | 8991 | 2.59% | 5,690,327 | -8.80% | $62,810,728 | –6.38% | 633 | $6,986 |
| 2012 | 6332 | –29.57% | 3,510,057 | -38.32% | $40,943,613 | -34.81% | 554 | $6,466 |
| 2013 | 7024 | 10.93% | 3,516,208 | 0.01% | $44,651,823 | 9.06% | 501 | $6,357 |
| 2014 | 7452 | 6.09% | 3,914,385 | 11.32% | $51,557,925 | 15.47% | 525 | $6,919 |
| 2015* | 4412 | -40.79% | 4,580,434 | 17.02% | $62,253,624 | 20.75% | 1038 | $14,110 |
| 2016* | 4968 | 12.60% | 5,821,892 | 27.10% | $81,314,479 | 30.62% | 1172 | $16,368 |
| 2017 | 10,248 | 106.8% | 5,865,412 | 0.75% | $85,581,224 | 5.25% | 572 | $8,351 |
| 2018 | 10,839 | 5.77% | 6,100,260 | 4.00% | $87,421,299 | 2.15% | 563 | $8,065 |
| 2019 | 9928 | -8.40% | 7,461,077 | 22.31% | $110,577,066 | 26.49% | 752 | $11,138 |
Good general “Long-Tail” growth in the overall category.
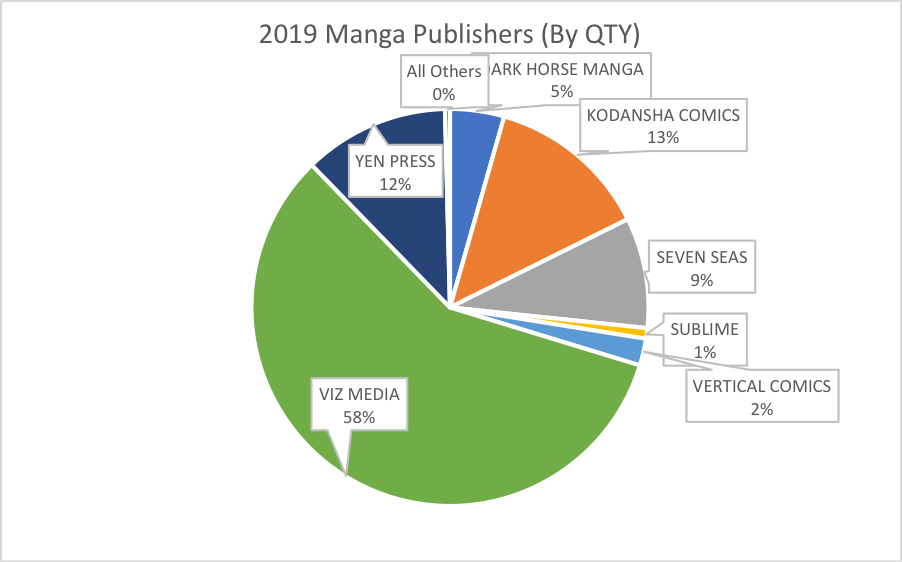
When you start breaking down the manga portion of the chart by publisher, there’s really not any contest at all: there’s a hundred-pound gorilla, and a bunch of smaller houses struggling in their shadow. This chart represents all 9928 books that are “manga” in NPD BookScan in 2019
Within the Top 750, the picture is very similar: The #1 publisher is Viz, which takes 235 of the 332 manga spots in the Top 750, keeping them as the overwhelmingly dominant manga player with nearly seventy-one percent of the placing titles! Within the Top 750, Viz charted about 2.8 million pieces, for almost $36.2 million of calculated retail dollars – this is another year of strong growth for Viz, up roughly 47% from the previous year in pieces placed.
Viz controls the manga charts as they have for a very long time now. It is nearly impossible envisioning anyone really challenging them substantially for that role because they are more than four times larger than their nearest competitor in their segment (!).
As noted above, Viz’s #1 Best-seller is “My Hero Academia” Nothing from the main series sells under 20k, while “MHA: Smash” and “MHA: Vigilantes” all sell under 20k. Nine of Viz’s Top 10 are “MHA”, as are 16 of the Top 20. All told, this one series sold 862k books combined this year! This is dramatically up from just under a half-million in 2018 and 134k combined in 2017.
The only other book to crack Viz’s Top Ten is “Uzumaki” (about 36k at #10) by Junji Ito, and Ito appears to be the only author that Viz is successful with in the Top Ten that is doing so with single, unconnected, books instead of series. Additionally, this is a near doubling of its 2018 sales! Ito is also at #14 for Viz (#16 for all Manga) with “Smashed” (28k). At least six other Ito books place in the Top 750, including “Shiver” at 18k, “Tomie” at 16k, “GYO” at just below 19k, “Frankenstein” at 11k. Several others place, but sell under 10k.
Other strong series for Viz include “Tokyo Ghoul” (v1 places at #15 for Viz #17 for all Manga, for 27k – this is a drop of 1k from 2018, and about 9k from 2017), and “Jojo’s Bizarre Adventure” (v1 places at #19, #21 for all Manga, for 23k).
Titles coming in over 20k also includes v1 of “One-Punch Man” (22k), v1 of “Komi Can’t Communicate” (also 22k), a “Pokemon” book also at 22k, and v4 of “Dragon Ball Super” at just over 20k.
VIZ
Let’s take a look at the “Long Tail” of Viz:
| Year | # of listed items | Percent Change | Total Unit Sold | Percent Change | Calculated Retail Value | Percent Change | Av. Sale per title | Av $ per title |
| 2007 | 2018 | —— | 6,249,324 | —— | $55,123,347 | —– | 3097 | $27,316 |
| 2008 | 2447 | 21.26% | 5,536,286 | -11.41% | $50,311,791 | -8.97% | 2263 | $20,561 |
| 2009 | 2793 | 14.14% | 4,819,407 | -12.95% | $44,310,790 | -11.93% | 1726 | $15,865 |
| 2010 | 3088 | 10.56% | 3,576,671 | -25.79% | $35,041,305 | -20.92% | 1158 | $11,348 |
| 2011 | 3393 | 9.88% | 3,276,297 | -8.40% | $32,766,960 | -6.49% | 966 | $9,657 |
| 2012 | 3518 | 3.68% | 2,099,560 | -35.92% | $22,433,721 | -31.54% | 597 | $6,377 |
| 2013 | 3636 | 3.35% | 1,853,211 | -11.73% | $21,586,923 | -3.77% | 510 | $5,937 |
| 2014 | 3765 | 3.55% | 1,855,161 | 0.11% | $22,732,074 | 5.30% | 493 | $6,038 |
| 2015* | 2264 | -39.87% | 2,150,656 | 15.93% | $28,134,971 | 23.77% | 950 | $12,427 |
| 2016* | 2405 | 6.23% | 2,811,978 | 30.75% | $38,854,681 | 38.10% | 1169 | $16,156 |
| 2017 | 4443 | 84.74% | 2,958,351 | 5.21% | $41,594,729 | 7.80% | 666 | $9,362 |
| 2018 | 4637 | 4.37% | 3,184,274 | 7.64% | $44,423,434 | 6.80% | 687 | $9,580 |
| 2019 | 4702 | 1.4% | 4,329,369 | 35.96% | $60,817,993 | 36.91% | 921 | $12,934 |
Viz is in a great place by their Long Tail – not only are they out-performing the Top 750 overall, they’re outperforming the general Manga long-tail. They didn’t even add 2% to the number of SKUs they sell, yet they’re up by more than a third in pieces and dollars, and had the single biggest year of dollar sales they have ever had, on their fourth largest circulation. That’s simply stellar business! Viz in 2019 has three books over 50k, nine more over 30k, 14 more over 20k, and 75 (!) others over 10k. They are a strong publisher.
KODANSHA
In a steady second place among manga publishers, we have Kodansha Comics, which places 42 titles within the top 750, with 300k in sales, and $5.1 million in calculated retail dollars (compared to 384k and $3.6m in 2018. This is their first up year in several.
Kodansha’s licenses formerly were both the original backbone of Tokyopop, as well as being the majority of Del Rey Manga. Kodansha pulled Tpop’s license in March of ’09 and Del Rey in October of ’10. You may want to look at those publishers’ listings below to get a better historical overview.
Kodansha’s current best-seller is the smaller, cheaper editions of “Sailor Moon”, where v1 does almost 15k sold at #1 for them. This is an interesting turn when compared with the thicker “Eternal Editions”, where v1 did a bit under of half of that at 7k. Four of the smaller version’s volumes place on the Top 750, along with three of the thicker ones. Still, that best-selling “Sailor Moon” is only #52 in the overall Manga best-sellers.
Kodansha’s #2 best-seller is “Fire Force” v1 at just over 12k. Three volumes of this series chart in the Top 750.
At #3 for Kodansha is “Fairy Tail”, where v1 is at just under 12k (this was 15k last year). Two other volumes appear in the Top 750, along with one volume of the “100 Years Quest” spinoff.
For #4 for Kodansha, we have “The Seven Deadly Sins”, where v1 racks about 11k sold. Three volumes of this series place in the Top 750.
And at #5 is “Attack on Titan”, where v1 and v27 each sell around 11k. Therte are nine volumes of this series charting in the Top 750, making this a great example of the “Hammock Principle” in practice. Briefly stated, books in a series generally sell in a sales pattern that looks like a hammock if you chart it out: the first few volumes and the last few volumes sell the best, with the ends running down into the middle volumes which have the lowest sales, like the sagging part of a hammock. The problem with this, as both stores that don’t have infinite rack space, as well as publishers that need a certain volume and velocity to keep things in print, that sagging middle becomes unsustainable for most series over time, and stores start to only carry the first and last few volumes.
These Long Tail figures are just for Kodansha-published titles, and they reflect that Kodansha, itself, first started publishing in 2010:
| Year | # of listed items | Percent Change | Total Unit Sold | Percent Change | Calculated Retail Value | Percent Change | Av. Sale per title | Av $ per title |
| 2010 | 9 | —— | 13,291 | —— | $322,717 | —— | 1477 | $35,857 |
| 2011 | 108 | 1200.00% | 197,021 | 1482.36% | $2,537,221 | 786.21% | 1825 | $23,493 |
| 2012 | 246 | 127.78% | 324,827 | 64.87% | $4,026,770 | 58.71% | 1320 | $16,369 |
| 2013 | 320 | 30.08% | 501,554 | 54.41% | $6,299,487 | 56.44% | 1567 | $19,686 |
| 2014 | 442 | 38.13% | 821,298 | 63.75% | $10,481,008 | 66.38% | 1858 | $23,713 |
| 2015* | 455 | 2.94% | 855,347 | 4.15% | $10,938,531 | 4.37% | 1880 | $24,041 |
| 2016* | 587 | 29.01% | 981,386 | 14.74% | $12,596,281 | 15.16% | 1672 | $21,459 |
| 2017 | 895 | 52.47% | 917,596 | -6.50% | $13,616,224 | 8.10% | 1025 | $15,214 |
| 2018 | 1060 | 18.44% | 870,940 | -5.08% | $12,612,501 | -7.37% | 822 | $11,899 |
| 2019 | 1177 | 11.04% | 989,089 | 13.57% | $15,838,708 | 25.58% | 840 | $13,457 |
In 2019, Kodansha has just six titles that sell over 10k, but otherwise their Long Tail seems reasonably healthy.
DARK HORSE
Jumping up to being the #3 manga publisher is Dark Horse. While they placed only 15 titles in the Top 750, those account for just over 148k copies sold and $4.2m in calculated retail value (up significantly from 2018).
The best-selling DH title continues to be “Berserk” v1, scoring just under 31k copies sold of the “Deluxe” version – you can compare that to about 11k sold of the “regular” version of “Berserk.” V2 of Deluxe also has big sales for v2 (18k) and v3 (11k).
Dark Horse also does very well with “Mob Psycho 100”, whose v1 nearly shifts 11k copies.
Looking at the Long Yail, this is what Dark Horse’s (manga only!) recent performance looks like – it’s up big, on a majorly dropped number of SKUs… though, to be fair, most of DH’s growth is really coming from those reformatted “Berserk” volumes. There is much more on Dark Horse down below in the “Western Publishers” section.
| Year | # of listed items | Percent Change | Total Unit Sold | Percent Change | Calculated Retail Value | Percent Change | Av. Sale per title | Av $ per title |
| 2007 | 341 | —— | 249,943 | —— | $3,329,464 | —– | 733 | $14,745 |
| 2008 | 420 | 23.17% | 248,981 | -0.38% | $3,176,870 | -4.58% | 593 | $7,564 |
| 2009 | 455 | 8.33% | 226,497 | -9.03% | $2,915,693 | -8.22% | 498 | $6,408 |
| 2010 | 473 | 3.96% | 194,494 | -14.13% | $2,633,077 | -9.69% | 411 | $5,567 |
| 2011 | 497 | 5.07% | 189,329 | -2.66% | $2,602,230 | -1.17% | 381 | $5,236 |
| 2012 | 493 | -0.80% | 112,373 | -40.65% | $1,631,038 | -37.32% | 228 | $3,308 |
| 2013 | 521 | 5.68% | 103,538 | -7.86% | $1,678,563 | 2.91% | 199 | $3,222 |
| 2014 | 559 | 7.29% | 100,894 | -2.60% | $1,617,251 | -3.65% | 180 | $2,893 |
| 2015* | 303 | -45.80% | 135,444 | 34.24% | $2,238,167 | 38.39% | 447 | $7,387 |
| 2016* | 225 | -25.74% | 174,298 | 28.69% | $2,291,355 | 2.38% | 775 | $10,184 |
| 2017 | 527 | 234.22% | 238,089 | 36.60% | $3,795,506 | 65.64% | 452 | $7,202 |
| 2018 | 531 | 0.76% | 224,010 | -5.91% | $3,579,135 | -5.70% | 422 | $6,740 |
| 2019 | 384 | -27.68% | 329,034 | 46.88% | $7,280,058 | 103.40% | 857 | $18,958 |
Dark Horse Manga has one book over 30k, and four more books over 10k.
YEN PRESS
The fourth largest publisher of manga in 2019, on the Top 750 of NPD BookScan continues to be Yen Press, which places 17 titles in the Top 750, for about 117k copies sold (down from 159k copies sold last year), and nearly $1.9 million of calculated retail gross (down from $2.4 million retail gross last year). Yen is a division of Hachette (more on them later).
Yen’s best-seller continues to be “Black Butler”, where v1 brings in just a hair under 13k in the bookstore market. This was 11k in 2018. Three other volumes also make the Top 750, though none sell over 10k.
They also do well with the reformatted “Fruits Basket”, which does a bit under 11k. Three other volumes of that series also place.
In the Long Tail, Yen is down for the third year in a row, but at least the gap is starting to shrink now.
| Year | # of listed items | Percent Change | Total Unit Sold | Percent Change | Calculated Retail Value | Percent Change | Av. Sale per title | Av $ per title |
| 2007 | 10 | —— | 12,896 | —— | $147,449 | —– | 1,290 | $14,745 |
| 2008 | 90 | 800.00% | 110,126 | 753.95% | $1,237,860 | 739.52% | 1,224 | $13,754 |
| 2009 | 211 | 134.44% | 330,962 | 200.53% | $3,697,113 | 198.67% | 1,569 | $17,522 |
| 2010 | 344 | 63.03% | 560,983 | 69.50% | $6,650,871 | 79.89% | 1,680 | $19,334 |
| 2011 | 460 | 33.72% | 764,125 | 36.21% | $9,953,966 | 49.66% | 1,661 | $21,639 |
| 2012 | 548 | 19.13% | 647,948 | -15.20% | $8,735,264 | -12.24% | 1,182 | $15,940 |
| 2013 | 654 | 19.34% | 692,380 | 6.86% | $9,715,421 | 11.22% | 1,059 | $14,855 |
| 2014 | 776 | 18.65% | 682,135 | -1.48% | $9,985,502 | 2.78% | 776 | $12,868 |
| 2015* | 649 | -16.37% | 917,620 | 34.52% | $13,248,445 | 32.68% | 1414 | $20,414 |
| 2016* | 793 | 22.19% | 1,072,008 | 16.82% | $15,520,207 | 17.15% | 1352 | $19,572 |
| 2017 | 1403 | 76.92% | 928,962 | -13.34% | $13,866,675 | -10.65% | 662 | $9,884 |
| 2018 | 1737 | 23.81% | 890,228 | -4.17% | $13,051,751 | -5.88% | 513 | $7,514 |
| 2019 | 1846 | 6.28% | 884,596 | -0.63% | $13,008,175 | -0.33% | 479 | $7,047 |
Yen Press has two titles selling over 10k copies in 2019.
SEVEN SEAS
Dropping to the #5 manga publisher as represented by the NPD BookScan Top 750 is Seven Seas, which places 18 titles for almost 110k copies sold combined, and a bit over $1.6 million in calculated retail value. This is a big drop from 2018 when they had sold 199k and had $3 million in sales.
Seven Seas’ biggest success in 2019 was “I Want To Eat Your Pancreas”. It sold just a tick over 9k copies.
Seven Seas’ Long Tail shows them as essentially flat in 2019.
| Year | # of listed items | Percent Change | Total Unit Sold | Percent Change | Calculated Retail Value | Percent Change | Av. Sale per title | Av $ per title |
| 2007 | 54 | —— | 50,641 | —— | $558,450 | —– | 938 | $10,342 |
| 2008 | 76 | 41.74% | 80,112 | 58.20% | $833,667 | 49.28% | 1,054 | $10,969 |
| 2009 | 97 | 27.63% | 74,967 | -6.42% | $807,666 | -3.12% | 773 | $8.326 |
| 2010 | 93 | -4.12% | 75,764 | 1.06% | $875,612 | 8.41% | 815 | $9,415 |
| 2011 | 118 | 26.88% | 116,360 | 53.58% | $1,426,618 | 62.93% | 986 | $12,090 |
| 2012 | 151 | 27.97% | 124,262 | 6.79% | $1,684,994 | 18.11% | 823 | $11,159 |
| 2013 | 223 | 47.68% | 204,419 | 64.51% | $2,942,608 | 74.64% | 917 | $13,196 |
| 2014 | 300 | 34.53% | 284,484 | 39.17% | $3,979,338 | 35.23% | 948 | $13,264 |
| 2015* | 304 | 1.34% | 374,715 | 31.72% | $5,177,568 | 30.11% | 1233 | $17,031 |
| 2016* | 417 | 37.17% | 491,947 | 31.29% | $6,960,634 | 34.44% | 1180 | $16,692 |
| 2017 | 554 | 32.85% | 478,336 | -2.77% | $6,801,527 | -2.29% | 863 | $12,277 |
| 2018 | 906 | 63.54% | 667,556 | 39.56% | $9,511,591 | 39.84% | 737 | $10,498 |
| 2019 | 1049 | 15.78% | 671,362 | 0.57% | $9,498,329 | -0.14% | 640 | $9,055 |
Seven Seas has no titles that sold over 10k this year.
Vertical
The sixth largest publisher of manga as measured by the NPD BookScan, and the final one to appear in the Top 750, continues to be Vertical. They place just four books into the Top 750, 28k copies, for $546k – that’s not very different from the previous year, down a teeny bit
Their best-seller is “The Complete Chi’s Sweet Home” with v1 selling just over 10k.
The Long Tail is up a bit… but essentially flat.
| Year | # of listed items | Percent Change | Total Unit Sold | Percent Change | Calculated Retail Value | Percent Change | Av. Sale per title | Av $ per title |
| 2007 | 25 | —— | 23,444 | —— | $417,914 | —— | 938 | $16,717 |
| 2008 | 34 | 36.00% | 21,003 | -10.41% | $343,109 | -8.21% | 617 | $10,091 |
| 2009 | 39 | 14.71% | 19,434 | -7.47% | $325,437 | -5.15% | 498 | $8,345 |
| 2010 | 62 | 58.97% | 33,097 | 70.30% | $494,098 | 51.83% | 534 | $7,969 |
| 2011 | 84 | 35.48% | 49,062 | 48.24% | $699,253 | 41.52% | 584 | $8,324 |
| 2012 | 118 | 40.48% | 45,026 | -8.23% | $671,086 | -4.03% | 382 | $5,687 |
| 2013 | 159 | 34.75% | 61,906 | 37.49% | $1,128,252 | 68.12% | 389 | $7,096 |
| 2014 | 187 | 17.61% | 83,312 | 34.58% | $1,491,984 | 32.24% | 446 | $7,979 |
| 2015* | 162 | -13.37% | 110,172 | 32.24% | $1,956,167 | 31.11% | 680 | $12,075 |
| 2016* | 185 | 14.20% | 172,792 | 56.84% | $2,931,568 | 49.86% | 934 | $15,846 |
| 2017 | 269 | 45.41% | 181,216 | 4.88% | $3,178,964 | 8.44% | 674 | $11,818 |
| 2018 | 339 | 26.02% | 162,840 | -10.14% | $2,784,106 | -12.42% | 480 | $8,213 |
| 2019 | 387 | 14.16% | 163,631 | 0.49% | $2,835,473 | 1.85% | 423 | $7,327 |
Vertical has a single book over 10k.
There’s only one other Manga that isn’t covered in the above survey, and this is from Ten Speed Press: “The Life Changing Manga of Tidying Up”, which sold nearly 26k.
Manga is a pretty closed system, overwhelmingly controlled by a single vendor…. And it is very difficult seeing that change in any meaningful way in the future.
2019 Western Publishers
When I say “Western” here, I mean publishers/work from Europe and America, as opposed to Asia, not publishers of the genre of “western” comics!
I’d like to continue to remind you that back in 2008 there was some sort of behind-the-scenes recategorization in what got sent to me – I now know this is probably a change in BISAC codes! – and most of the “cartoon-strip humor” books like “Calvin & Hobbes” and “The Far Side” suddenly disappeared, so there’s kind of a not-strictly apples thing going on with the pre-2008 numbers here. Do keep that in mind when making comparisons both in the Top 750 chart, as well as the Long Tail.
 NPD BookScan itself does not try to control how data gets initially logged (or changed), leaving that all to publishers. I think that I understand this reasoning: the publisher is the customer, and they should have some level of control over how they are represented, but as a person who tries to decipher the data each year, I know that I would prefer some sort of internally consistent (and externally-petitionable!) method of categorizing titles that doesn’t seem to change in some fashion from year-to-year – Books will appear and disappear, almost seemingly willy-nilly, and it makes showing you anything even resembling consistent data staggeringly difficult. All of this is a function of how publishers assign BISACs and in what order – see the preamble!
Another observation I have is that NPD BookScan tracks (theoretically at least, since again, publishers set their own BISACs) Adult reading distinctly from YA and Kids. I don’t. Part of this is that I’m a bookseller, and I’m rather agnostic about who specifically buys books as a result. But I have to be certain to make this point as clearly as I can: the market for who is buying comics is changing, and it is changing for the wider and the better. The eight-year-old who is inhaling Dav Pilkey in 2019 is going to be the comics-literate adult of 2032 (or whatever), which is going to change what comics readers in the ‘30s will want or expect from comics. The kids reading comics in 1965 totally imagined what the 1980s comics scene could and would be, which is why we’re where we are today, but the shape of the Western industry in the future is absolutely what today’s children read and see.
Ignore this at your deadliest of perils.
OK, enough editorializing; let’s look at the market!
Here’s the Top 750 over time:
| Year | # of placing titles | Unit sales | Calculated Retail price |
| 2003 | 304 | 2,133,618 | $32,360,644 |
| 2004 | 233 | 1,467,535 | $22,713,802 |
| 2005 | 142 | 1,315,920 | $21,537,155 |
| 2006 | 174 | 1,689,571 | $29,314,852 |
| 2007 | 175 | 1,746,962 | $33,247,187 |
| 2008 | 236 | 2,710,175 | $48,327,594 |
| 2009 | 299 | 3,219,748 | $52,147,410 |
| 2010 | 314 | 3,297,317 | $54,515,605 |
| 2011 | 358 | 3,068,593 | $77,254,870 |
| 2012 | 383 | 3,530,143 | $68,593,986 |
| 2013 | 435 | 3,988,864 | $74,805,932 |
| 2014 | 479 | 4,910,846 | $90,166,989 |
| 2015* | 471 | 6,729,449 | $115,035,044 |
| 2016* | 439 | 7,338,541 | $123,594,588 |
| 2017 | 466 | 7,846,357 | $117,761,519 |
| 2018 | 451 | 9,114,745 | $129,929,990 |
| 2019 | 418 | 11,998,489 | $176,470,137 |
Up almost 32% in pieces, up 36% in calculated retail dollars, the highest totals in this tranche that we have ever seen – it’s a staggeringly good year for Western comics, as reported to NPD BookScan in 2019! You will note that Manga, in the Top 750, grew slightly more than Western comics, even with those Dav Pilkey numbers.
If we were to look at the entirety of NPD BookScan’s reported numbers for the total 30,816 “Western” comics, things look generally like this – there are 1532 publishers listed in the 2018 chart, but only 14 of them manage to capture more than 1% of the market.
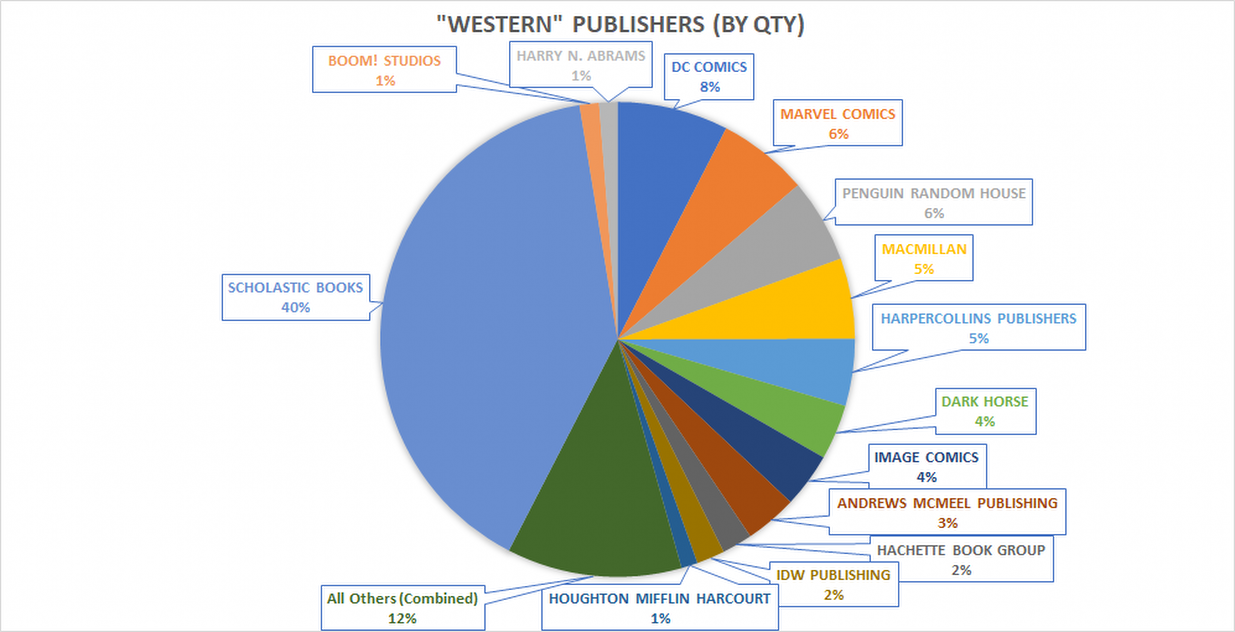 This is not quite as lopsided as the Manga chart…. But it is getting there a little? One publisher has 40% of all graphic novels sold.
Let’s start with a look at the Long Tail for Western publishers collectively:
| Year | # of listed items | % Change | Total Pieces | % Change | Calculated Retail Value | % Change | Av. Sale per title | Av $ per title |
| 2007 | 6950 | — | 3,029,039 | — | $74,595,605 | — | 436 | $10,733 |
| 2008 | 9728 | 39.97% | 5,368,678 | 77.24% | $98,233,459 | 31.69% | 552 | $10,098 |
| 2009 | 10,936 | 12.30% | 5,946,595 | 10.76% | $107,263,294 | 9.19% | 544 | $9,808 |
| 2010 | 13,229 | 20.97% | 5,890,507 | -0.01% | $105,342,577 | -0.02% | 445 | $7,963 |
| 2011 | 14,954 | 13.04% | 6,001,731 | 1.89% | $112,823,763 | 7.10% | 401 | $7,545 |
| 2012 | 17,031 | 13.89% | 6,052,179 | 0.84% | $123,471,753 | 9.44% | 355 | $7,250 |
| 2013 | 17,468 | 2.57% | 6,637,420 | 9.67% | $131,767,547 | 6.72% | 380 | $7,543 |
| 2014 | 19,524 | 11.77% | 7,905,939 | 19.11% | $156,040,431 | 18.21% | 405 | $7,992 |
| 2015* | 18,019 | -7.71% | 10,689,116 | 34.44% | $197,553,909 | 26.60% | 593 | $10,964 |
| 2016* | 16,328 | -9.38% | 11,516,867 | 7.74% | $212,698,759 | 7.67% | 705 | $13,027 |
| 2017 | 25,183 | 54.23% | 12,544,715 | 8.92% | $217,360,776 | 2.19% | 498 | $8,631 |
| 2018 | 27,583 | 9.53% | 13,865,209 | 10.53% | $230,924,408 | 6.24% | 503 | $8,372 |
| 2019 | 30,816 | 11.72% | 17,233,606 | 24.29% | $288,745,613 | 25.04% | 559 | $9,370 |
Fantastic collective performance, and one that really points out the errors in the ’15-’16 data – as noted above, I now believe that the leaked data those years was only for “in print” books. Comics are pretty clearly a growing medium, by like three million books a year (!). Compare that first year of Long Tail to the current one: it’s 567% growth in pieces. Wow!
The challenge for the market is for how we grow and adapt to the changes in taste that are becoming clear: “traditional” genres and sellers are starting to suffer in the face of a new widening of the market. From 20,000 feet this seems mostly healthy, even though it seems clear that every participant isn’t going to be able to thrive. We’ll cover that down in the weeds, below!
Next, we’ll survey each of the publishers, and their best-selling titles, ranking them by the number of pieces they sold this year with the Top 750 of NPD BookScan. We’ll also look at the “Long Tail” for each entry, discussing the entirety of NPD BookScan.
SCHOLASTIC
It is now the fifth year in the row that our #1 Western publisher in the Top 750 is Scholastic. This is the new reality of a thing that seems super unlikely to change against them anytime soon. Look at the overall market, and pause and wonder at that dominating 40% market share of pieces sold – up significantly from 33% last year. Consider for a moment that Scholastic has done this with only two hundred and seventy books, total! Consider for a second moment that Scholastic only started “doing” comics in 2005.
Just limiting ourselves to the Top 750, Scholastic surged forward in sales this year by selling an astonishing 6.7 million copies, from 73 placing books This is an incredible 49% growth from last year (4.5 million copies), which itself was up 67% from 2017 (2.7 million). In calculated retail dollars, we’re looking at almost $86.4 million in sales.
This is all the more incredible when you start to think that these are sales to book stores (and Amazon) only – none of these numbers (as far as I know) include the direct-to-families sales that happen via the incredibly successful Scholastic Book Fairs. Nor does this count any sales that are being done to elementary and middle school libraries, numbers that likely exceed retail sales. Possibly by a multiple.
Also consider that the next largest publisher sold a combined 815k copies in the Top 750, less than an eighth of scholastic volume. Or, how about this: if you combine the Top 750 performance of all of the Diamond Comic “Premier” publishers (Boom!, Dark Horse, DC, Dynamite, Image and Marvel) those combined best-sellers only amount to 1.4 million books, or only a fifth of Scholastic alone. Scholastic is, quite simply, dominant.
Scholastic has several imprints – besides the Graphix imprint, they also publish Arthur A. Levine and Blue Sky.
In alphabetical order by imprint:
Arthur A. Levine places one book into the Top 750 just as they have for years, and it’s the same book: just a bit under 7kk copies of “The Arrival” by Shaun Tan.
Blue Sky is also just one book in the Top 750 – Dav Pilkey’s “Ook & Gluk, Kung-Fu Cavemen” shifting 14k copies, much of that you can assume being a sidestream of the success “Dog Man.”
The Graphix imprint has 59 placing titles, for just nearly 6.5m in sales, and is where the big hits live: the aforementioned “Dog Man” and all of Raina Telgemeier’s books, all of which are discussed up top. “Dog Man” alone shifts nearly 4.2 million books, to recap. Telgemeier sells “only” 1.3m. All of the Scholastic Top Ten is from one of those two authors. As are 15 of the Top Twenty.
The post-Telgemeier “Baby Sitter’s Club” continues great without her – the three Gale Galligan-adapted books sell more than 356k copies combined, with “Boy Crazy Stacey” (156k) being the #11 seller for Scholastic, while “Kristy’s Big Day” (83k) is #20.
The next biggest line for Scholastic is the adaptations of the “Wings of Fire” books: “The Lost Heir” (129k) is #13, “The Dragonet Prophecy” (112k) is #16, and “The Hidden Kingdom” (94k) is #18.
While not in the Top 20 for them, Graphix also does fantastic with Kazu Kibuishi’s “Amulet” – v1 (“The Stonekeeper”) moves 42k books, and in full “hammock” style, v8 (“Supernova”) sells 39k. Even the combined boxset of v1-8 moves almost 16k units. The eight books, and two different box sets combine for 224k copies sold within the Top 750.
Also not in Graphix’s Top 20, but shifting over 20k each includes Jarrett Krosoczka’s “Hey Kiddo” at just under 34k, Jennifer Holm’s “Sunny Rolls the Dice” at 32k, Kristen Gudsnuk’s “Making Friends” at 26k, and Jim Benton’s “Catwas: Its Me” at 25k.
Jeff Smith’s “Bone,” which largely launched Graphix, places three of the nine volumes into the Top 750 this year. V1, “Out From Boneville,” sells almost 12k copies this year.
Scholastic also publishes as “Scholastic”, straight up, and they place 10 more titles that way. The big hit is more Dav Pilkey, as “The Adventures of Super Diaper Baby” sells some 28k copies sold, while Jeffrey Brown’s “Jedi Academy” books continue to place: the first volume of that perennial series sold almost 10k copies this year.
The Long Tail for Scholastic looks like this – more insane growth:
| Year | # of listed items | Percent Change | Total Unit Sold | Percent Change | Calculated Retail price | Percent Change | Av. Sale per title | Av $ per title |
| 2007 | 28 | —— | 203,900 | —— | $2,018,694 | —– | 7282 | $72,096 |
| 2008 | 39 | 39.29% | 346,134 | 69.76% | $3,498,012 | 73.28% | 8875 | $89,693 |
| 2009 | 52 | 33.33% | 432,070 | 24.83% | $4,654,686 | 33.07% | 8309 | $89,513 |
| 2010 | 60 | 15.38% | 361,086 | -16.43% | $4,084,718 | -12.25% | 6018 | $68,079 |
| 2011 | 72 | 20.00% | 419,010 | 16.04% | $4,708,860 | 15.28% | 5819 | $65,401 |
| 2012 | 76 | 5.56% | 325,088 | -22.42% | $3,955,249 | -16.00% | 4277 | $52,043 |
| 2013 | 91 | 19.74% | 437,590 | 34.61% | $5,365,921 | 35.67% | 4809 | $58,967 |
| 2014 | 97 | 6.59% | 846,277 | 93.39% | $10,204,175 | 90.17% | 8725 | $105,198 |
| 2015* | 140 | 44.33% | 1,449,296 | 71.26% | $17,170,714 | 68.27% | 10,352 | $122,648 |
| 2016* | 131 | -6.43% | 1,940,760 | 33.91% | $23,919,704 | 39.31% | 14,815 | $182,593 |
| 2017 | 166 | 26.72% | 2,823,345 | 45.55% | $33,884,541 | 41.66% | 17,008 | $204,124 |
| 2018 | 224 | 34.94% | 4,623,212 | 63.75% | $54,645,209 | 61.27% | 20,639 | $243,952 |
| 2019 | 270 | 20.54% | 6,868,794 | 48.57% | $88,878,195 | 62.65% | 25,440 | $329,179 |
Scholastic has one book at over a million copies, another over 700k, one more over 500k, another six over 250k, seven more over 100k, seven more over 50k, 14 more over 20k, and another staggering 16 over 10k. Whew! Any other publisher would be satisfied with a tiny fraction of that.
Scholastic seems more and more like an unstoppable juggernaut to me: the vast majority of their portfolio is extremely likely to go on to “perennial seller” status. And I continue to dream about what might happen if they decided to do two streams of revenue and serialized first before eventual collection.
HARPERCOLLINS
Surging forward to the #2 largest publisher with Western comics in NPD BookScan Top 750 in 2019 is the first of the traditional “big five” book publishers: HarperCollins. Harper places 23 books into the Top 750 for a total of 816k copies sold, and a calculated retail cover price of $12.6 million – this is up from 2018’s result of 448k sold and $6.5m There’s a lot of imprints with the word “Harper” in the title in the Long Tail (Harper, Harper Paperbacks, Harper Teen, Harper Festival, Harper Teen, and so on), and Harper is also Blazer & Bray, Quill Tree and William Morrow (in the Top 750); as well as Amistad, IT books and Zondervan (out of the Top 750).
At Balzer & Bray it is all about Terri Libenson, and “Just Jaime” leads the pack with an amazing 105k sold. Libenson also does exceptionally well with “Positively Izzy” and “Invisible Emmie”, each of which shifts 45k copies sold. There’s also a box set of those two which moves over 16k copies.
At the various Harper-named imprints, their biggest hit is from “Minecraft-inspired YouTube star PopularMMOs” with “PopularMMOs Presents Enter the Mine” crossing 81k in sales, while “PopularMMOs Presents A Hole New World” does 44k. The third best-seller is the comics adaptation of “To Kill a Mockingbird,” coming in just shy of 27k.
Harper also does well with “Warriors: Graystripe’s Adventure” (14k), while “Warriors: Ravenpaw’s Path” comes in at 11k. There’s also another YouTube-based comic from “DanTDM”, with “DanTDM: Trayaurus and the Enchanted Crystal” (12k).
The Harper imprint Quill Tree has a big hit with Jerry Craft’s “New Kid” (84k), while perpetual seller “Nimona” brings in 13k.
Finally, the William Morrow imprint has the single most successful book aimed at adults (as noted in the initial market overview) with 243k copies of “Strange Planet” burning up the charts. They are also able to place 13k copies of the everyone-should-have-in-their-library “Understanding Comics.”
Nothing else is over 10k, so here is the Long Tail:
| Year | # of listed items | Percent Change | Total Unit Sold | Percent Change | Calculated Retail value | Percent Change | Av. Sale per title | Av $ per title |
| 2007 | 18 | —— | 36,940 | —— | $600,540 | —– | 2052 | $33,363 |
| 2008 | 36 | 100.00% | 48,264 | 30.66% | $863,808 | 43.84% | 1341 | $23,995 |
| 2009 | 42 | 16.67% | 81,774 | 69.43% | $1,308,891 | 15.53% | 1947 | $31,164 |
| 2010 | 41 | -2.38% | 64,429 | -21.21% | $719,328 | -45.04% | 1571 | $17,545 |
| 2011 | 50 | 21.95% | 75,394 | 17.02% | $1,083,609 | 50.64% | 1508 | $21,672 |
| 2012 | 80 | 60.00% | 159,573 | 111.65% | $2,113,744 | 95.07% | 1995 | $26,422 |
| 2013 | 68 | -15.00% | 197,595 | 23.83% | $2,667,933 | 26.22% | 2906 | $39,234 |
| 2014 | 115 | 69.12% | 158,193 | -19.94% | $2,398,836 | -10.09% | 1376 | $21,042 |
| 2015* | 109 | -5.22% | 188,181 | 18.96% | $2,646,378 | 10.32% | 1726 | $24,279 |
| 2016* | 108 | -0.09% | 261,183 | 38.79% | $4,473,589 | 69.05% | 2418 | $41,422 |
| 2017 | 107 | -0.09% | 357,972 | 37.06% | $5,530,994 | 23.64% | 3346 | $51,692 |
| 2018 | 148 | 38.32% | 517,800 | 44.65% | $7,506,751 | 35.72% | 3499 | $50,721 |
| 2019 | 154 | 4.05% | 891,701 | 72.21% | $13,894,052 | 85.09% | 5790 | $90,221 |
Harper has one book over 200k, one over 100k, two over 75k, a further four books over 20k, and another six more over 10k.
PENGUIN RANDOM HOUSE
Sticking to #3 is another of the “Big Five” traditional book publishers: Penguin Random House. They land 45 titles, selling 795k copies for nearly $12.6m in gross sales.
Like a lot of the “big five” book publishers, these companies have lots and lots of imprints built up over decades of publishing books. Penguin Random House, as best as I can tell, has twelve distinct imprints that appear in the Top 750 list for 2018 – Alfred A. Knopf, Ballantine, Clarkson N. Potter, Crown, Del Rey, Dial, Nan A. Talese, One World, Pantheon, Random House Books For Younger Readers, Ten Speed, and Tundra.
They’re also, in the Long Tail: (deep breath!) Ace, Bantam, Berkley, Blue Snake, Broadway Books, Doubleday, Dutton, Emblem, Golden, Gotham Books, G.P. Putnam & Sons, Grossett & Dunlap, Hudson Street, InkLit, Knopf, McClelland & Stewart, Montena, New American Library, Penguin, Philomel, Plume, Price Stern Sloan, Puffin, Putnam, Razorbill, Riverhead, Rodale, Schocken, Schwartz & Wade, Tarcherperigee, Three Rivers, Triangle, Viking, Villard, Waterbrook, Watson-Guptill and Yearling (whew!). However, they are not (Brian writes down here so he remembers this research next year) the PRH-distributed-only Angry Robot, Beacon, Campfire, Charlesbridge, Dragonfly, Fawcett, Frog In Well, Library of America, Overlook Press, Powerhouse, Quirk, Sasquatch, Shambhala, Universe, or Verso.
Looking at those imprints in alphabetical order, within the Top 750:
Alfred A. Knopf Books For Younger Readers places three books into the Top 750, Beginning with 33k copies of “White Bord: A Wonder Story”, and following through with “The Cardboard Kingdom” by Chad Sell, which sells 19k. There’s also the first volume of Jarrett J. Krosocza’s “Lunch Lady” series at a bit over 6k.
Ballantine places four titles in the Top 750: They are all different “Garfield” volumes ranging from 4900-6700 copies each.
Clarkson N Potter has a second frame of Mari Andrews’ “Am I There Yet? The Loop-de-loop Zigzagging Journey to Adulthood” selling 9200 copies – this sold 48k last year, so that’s a pretty sharp drop.
Crown Books for Younger Readers succeeds big with Lincoln Peirce’s “Max and the Midknights” at 45k sold.
Del Rey publishes the Dave Wenzel adaptation of “The Hobbit” for about 11k copies.
Dial places three books, with two by Victoria Jamieson: “Roller Girl”, at almost 28k, and “All’s Faire in Middle School” with 19k. They also sell 8200 copies of Chris Eliopoulos’ “Cosmic Commandos.”
Nan A. Talese places 26k copies of the adaptation of “The Handmaid’s Tale.”
One World does 9400 copies of “Good Talk: A Memoir in Conversations.”
Pantheon is their “literary” comics wing, and has some of PRH’s best-sellers. There are nine placing in 2019, including Marjane Satrapi’s “Persepolis” as the lead book, which sells 60k of volume 1. As always surprises me with Pantheon books, way way less people read v2, only about a tenth at 6500 copies. But the Complete edition does 19k. Similarly, Art Spiegelman’s “Maus” continues its multi-decade success with 27k copies of v1, 10k of v2, and 22k copies of the Complete edition. Pantheon also does well with 15k copies of the adaptation of “Anne Frank’s Diary,” and 11k copies of Chris Ware’s “Rusty Brown.”
Random House Books For Younger Readers (Catchy imprint name!) places eleven titles into the Top 750, led by Judd Winick’s “Hilo”, where v5 does 29k, v1 does 14k, v4 does 12k, and three other entries selling under 10k.
Ten Speed Press brings us a single title: “Cheshire Crossing” with about 6200 copies sold. (Plus they have that single volume of Manga of the adaptation of “The Life-Changing Manga of Tidying Up,” listed in the manga section.)
And finally, Tundra has PRH’s best-selling titles with Ben Clanton’s “Narwhal: Unicorn of the sea” series, another juvie-aimed title. V4 launches at 71k in HC, while the softcovers of v1 does almost 49k, v3 does 43k, and v2 does 37k. Then on top of that, it’s still selling in HC too, with v3 shifting 20k and v1 selling 18k. All together in all formats, it places 258k copies between nine edition/formats.
Penguin Random House formed out of a merger in 2013 – prior to that they were separate publishers Penguin and Random House. Here’s what the Long-Tail for the combined Penguin Random House looked like in 2019:
| Year | # of listed items | % Change | Total Pieces | % Change | Calculated Retail Value | % Change | Av. Sale per title | Av $ per title |
| 2013 | 282 | ——- | 447,174 | ——- | $7,259,364 | ——- | 1,586 | $25,742 |
| 2014 | 252 | -10.64% | 428,634 | -4.15% | $7,415,712 | 2.15% | 1,701 | $29,427 |
| 2015* | 450 | 78.57% | 513,611 | 19.83% | $8,517,761 | 14.49% | 1,141 | $18,928 |
| 2016* | 293 | -34.88% | 435,877 | -15.13% | $7,150,087 | -16.06% | 1,488 | $24,403 |
| 2017 | 409 | 39.59% | 664,858 | 52.53% | $10,136,224 | 41.76% | 1,626 | $24,783 |
| 2018 | 613 | 49.88% | 760,314 | 14.36% | $11,136,058 | 9.86% | 1,240 | $18.166 |
| 2019 | 635 | 3.59% | 1,013,092 | 33.25% | $15,745,448 | 41.39% | 1,595 | $24,796 |
However, I’m not willing to pull an “We’ve always been at war with East Asia” moment, so let’s look at the individual pieces of the past. This is what Penguin Putnam (Ace, Berkley Books, Dial, Dutton, Gotham Books, Grossett & Dunlap, Hudson Street, InkLit, New American Library, Penguin, Philomel, Plume, Price Stern Sloan, Puffin, Putnam, Razorbill, Riverhead and Viking) used to look like alone).
| Year | # of listed items | % Change | Total Pieces | % Change | Calculated Retail Value | % Change | Av. Sale per title | Av $ per title |
| 2007 | 18 | —— | 13,545 | —— | $178,260 | —— | 753 | $9,903 |
| 2008 | 28 | 55.56% | 28,606 | 111.19% | $310,856 | 74.38% | 1022 | $11,102 |
| 2009 | 39 | 39.29% | 40,288 | 40.84% | $444,928 | 43.13% | 1033 | $11,408 |
| 2010 | 45 | 15.38% | 50,628 | 25.67% | $623,650 | 40.17% | 1125 | $13,859 |
| 2011 | 53 | 17.78% | 123,749 | 144.43% | $1,576,161 | 152.73% | 2335 | $29,739 |
| 2012 | 60 | 13.21% | 121,769 | -1.60% | $1,499,660 | -4.85% | 2029 | $24,994 |
This is what Random House (Alfred A. Knopf, Ballantine, Bantam, Broadway, Crown, Del Rey, Doubleday, Pantheon, Random House, Schocken, and Three Rivers) looked like alone:
| Year | # of listed items | % Change | Total Pieces | % Change | Calculated Retail value | % Change | Av. Sale per title | Av $ per title |
| 2007 | 74 | — | 216,580 | — | $2,890,347 | — | 2,927 | $39,059 |
| 2008 | 77 | 5.47% | 383,105 | 76.89% | $5,698,922 | 97.17% | 4,975 | $74,012 |
| 2009 | 109 | 41.56% | 405,598 | 5.87% | $5,398,890 | -5.26% | 3,721 | $49,531 |
| 2010 | 132 | 21.10% | 389,410 | -3.99% | $5,831,814 | 8.02% | 2,950 | $44,180 |
| 2011 | 144 | 9.09% | 397,143 | 1.99% | $6,356,212 | 8.99% | 2,760 | $44,140 |
| 2012 | 185 | 28.47% | 375,254 | -5.51% | $7,124,794 | 12.09% | 2,028 | $38,512 |
Penguin Random House has two titles over 50k, ten additional books over 20k, and another 11 books over 10k.
HOLTZBRINK/MACMILLAN
Coming in at #4 is Holtzbrinck, which owns Macmillan, another of the “big five”, and is also one of those publishers with lots and lots (and lots) of imprints: Farrar Straus Giroux, FirstSecond, Henry Holt, Hill + Wang, and Square Fish are the only five to make the Top 750, but there are others down into the Long Tail as well – I have also identified Feiwel & Friends, Metropolitan, Picador, Roaring Brook, Rodale Press, St. Martins Griffin, Times books, and Tor. Holtzbrinck also distributes several other publishers they don’t own (including Bloomsbury, Drawn & Quarterly, Papercutz, and Seven Seas) Holtzbrinck-owned companies placed 38 titles in the Top 750, for about 669k and about $10.8m combined.
By imprint, we start alphabetically with Farrar Straus Giroux which has two placers in the Top 750: None of them hit 10k, but the biggest is Emily Carroll’s adaptation of “Speak” (about 9500 sold).
FirstSecond is their strongest imprint, with 31 books placing into the Top 750, and where they score their biggest hit Shannon Hale’s juvie-focused “Best Friends” with 134k. This is a sequel to “Real Friends” which pulls in 47k. This is followed closely by the for-adults “The Adventure Zone”, which debuts v2, “Murder on the Rockport Limited!” at 91k, while v1, “Here There Be Gerblins” sells 36k, and an additional 12k in a Barnes & Noble exclusive version. FirstSecond also does terrific with Rainbow Rowell’s “Pumpkinheads” (25k), Vera Brosgol’s “Be Prepared” (23k), Jen Wang’s “The Prince and the Dressmaker” (about 21k), and Kevin Panetta’s “Bloom” (21k).
Henry Holt doesn’t hit any heights like that, but they place “Epic Athletes: Stephen Curry” for about 5400 copies.
Hill + Wang places the adaptation of “Fahrenheit 451” with a scootch under 5k.
Square Fish’s deal is cheaper repackaging from other imprints (I don’t personally get this business model) and has three placing titles. Gene Yang’s “American Born Chinese” does just over 32k, while Hope Larson’s adaptation of “A Wrinkle In Time” brings in nearly 11k.
Here’s Holtzbrinck’s Long Tail (again, I might have missed an imprint somewhere – trying to tease them all out is a difficult task from their Byzantine org chart).
| Year | # of listed items | Percent Change | Total Unit Sold | Percent Change | Calculated Retail value | Percent Change | Av. Sale per title | Av $ per title |
| 2007 | 39 | —— | 31,452 | —— | $559,681 | —– | 806 | $14,351 |
| 2008 | 66 | 69.23% | 63,473 | 101.81% | $1,132,767 | 102.40% | 962 | $17,163 |
| 2009 | 88 | 33.34% | 84,090 | 32.48% | $1,438,044 | 26.95% | 956 | $16,341 |
| 2010 | 108 | 22.73% | 68,599 | -18.42% | $1,085,311 | -24.53% | 635 | $10,049 |
| 2011 | 139 | 28.70% | 114,243 | 66.54% | $1,794,084 | 65.31% | 822 | $12,907 |
| 2012 | 165 | 18.71% | 126,745 | 10.94% | $2,077,143 | 15.78% | 768 | $12,589 |
| 2013 | 187 | 13.33% | 142,375 | 12.33% | $2,395,569 | 15.33% | 761 | $12,811 |
| 2014 | 222 | 18.72% | 190,682 | 33.93% | $3,096,858 | 23.27% | 859 | $13,950 |
| 2015* | 104 | -53.15% | 99,223 | -47.96% | $1,804,001 | -41.75% | 954 | $17,346 |
| 2016* | 272 | 161.54% | 272,668 | 174.80% | $4,240,075 | 135.04% | 1,002 | $15,589 |
| 2017 | 336 | 23.53% | 437,258 | 60.36% | $6,616,130 | 56.04% | 1,301 | $19,691 |
| 2018 | 427 | 27.08% | 723,096 | 65.37% | $11,701,046 | 76.86% | 1,693 | $27,403 |
| 2019 | 494 | 15.70% | 946,680 | 30.92% | $15,814,819 | 35.16% | 1,916 | $32,014 |
Holtzbrinck has one book over 100k, one over 50k, seven more over 20k, and eight others over 10k.
ANDREWS MCMEEL
Dropping in position by a few in the Top 750, the #5 publisher is now Andrews McMeel. Andrews is a publisher that sometimes has frustrated me by how they’ve been represented by NPD BookScan – as I noted, it used to be that “humor” books like “Far Side” and “Calvin & Hobbes” used to rule the NPD BookScan charts. Until, one day, poof! Almost all of those books disappeared entirely from the dataset I was given, throwing off a whole lot of my comparables. And, for the most part, comic strip reprints have stayed out of these charts for half a decade. But, they’ve started creeping back into the listings for the last few years. I’m actually fine with comic strips and comic books co-existing in the same places – at least they’re both comics – but the inconsistency just drives me nucking futz.
I found 33 titles from Andrews in the Top 750 in 2018, for 538k copies and $9.7 million in sales, but clearly that number would scale up to some large degree if it listed all of the strip collections they publish. What’s interesting about Andrews McMeel is that, for the most part, their “graphic novels” are reformatted/repackaged newspaper strips. In other words, this is basically the other paid-for way one can serialize work: through syndicated newspaper pages.
2019’s big star for Andrews McMeel is Dana Simpson’s “Phoebe and Her Unicorn” where v1 sells just over 94k copies. V2 sells 29k, v3 and v10 each sell 21k. Sum up all the placing volumes, and we’re talking 255k sold this year.
The big runner up is Lincoln Pierce and “Big Nate”. there are 15 different “Big Nate” volumes in the Top 750, summing up to just over 205k copies combined. The best seller (“Big Nate Goes Bananas!”) sells around 44k copies.
There’s also a smattering of “traditional” strips here: I can see the $125 “Complete Calvin & Hobbes” here (23k copies, which would make that the #10 dollar book in the entire NPD BookScan chart) as well as the $100 “The Complete Far Side” (13k copies – or #28 in all comics in dollars). But we’re still missing most of the individual volumes for Watterson, and Larsen. Andrews McMeel also sells 16k copies of the adaptation of “Anne of Green Gables.”
Andrews McMeel’s Long Tail chart is just about the most useless one of all because they publish a whole lot of comics (humor strips, like “Calvin & Hobbes”) where the BISAC changed to something we’re having a hard time properly getting – almost certainly they’re doing several times better than this chart would suggest because of those books. Further, things appear and disappear in a way I’ve never been able to make sense of – it might be them changing BISACs after the fact. Most of my comparatives are terrible and counterproductive here, and I really apologize for the weakness of my data in this specific instance.
| Year | # of listed items | Percent Change | Total Unit Sold | Percent Change | Calculated Retail Value | Percent Change | Av. Sale per title | Av $ per title |
| 2007 | 22 | —— | 29,835 | —— | $461,238 | —– | 1,356 | $20,965 |
| 2008 | 20 | -9.09% | 25,115 | -15.82% | $388,965 | -15.67% | 1,256 | $19,448 |
| 2009 | 21 | 5.00% | 26,205 | 4.34% | $401,982 | 3.35% | 1,248 | $19,142 |
| 2010 | 19 | -9.52% | 47,181 | 80.05% | $544,852 | 35.54% | 2,483 | $28,676 |
| 2011 | 17 | -10.53% | 116,850 | 147.66% | $1,222,171 | 124.31% | 6,874 | $71,892 |
| 2012 | 31 | 82.53% | 225,546 | 93.02% | $2,737,935 | 124.02% | 7,276 | $88,320 |
| 2013 | 43 | 38.71% | 343,681 | 52.38% | $3,747,799 | 36.88% | 7,993 | $87,158 |
| 2014 | 59 | 37.21% | 373,713 | 8.74% | $4,387,252 | 17.06% | 6,334 | $74,360 |
| 2015* | 76 | 28.81% | 502,061 | 34.34% | $5,950,368 | 35.63% | 6,606 | $78,294 |
| 2016* | 85 | 11.84% | 472,145 | -5.96% | $5,147,673 | -13.49% | 5,555 | $60,561 |
| 2017 | 140 | 64.71% | 520,554 | 10.25% | $5,644,031 | 9.64% | 3,718 | $40,315 |
| 2018 | 273 | 95.00% | 735,184 | 41.23% | $11,862,349 | 210.18% | 2,693 | $43,452 |
| 2019 | 277 | 1.46% | 611,784 | -16.79% | $11,078,977 | -6.60% | 2,209 | $39,996 |
Andrews McMeel has one book over 75k, six more over 20k, and 16 others over 10k.
DC ENTERTAINMENT
Recovering a bit in 2019, #6 publisher in the Top 750 is DC Entertainment. DC spent a really long time as the #1 Western publisher before losing it to Scholastic, and was #2 until last year, where they dropped to a weirdly low #9. Here they make up some of that.
In 2019 they placed just 33 titles in the Top 750, for just under 414k units, and $9.7 million in calculated retail price. DC has four charting imprints: DC Black Label, DC, DC Zoom, and Vertigo. Deep in the Long Tail we can still track America’s Best Comics, Mad, Wildstorm, Paradox, Minx, and CMX – makes you wonder how stores still have those handfuls of copies to sell.
Here’s a year-to-year comparison chart of the Top 750:
| Year | # of placing titles | Unit sales | Calculated Retail price |
| 2003 | 74 | 336,569 | $6,151,258 |
| 2004 | 39 | 179,440 | $3,135,983 |
| 2005 | 42 | 298,484 | $5,440,001 |
| 2006 | 59 | 551,160 | $10,246,082 |
| 2007 | 58 | 487,467 | $9,953,976 |
| 2008 | 71 | 1,015,864 | $19,805,098 |
| 2009 | 93 | 1,223,733 | $24,061,834 |
| 2010 | 96 | 648,403 | $12,523,128 |
| 2011 | 107 | 660,706 | $13,083,378 |
| 2012 | 104 | 688,870 | $14,811,979 |
| 2013 | 130 | 767,686 | $15,620,981 |
| 2014 | 131 | 931,239 | $19,207,755 |
| 2015* | 119 | 1,074,304 | $21,701,088 |
| 2016* | 117 | 1,234,047 | $23,203,071 |
| 2017 | 101 | 827,544 | $15,234,525 |
| 2018 | 47 | 360,414 | $7,810,753 |
| 2019 | 33 | 413,923 | $9,691,574 |
2019 has the lowest number of DC books placing in the Top 750, since we’ve ever tracked this.
DC’s #1 book is the new $25 edition of “Watchmen” at 59k. This is certainly doing as well as it is on the strength of the HBO show (which was, surprisingly, a fine piece of television). At #3 is the “old” $20 version at 23k. You’d probably be sensible to actually add those together for 82k sold. “Watchmen” sold about 27k in 2018, so it’s a near-tripling. Also at #6 is a $40 HC of the same story (16k sold). “Watchmen” also sells 6k copies of the $50 HC, and about the same of the $30 “international edition” (since the smiley face is copyrighted still in other countries, as I understand it). Alan Moore, a writer who vowed to never work with the company ever again since 1989, is also responsible for the #5 best-seller (“V For Vendetta” – 16k), as well as #7 (“Batman: The Killing Joke” – also 16k). Imagine if he hadn’t felt they betrayed him?
DC’s #2 book is from what was formerly known as the DC Ink imprint –“Teen Titans: Raven”, which shifts 43k copies. The next best-selling “Ink” title is “Under The Moon: A Catwoman Tale” (#31) that doesn’t ever crack 5k, so it will be interesting to see what happens with the YA books over time – I would imagine had that latter been serialized they would have sold 15k-ish of each issue in addition to the book numbers. But that’s supposition on my part. The best-selling “Zoom” book (their juvenile line) is “Super Sons: The Polarshield Project”, which is their #20 best-performing book in the Book market, and only sells 8300 copies. No other Zoom or Ink book places in the Top 750.
At #4 is the Black Label imprint, the retroactively branded “Batman: White Knight”, with 17k sold. At #10 is another Black Label book: the one that originally had the Bat-Penis in it: “Batman: Damned.” It sells 14k in this censored version.
#8 is more Batman: 15k copies of “Detective Comics: 80 Years of Batman”, while #9 is the first appearance of a DC book from current continuity, “The Batman Who Laughs” (also 15k).
Very little else sells over 10k; just four books, actually: “Sandman: Preludes & Nocturnes” (13k) – which I would expect to explode later in 2020 with the announced Netflix series – “Batman: The Long Halloween” (11k), Tom King’s “Mister Miracle” (11k), and “Batman: The Dark Knight Returns” (also 11k).
Here’s DC’s Long Tail – better a bit. Still selling fewer pieces, but at least calculated dollars rose.
| Year | # of listed items | % Change | Total Pieces | % Change | Calculated Retail Value | % Change | Av. Sale per title | Av $ per title |
| 2007 | 1644 | — | 1,181,218 | — | $22,033,212 | — | 719 | $13,402 |
| 2008 | 2057 | 25.12% | 1,719,330 | 45.56% | $33,609,704 | 52.54% | 836 | $16,339 |
| 2009 | 2264 | 10.06% | 1,902,181 | 10.64% | $37,816,864 | 12.52% | 840 | $16,704 |
| 2010 | 2442 | 7.86% | 1,320,262 | -30.59% | $25,982,910 | -31.29% | 541 | $10,640 |
| 2011 | 2423 | -0.07% | 1,323,630 | 0.26% | $27,130,811 | 4.42% | 546 | $11,197 |
| 2012 | 2452 | 1.20% | 1,206,198 | -8.87% | $26,729,997 | -1.48% | 492 | $10,901 |
| 2013 | 2551 | 4.04% | 1,369,850 | 13.57% | $29,881,153 | 11.79% | 537 | $11,714 |
| 2014 | 2746 | 7.64% | 1,638,901 | 19.64% | $35,388,570 | 18.43% | 597 | $12,887 |
| 2015* | 1690 | -38.46% | 1,997,577 | 21.89% | $43,031,546 | 21.60% | 1182 | $25,462 |
| 2016* | 1214 | -28.17% | 2,262,888 | 13.82% | $47,963,215 | 11.46% | 1864 | $39,508 |
| 2017 | 3152 | 259.64% | 1,948,037 | -13.91% | $42,921,514 | -10.51% | 618 | $13,617 |
| 2018 | 3364 | 6.73% | 1,333,836 | -31.53% | $31,844,186 | -25.81% | 397 | $9,466 |
| 2019 | 3229 | -4.01% | 1,303,807 | -2.25% | $33,428,626 | 4.98% | 404 | $10,353 |
DC has just one book over 50k, two more over 20k, and 11 more that come in over 10k.
DARK HORSE
It’s a big surge forward for the Western Top 10 with Dark Horse Comics at #7. They place 33 titles into the Top 750 for 364k, and $6.2 million in calculated retail value.
This is a nice surge for Dark Horse, but it is largely on the back of the success of Netflix’s “Umbrella Academy” show – v1 is their #1 book, selling just over 50k copies, #2 is v2 (32k), while the newly released v3 is #5 with 22k. As often happens with surprise sales from TV shows, “Umbrella Academy” spent a good chunk of its immediate surge in popularity being Out-of-Stock. Had it been available, I imagine it would have sold significantly better. Maybe with Season Two!
Coming in at #3 for Dark Horse is 25k copies of their officially licensed “Minecraft” comic. While certainly a hit for Dark Horse, this does worse than “unofficial” Minecraft comics on the same chart.
#4 is the first “Stranger Things” collection from the Netflix show of the same name with 25k, while #6 is 19k copies of “Critical Role Vox Machina: Origins,” a podcast-focused comic.
#7-9 are all “Plants Versus Zombies”: v12 does 13k, v13 and v1 sell 10k each. All thirteen “PvZ” comics hit the top 750, selling a combined 99k.
And, finally, #10 is brought along with the first “Hellboy” Omnibus, which sells a tiny hair under 10k.
Here’s what Dark Horse’s Western performance looks like in the Long Tail.
| Year | # of listed items | Percent Change | Total Unit Sold | Percent Change | Calculated Retail value | Percent Change | Av. Sale per title | Av $ per title |
| 2007 | 597 | —— | 413,022 | —— | $7,607,264 | —– | 692 | $14,745 |
| 2008 | 734 | 22.95% | 552,815 | 33.85% | $9,329,828 | 22.64% | 753 | $12,711 |
| 2009 | 798 | 8.72% | 455,924 | -17.53% | $7,757,240 | -16.86% | 571 | $9,721 |
| 2010 | 955 | 19.67% | 445,248 | -2.34% | $7,852,063 | 1.22% | 466 | $8,222 |
| 2011 | 1025 | 7.33% | 389,514 | -12.52% | $7,102,710 | -9.54% | 380 | $6,929 |
| 2012 | 1133 | 10.54% | 377,322 | -3.13% | $6,907,772 | -2.74% | 333 | $6,097 |
| 2013 | 1238 | 9.27% | 383,391 | 1.61% | $7,391,831 | 7.01% | 310 | $5,971 |
| 2014 | 1420 | 14.70% | 421,708 | 9.99% | $8,982,411 | 21.52% | 297 | $6,326 |
| 2015* | 947 | -33.31% | 376,231 | -10.78% | $8,120,937 | –9.59% | 397 | $8,575 |
| 2016* | 877 | -7.39% | 461,297 | 22.61% | $9,076,526 | 11.77% | 526 | $10,350 |
| 2017 | 1598 | 82.21% | 478,658 | 3.76% | $9,256,795 | 1.99% | 300 | $5,793 |
| 2018 | 1615 | 1.06% | 485,919 | 1.52% | $9,410,362 | 1.66% | 301 | $5,827 |
| 2019 | 1612 | -0.18% | 459,996 | -5.33% | $9,617,364 | 2.20% | 285 | $5,966 |
In the Long Tail, Western Dark Horse has its best year ever. Again!
Dark Horse’s Manga offerings are up in that section. Dark Horse is one of the rare publishers that does a significant business in both Eastern and Western comics, and I’m sure they’d prefer all of their numbers to be represented together. In which case, their Long Tail actually looks like this:
| Year | # of listed items | Percent Change | Total Unit Sold | Percent Change | Calculated Retail value | Percent Change | Av. Sale per title | Av $ per title |
| 2007 | 938 | —— | 662,965 | —— | $10,936,728 | —– | 707 | $11,660 |
| 2008 | 1075 | 14.61% | 801,796 | 20.94% | $12,506,698 | 14.36% | 746 | $11,634 |
| 2009 | 1253 | 16.56% | 682,421 | -14.89% | $10,672,933 | -14.66% | 545 | $8,518 |
| 2010 | 1428 | 13.97% | 639,742 | -6.25% | $10,485,140 | -1.76% | 448 | $7,343 |
| 2011 | 1522 | 6.58% | 578,843 | -9.52% | $9,704,940 | -7.44% | 380 | $6,376 |
| 2012 | 1626 | 6.83% | 489,695 | -15.40% | $8,538,810 | -12.02% | 301 | $5,251 |
| 2013 | 1759 | 8.18% | 486,929 | -0.56% | $9,070,394 | 6.23% | 277 | $5,157 |
| 2014 | 1979 | 12.51% | 522,602 | 7.33% | $10,599,661 | 16.86% | 264 | $5,356 |
| 2015* | 1250 | -36.84% | 511,675 | -2.09% | $10,359,104 | -2.27% | 409 | $8,287 |
| 2016* | 1102 | -11.84% | 635,595 | 24.22% | $11,367,881 | 9.74% | 577 | $10,316 |
| 2017 | 2125 | 92.83% | 716,747 | 12.77% | $20,624,676 | 81.43% | 337 | $9,706 |
| 2018 | 2146 | 0.99% | 709,929 | -0.09% | $12,989,497 | -37.02% | 331 | $6,053 |
| 2019 | 2023 | -5.73% | 977,155 | 37.64% | $19,467,752 | 49.87% | 483 | $9,623 |
Dark Horse has one title over 50k on the Western charts, four more over 20k, and four more over 10k.
HACHETTE
At #8 is another of the “Big Five”: Hachette, which includes the imprints of JY, Little Brown, Running Press, and Yen in the Top 750, as well as Black Dog & Leventhal, Grand Central and Nation Books, in the Long Tail. In the Top 750 they place twelve books, selling 266k copies and $2.9m. Yen also has a lot of manga up above in the previous section. If you added them together, it would be about 383k, and $4.8m
JY is their strongest imprint, being home to Svetlana Chmakova’s “Crush” (60k), “Awkward” (39k), “Brave” (28k), and “Diary” (6200).
Little, Brown places seven books into the Top 750. The biggest hit is “Meg, Jo, Beth and Amy: A Modern Retelling of Little Women,” which brings in sales of 53k. “Catstronauts: Mission Moon” is their next best-seller at nearly 29k, and the later volumes follow behind. Their last best-seller is “Middle School Misadventures” that scores 12k.
They also sell just 2607 copies of the first 3-in-one edition of Herge’s “Tintin,” which continues perpetually to be disturbingly low for one of the classic masters of the medium, if you ask me.
None of their other imprints manage to score any titles at 10k or over.
Here’s the Long Tail of just the Western books for Hachette. It’s going to jump a bit because we now add Perseus publishers (which they purchased in 2016), Basic Books, Public Affairs, and Running Press:
| Year | # of listed items | Percent Change | Total Unit Sold | Percent Change | Calculated Retail value | Percent Change | Av. Sale per title | Av $ per title |
| 2007 | 15 | —— | 39,181 | —— | $689,383 | —— | 2,612 | $45,959 |
| 2008 | 18 | 20.00% | 37,519 | -4.24% | $596,609 | -13.46% | 2,084 | $33,145 |
| 2009 | 18 | —— | 40,172 | 7.07% | $642,935 | 7.76% | 2,232 | $35,719 |
| 2010 | 19 | 5.56% | 160,992 | 300.76% | $3,097,996 | 381.85% | 8,473 | $163,052 |
| 2011 | 24 | 26.32% | 88,131 | -45.26 | $1,273,500 | -58.89% | 3,672 | $53,063 |
| 2012 | 28 | 16.67% | 110,897 | 25.83% | $1,565,744 | 22.95% | 3,961 | $55,919 |
| 2013 | 24 | -14.29% | 39,093 | -65.75% | $584,783 | -62.65% | 1,629 | $24,366 |
| 2014 | 32 | 33.33% | 38,853 | -0.61% | $593,667 | 1.52% | 1,214 | $18,552 |
| 2015* | 30 | -0.63% | 61,539 | 58.39% | $830,047 | 39.82% | 2,051 | $27,668 |
| 2016* | 56 | 86.67% | 81,648 | 32.68% | $1,654,511 | 99.33% | 1,458 | $29,545 |
| 2017 | 78 | 39.29% | 220,591 | 170.17% | $2,998,501 | 81.23% | 2,828 | $38,442 |
| 2018 | 203 | 260.26% | 363,575 | 64.82% | $4,541,954 | 51.47% | 1,791 | $22,374 |
| 2019 | 152 | -25.12% | 356,334 | -1.99% | $4,469,594 | -1.59% | 2,344 | $29,405 |
And if you add the Manga from Yen, the combined total looks like this:
| Year | # of listed items | Percent Change | Total Unit Sold | Percent Change | Calculated Retail value | Percent Change | Av. Sale per title | Av $ per title |
| 2007 | 25 | —— | 52,077 | —— | $836,832 | —– | 2,083 | $33,473 |
| 2008 | 108 | 332.00% | 147,645 | 183.51% | $1,834,469 | 119.22% | 1,367 | $16,986 |
| 2009 | 229 | 112.04% | 371,134 | 151.37% | $4,340,048 | 132.78% | 1,621 | $18,952 |
| 2010 | 363 | 58.52% | 721,975 | 94.53% | $9,748,867 | 124.63% | 1,999 | $26,856 |
| 2011 | 484 | 33.33% | 852,256 | 18.05% | $11,227,466 | 15.17% | 1,761 | $23,197 |
| 2012 | 576 | 19.01% | 758,845 | -10.96% | $10,301,009 | -8.25% | 1,317 | $17,884 |
| 2013 | 678 | 17.71% | 731,473 | -3.61% | $10,300,204 | —– | 1,079 | $15,192 |
| 2014 | 808 | 19.17% | 720,988 | -1.43% | $10,579,169 | 2.71% | 892 | $13,093 |
| 2015* | 742 | -8.17% | 994,407 | 37.92% | $14,304,955 | 35.22% | 1,340 | $19,279 |
| 2016* | 849 | 14.42% | 1,153,656 | 16.01% | $17,174,718 | 20.06% | 1,359 | $20,229 |
| 2017 | 1481 | 74.44% | 1,199,553 | 3.98% | $16,865,176 | -1.80% | 810 | $11,388 |
| 2018 | 1940 | 30.99% | 1,253,803 | 4.52% | $17,593,705 | 4.32% | 646 | $9,069 |
| 2019 | 1998 | 2.99% | 1,240,930 | -1.03% | $17,477,769 | -0.66% | 621 | $8,748 |
Hachette has two titles over 50k, three more over 20k, and two others over 10k, on the Western charts.
IMAGE COMICS
Falling back sharply, Image Comics in now our #9 Western publisher via the NPD BookScan reporters; Image has 26 titles placing within the Top 750 in 2019, that sell 224k copies and just over $5.4m in calculated retail value. That’s a big drop from last year’s 402k, and almost $11m.
Because Image is a primarily Direct Market retailer, we’ve always built a special year-by-year chart for them in the Top 750 (Hey! I have my biases!), and this is what Image’s performance has looked like for the last 17 years:
| Year | # of placing titles | Unit sales | Calculated
Retail Value |
| 2003 | 1 | 2,328 | $30,148 |
| 2004 | 1 | 402 | $5,206 |
| 2005 | 3 | 8,699 | $100,236 |
| 2006 | 1 | 5,311 | $113,465 |
| 2007 | 4 | 28,349 | $344,026 |
| 2008 | 9 | 55,033 | $830,574 |
| 2009 | 11 | 78,874 | $1,210,094 |
| 2010 | 22 | 289,044 | $6,479,930 |
| 2011 | 27 | 367,265 | $8,670,917 |
| 2012 | 33 | 701,050 | $20,389,762 |
| 2013 | 38 | 651,390 | $19,371,269 |
| 2014 | 47 | 691,804 | $17,554,492 |
| 2015 | 71 | 878,262 | $22,587,672 |
| 2016 | 72 | 908,655 | $22,917,758 |
| 2017 | 52 | 556,196 | $11,092,960 |
| 2018 | 42 | 402,584 | $7,611,777 |
| 2019 | 26 | 223,569 | $5,446,399 |
Yeah, big drop. This is what happens when “The Walking Dead” and “Saga” both end.
Image’s best-seller on the Top 750 charts goes back to being “The Walking Dead,” with the debut of the final big thick Compendium doing almost 26k, while the final slender volumes v31 (21k) and v32 (17k) also place. None of the rest of “TWD” sell over 10k.
Brian K Vaughan and Fiona Staples’ “Saga” is the second best-selling series. V9, the final book of the first half, launches at 13k. v1 hangs in there at 12k, but that’s down dramatically from 17k in 2018, and 20k in 2019. Clearly the continuing serialization was driving a significant amount of backlist sales. BKV’s other series, “Paper Girls” comes in as the #7 best-selling Image book, but with just 8800 copies.
The only other Image title that beats the 10k mark in 2019 is “Monstress v1”, which sells 12k.
Image is super-hungry for new “hits.”
Here’s what Image’s Long Tail looks like: just like from the top, it’s a brutal cut this year. These are not happy numbers, leaving them at like half of what they were selling in 2016.
| Year | # of listed items | Percent Change | Total Unit Sold | Percent Change | Calculated Retail Value | Percent Change | Av. Sale per title | Av $ per title |
| 2007 | 438 | —— | 116,015 | —— | $2,313,477 | —– | 265 | $5,282 |
| 2008 | 515 | 17.58% | 121,001 | 4.30% | $2,445,765 | 5.72% | 235 | $4,749 |
| 2009 | 571 | 10.87% | 156,466 | 29.31% | $3,207,033 | 31.13% | 274 | $5,617 |
| 2010 | 642 | 12.43% | 359,238 | 229.59% | $8,152,806 | 254.22% | 560 | $12,699 |
| 2011 | 749 | 16.66% | 466,637 | 29.90% | $11,041,187 | 35.43% | 623 | $14,741 |
| 2012 | 868 | 15.89% | 794,419 | 70.24% | $22,797,279 | 106.47% | 915 | $26,264 |
| 2013 | 994 | 14.52% | 776,507 | -2.25% | $22,085,860 | -3.12% | 781 | $22,219 |
| 2014 | 1006 | 1.21% | 830,735 | 6.98% | $20,309,973 | -8.04% | 826 | $20,189 |
| 2015* | 842 | -16.30% | 1,070,299 | 28.84% | $26,175,438 | 28.88% | 1271 | $31,087 |
| 2016* | 876 | 4.04% | 1,187,316 | 10.93% | $28,267,847 | 7.99% | 1355 | $32,269 |
| 2017 | 1531 | 174.77% | 938,991 | -20.91% | $18,564,975 | -34.32% | 613 | $12,126 |
| 2018 | 1706 | 11.43% | 769,180 | -18.08% | $14,923,335 | -19.62% | 451 | $8,748 |
| 2019 | 1757 | 2.99% | 641,353 | -16.62% | $14,305,501 | -4.14% | 365 | $8,142 |
Image has two titles over 20K, and another four over 10k.
MARVEL COMICS
Bringing up the back as #10 Western publisher within the Top 750 in 2019 is Marvel Comics, which places just 27 titles for about 221k copies and $4.2m of calculated retail. This is Marvel’s worst performance in the Top 750 since 2012.
Here is how Marvel looks in the Top 750:
| Year | # of placing titles | Unit sales | Calculated
Retail value |
| 2003 | 73 | 455,553 | $8,428,962 |
| 2004 | 50 | 227,985 | $3,756,764 |
| 2005 | 26 | 153,317 | $2,459,027 |
| 2006 | 33 | 294,852 | $5,702,307 |
| 2007 | 37 | 376,918 | $7,599,057 |
| 2008 | 38 | 303,639 | $6,446,359 |
| 2009 | 34 | 226,541 | $5,019,216 |
| 2010 | 33 | 206,273 | $4,979,323 |
| 2011 | 27 | 128,364 | $3,303,496 |
| 2012 | 32 | 141,145 | $3,872,683 |
| 2013 | 39 | 187,598 | $4,229,242 |
| 2014 | 53 | 342,706 | $8,341,787 |
| 2015* | 63 | 478,076 | $10,611,981 |
| 2016* | 60 | 555,715 | $12,088,278 |
| 2017 | 50 | 378,689 | $7,840,198 |
| 2018 | 44 | 363,360 | $7,885,015 |
| 2019 | 27 | 220,845 | $4,151,908 |
As always, I really wonder how Marvel is doing this poorly in the bookstores when their very name is synonymous with “comics” in the minds of the general public. I think the problem is that Marvel’s backlist is kind of scattershot. Very few titles are truly perennial, and the branding and packaging is all over the map. New backlist releases are designed for maximizing revenue, rather than audience size, where price-per-page is very similar to the serialization cost. New backlist releases also have poor “hand,” feeling very thin compared to other books on the shelves. It’s hard to follow which sequence individual books come in, and they’re not exactly committed to aggressively reprinting either. I honestly think that Marvel backlist should be selling significantly better than it does – I really think just about everything about how they approach backlist sales needs to be rethought – they should be significantly above this performance, in my mind.
Marvel’s biggest success is still “The Infinity Gauntlet”, where they sell 27k copies (down from 54k in 2018, but way up from 16k in 2017).
In a strange upset for Marvel’s normal business model, #2 & #3 are the $10 smaller-format books which are kind of nominally aimed at the Children’s audience: “Spider-Verse: Spider-Men” does 19k, while “Spider-Verse: Miles Morales” does 14k.
Much to the chagrin of people who insist that only white men should be in superhero comics, Marvel’s #4 book is “Ms Marvel: No Normal”, at 11k.
Nothing else from Marvel cracks 10k in the book market, but four of their top ten are aimed at kids, including #6 “Spidey: Freshman Year” (9200), and #8 “Marvel Super Hero Adventures: Spider-Man” (8300).
#5 is v4 of “Star Wars: Darth Vader: Dark Lord of the Sith” (9600).
#7 is the $60 hardcover of “House of X / Powers of X” (8700 sold), while #9 is the first volume of “Miles Morales” from Bendis (8k). And bringing it up at #10 is the first Ta-Nehisi Coates paperback, at about 7500 copies sold… but that’s a big drop from 36k last year.
Here is Marvel’s Long Tail.
| Year | # of listed items | % Change | Total Pieces | % Change | Calculated Retail value | % Change | Av. Sale per title | Av $ per title |
| 2007 | 1230 | — | 1,034,023 | — | $19,947,737 | — | 841 | $16,218 |
| 2008 | 1559 | 26.75% | 1,032,394 | -0.01% | $20,128,825 | 0.01% | 662 | $12,911 |
| 2009 | 2067 | 32.58% | 954,335 | -7.56% | $19,608,696 | -2.58% | 462 | $9,487 |
| 2010 | 2551 | 23.42% | 870,597 | -8.77% | $19,485,662 | -0.06% | 352 | $7,638 |
| 2011 | 2852 | 11.80% | 852,187 | -2.11% | $20,225,728 | 3.80% | 299 | $7,092 |
| 2012 | 3083 | 8.10% | 726,542 | -14.74% | $18,848,013 | -6.81% | 236 | $6,114 |
| 2013 | 3203 | 3.89% | 730,826 | 0.59% | $17,820,299 | -5.45% | 228 | $5,564 |
| 2014 | 3352 | 4.65% | 918,595 | 25.69% | $24,369,961 | 36.75% | 274 | $7,270 |
| 2015* | 1882 | -43.85% | 1,114,414 | 21.32% | $28,021,290 | 14.98% | 592 | $14,889 |
| 2016* | 1841 | -2.18% | 1,277,046 | 14.59% | $31,402,330 | 12.07% | 694 | $17,057 |
| 2017 | 3578 | 94.35% | 1,142,061 | -10.57% | $28,201,535 | -10.19% | 319 | $7,882 |
| 2018 | 3662 | 2.35% | 1,180,202 | 3.34% | $29,651,745 | 5.14% | 322 | $8,097 |
| 2019 | 3692 | 0.82% | 1,064,633 | -9.79% | $26,249,715 | -11.47% | 288 | $7,110 |
Marvel has one book over 20k, and another three that are over 10k.
SIMON & SCHUSTER
That is it for the top ten publishers, but there are a few more publishers it’s worth singling out for attention because they have a historical value, they are significant for either the book or comics markets, they are growing, or there is otherwise something of note about them!
Since this is a report on bookstore sales, let’s start with the last of the mainstream book world’s “Big Five”: Simon & Schuster. They manage to place seven titles into this year’s Top 750, but missed the cutoff for Top Ten Publishers. These seven titles place 56k copies, for about $931k in calculated dollar sales.
Simon has several imprints, including Aladdin, Atria, Atheneum, Free Press, Margaret K. Elderberry, Gallery 13, Pocket, Scribner, and Touchstone. Their best-selling comic this year is from the Scribner imprint, and is the adaptation of “The Mueller Report”, that does just under 11k.
From Simon, proper, is “Fake Blood” by Whitney Gardner, at just over 10k copies. Also just over 10k is the awesome “The Okay Witch” by Emma Steinkellner from the Aladdin imprint (and which went OOS right away after shipping, so would have sold a lot better if there were copies to sell).
Here is Simon & Schuster’s Long Tail, which includes the imprints that I’m aware of.
| Year | # of listed items | % Change | Total Pieces | % Change | Calculated Retail Value | % Change | Av. Sale per title | Av $ per title |
| 2007 | 12 | — | 8,317 | — | $158,014 | — | 693 | $13,168 |
| 2008 | 26 | 116.67% | 14,917 | 79.36% | $211,798 | 34.04% | 574 | $8,146 |
| 2009 | 41 | 57.69% | 109,558 | 634.45% | $1,430,544 | 575.43% | 2,672 | $34,891 |
| 2010 | 46 | 12.20% | 214,828 | 96.09% | $2,660,094 | 85.95% | 4,670 | $57,828 |
| 2011 | 62 | 34.78% | 187,531 | -12.71% | $2,383,491 | -10.40% | 3,025 | $38,443 |
| 2012 | 63 | 1.61% | 165,831 | -11.57% | $2,844,453 | 19.34% | 2,632 | $45,150 |
| 2013 | 67 | 6.35% | 258,931 | 56.14% | $4,165,350 | 46.44% | 3,865 | $62,169 |
| 2014 | 71 | 5.97% | 383,878 | 48.25% | $6,520,821 | 26.55% | 5,407 | $91,843 |
| 2015* | 75 | 5.63% | 910,341 | 237.14% | $13,386,461 | 205.29% | 12,138 | $178,486 |
| 2016* | 75 | —— | 618,922 | -32.01% | $9,477,798 | -29.20% | 8,252 | $126,371 |
| 2017 | 89 | 18.67% | 449,243 | -27.42% | $6,788,432 | -28.38% | 5,048 | $76,275 |
| 2018 | 88 | -1.12% | 38,804 | -91.36% | $739,664 | -89.10% | 441 | $8,405 |
| 2019 | 100 | 13.64% | 80,795 | 108.21% | $1,502,286 | 103.10% | 808 | $15,023 |
[Almost all of that 2018 drop was my reconsidering hybrid-prose books like Rachel Renee Russell’s “Dork Diaries” as properly being “comics,” so that was on me, not them!]
Simon & Schuster has three books over 10k this year.
ABRAMS
While not considered one of the book world’s “Big Five,” Abrams is not also considered a traditional Direct Market publisher, either. They publish as Abrams Comicarts, Harry N. Abrams, as well as Amulet Books. They distribute, but do not publish, U.K. publisher SelfMadeHero. Abrams places a dozen books, selling 197k copies for $2.8m in calculated dollars.
Their best-selling book continues to be “El Deafo” which does terrific at 47k. Then most of the rest of their best sellers are all from “Nathan Hale’s Hazardous Tales” – 22k copies of “Lafayette!,” 20k of “Major Impossible,” 18k “Raid of No Return,” 15k “Treaties, Trenches Mud and Blood,” 13k of “One Dead Spy,” 10k each of “The Underground Abductor” and “Alamo All-Stars” Great kid-oriented series of history retellings!
The also place 18k copies of “The Best We Can Do” by Thi Bui.
Here is your Long Tail; solid performance:
| Year | # of listed items | Percent Change | Total Unit Sold | Percent Change | Calculated Retail value | Percent Change | Av. Sale per title | Av $ per title |
| 2008 | 3 | —— | 10,031 | —— | $148,675 | —— | 3,344 | $49,558 |
| 2009 | 25 | 733.33% | 24,116 | 140.41% | $640,635 | 330.90% | 965 | $25,625 |
| 2010 | 41 | 64.00% | 48,240 | 100.03% | $1,109,444 | 73.18% | 1,177 | $27,060 |
| 2011 | 49 | 19.51% | 31,846 | -33.98% | $731,054 | -34.11% | 650 | $14,919 |
| 2012 | 62 | 26.53% | 37,522 | 17.82% | $756,650 | 3.50% | 605 | $12,204 |
| 2013 | 70 | 12.90% | 72,538 | 93.32% | $3,278,063 | 333.23% | 1,036 | $46,829 |
| 2014 | 88 | 25.71% | 74,083 | 2.13% | $2,324,820 | -29.10% | 842 | $26,418 |
| 2015* | 92 | 4.55% | 145,633 | 96.58% | $1,898,267 | -18.35% | 1,583 | $20,633 |
| 2016* | 112 | 21.74% | 177,127 | 21.63% | $2,326,956 | 22.58% | 1,581 | $20,776 |
| 2017 | 124 | 10.71% | 248,580 | 40.34% | $3,449,807 | 48.25% | 2,005 | $27,821 |
| 2018 | 138 | 11.29% | 258,334 | 3.92% | $3,776,138 | 9.46% | 1,872 | $27,363 |
| 2019 | 148 | 7.25% | 265,300 | 2.70% | $4,089,631 | 8.30% | 1,791 | $27,633 |
Abrams has two books over 20k, and seven more over 10k in 2019.
While not one of the “Big Five”, there are several other publishers that I would consider both “significant” as well as book market-first who did well in the Top 750. In straight alphabetical: Bloomsbury (1 title in 2019), Candlewick (2), Houghton Mifflin Harcourt (6), and Hyperion/Disney Press (9), and Skyhorse (4).
BLOOMSBURY
The first up is Bloomsbury, which places just a single book into the Top 750: Roz Chast’s memoir “Can’t We Talk About Somehting More Pleasant,” which recedes a bit from previous years with 7400 copies sold.
I’ve already built the Long Tail, so here we are again:
| Year | # of listed items | Percent Change | Total Unit Sold | Percent Change | Calculated Retail value | Percent Change | Av. Sale per title | Av $ per title |
| 2007 | 1 | — | 2,409 | — | $28,788 | — | 2409 | $28,788 |
| 2008 | 4 | 300.00% | 8,878 | 268.53% | $142,561 | 395.21% | 2220 | $35,640 |
| 2009 | 8 | 200.00% | 30,663 | 245.38% | $643,517 | 351.40% | 3833 | $80,440 |
| 2010 | 9 | 12.50% | 26,132 | -14.78% | $524,642 | -18.47% | 2904 | $58,294 |
| 2011 | 10 | 11.11% | 17,663 | -32.41% | $343,201 | -34.58% | 1766 | $34,320 |
| 2012 | 12 | 20.00% | 10,749 | -39.14% | $207,938 | -39.41% | 896 | $17,328 |
| 2013 | 12 | — | 8,034 | -25.26% | $155,776 | -25.09% | 670 | $12,981 |
| 2014 | 15 | 25.00% | 81,758 | 917.65% | $2,211,181 | 1319.46% | 5451 | $147,412 |
| 2015* | 20 | 33.33% | 56,006 | -31.50% | $1,480,162 | -33.06% | 2800 | $74,008 |
| 2016* | 23 | 15.00% | 14,990 | -73.24% | $303,296 | -79.51% | 652 | $13,187 |
| 2017 | 21 | -8.70% | 31,709 | 111.53% | $839,044 | 176.64% | 1510 | $39,954 |
| 2018 | 26 | 12.81% | 35,256 | 11.19% | $806,512 | -3.87% | 1356 | $31,020 |
| 2019 | 25 | -3.85% | 22,664 | -35.72% | $472,672 | -41.39% | 907 | $18,907 |
Bloomsbury has no titles over 10k.
CANDLEWICK
Next is Candlewick, which places two titles, for just over 49k combined. The best selling is “Flora & Ulysses” which is mostly prose, but does have a significant enough comics section in it to be on “this side” of the line for the category. It sells 25k copies. They also move about 24k copies of “Timmy Failure: Mistakes Were Made.”
Here’s a Long Tail:
| Year | # of listed items | Percent Change | Total Unit Sold | Percent Change | Calculated Retail value | Percent Change | Av. Sale per title | Av $ per title |
| 2008 | 6 | — | 5,034 | — | $56,024 | — | 839 | $9,337 |
| 2009 | 18 | 200.00% | 9,688 | 92.45% | $103,287 | 84.36% | 538 | $5,738 |
| 2010 | 24 | 33.33% | 14,857 | 53.35% | $202,687 | 96.24% | 619 | $8,445 |
| 2011 | 29 | 20.83% | 19,158 | 28.95% | $286,615 | 41.41% | 661 | $9,883 |
| 2012 | 30 | 3.45% | 15,884 | -17.09% | $221,438 | -22.74% | 529 | $7,381 |
| 2013 | 31 | 3.33% | 18,710 | 17.79% | $282,320 | 27.49% | 604 | $9,107 |
| 2014 | 28 | -9.68% | 19,780 | 5.72% | $301,845 | 6.92% | 706 | $10,780 |
| 2015* | 48 | 71.43% | 57,018 | 188.26% | $652,681 | 116.23% | 1188 | $13,598 |
| 2016* | 39 | -18.75% | 28,318 | -50.33% | $436,806 | -33.08% | 726 | $11,200 |
| 2017 | 41 | 5.13% | 46,024 | 62.53% | $503,622 | 15.30% | 1123 | $12,283 |
| 2018 | 51 | 24.39% | 66,313 | 44.08% | $622,460 | 23.60% | 1300 | $12,205 |
| 2019 | 52 | 1.96% | 74,733 | 12.70% | $705,396 | 13.32% | 1437 | $13,565 |
Candlewick has two books over 20k.
HMH
Houghton Mifflin Harcourt publishes comics both as HMH and Mariner. They place six titles into the Top 750 that total about 163k.
The best-seller is Kayla Miller’s “Camp” at 62k, while her “Click” sells 42k copies.
Alison Bechdel’s “Fun Home” continues to sell, with 19k copies going out the door. Bechdel’s “Are You My Mother?” doesn’t place into the Top 750 for the first time since its release.
HMH also sells 18k (on the nose!) copies of Kwame Alexander’s “The Crossover,” and 17k copies of the adaptation of Lois Lowry’s “The Giver.”
The Long Tail:
| Year | # of listed items | Percent Change | Total Unit Sold | Percent Change | Calculated Retail value | Percent Change | Av. Sale per title | Av $ per title |
| 2007 | 4 | —— | 20,474 | —— | $434,495 | —— | 5119 | $108,624 |
| 2008 | 6 | 50.00% | 14,183 | -30.73% | $307,019 | -29.34% | 2363 | $51,170 |
| 2009 | 14 | 233.33% | 24,568 | 73.22% | $436,328 | 42.12% | 1755 | $31,166 |
| 2010 | 17 | 21.43% | 29,163 | 18.70% | $532,539 | 22.05% | 1715 | $31,326 |
| 2011 | 18 | 5.88% | 24,239 | -16.88% | $450,536 | -15.40% | 1347 | $25,030 |
| 2012 | 21 | 16.67% | 23,562 | -2.79% | $402,575 | -10.65% | 1122 | $1,9170 |
| 2013 | 29 | 38.10% | 44,558 | 89.11% | $687,920 | 70.88% | 1536 | $23,721 |
| 2014 | 27 | -6.90% | 32,751 | -26.50% | $552,884 | -19.63% | 1213 | $20,477 |
| 2015* | 33 | 22.22% | 78,357 | 239.25% | $1,214,786 | 219.72% | 2374 | $36,812 |
| 2016* | 38 | 15.15% | 60,359 | -22.97% | $943,188 | 22.36% | 1588 | $24,821 |
| 2017 | 27 | -28.95% | 42,963 | -28.82% | $710,481 | -24.67% | 1591 | $26,314 |
| 2018 | 60 | 222.22% | 41,596 | -3.18% | $701,891 | -1.21% | 693 | $11,698 |
| 2019 | 59 | -1.67% | 192,157 | 361.96% | $2,909,580 | 314.53% | 3257 | $49,315 |
Houghton Mifflin Harcourt has one book over 50k, one more over 20k, and an additional three over 10k.
HYPERION/DISNEY
Hyperion/Disney Press is, like Marvel, also owned by Disney. Technically, that probably means I should fold them together, but I resist, how I resist (largely because they are distributed separately). Hyperion has nine placing titles, doing 113k, combined. The best-selling title is 46k copies of “Gravity Falls: Lost Legends,” but they also shift 21k copies of the adaptation of “Percy Jackson: The Lightning Thief.”
| Year | # of listed items | Percent Change | Total Unit Sold | Percent Change | Calculated Retail value | Percent Change | Av. Sale per title | Av $ per title |
| 2007 | 10 | —– | 39,121 | —– | $336,771 | —– | 3912 | $33,677 |
| 2008 | 19 | 90.00% | 41,005 | 4.82% | $409,051 | 21.46% | 2158 | $21,529 |
| 2009 | 24 | 26.32% | 23,301 | -43.18% | $234,078 | -42.78% | 971 | $9,753 |
| 2010 | 26 | 8.33% | 30,860 | 32.44% | $314,067 | 34.17% | 1187 | $12,080 |
| 2011 | 29 | 11.54% | 46,553 | 50.85% | $392,652 | 25.02% | 1605 | $13,540 |
| 2012 | 31 | 6.90% | 33,105 | -28.89% | $376,735 | -4.05% | 1068 | $12,153 |
| 2013 | 33 | 6.45% | 102,537 | 209.73% | $1,298,672 | 244.72% | 3107 | $39,354 |
| 2014 | 38 | 15.15% | 77,045 | -24.86% | $1,015,188 | -21.83% | 2028 | $26,715 |
| 2015* | 57 | 50.00% | 63,290 | -17.85% | $831,477 | -18.10% | 1110 | $14,587 |
| 2016* | 36 | -36.84% | 61,730 | -2.46% | $926,504 | 11.43% | 1715 | $25,736 |
| 2017 | 41 | 13.89% | 99,589 | 61.33% | $1,592,970 | 71.93% | 2429 | $38,853 |
| 2018 | 54 | 31.71% | 132,623 | 33.17% | $2,228,412 | 39.89% | 2456 | $41,267 |
| 2019 | 63 | 16.67% | 158,896 | 19.81% | $2,473,413 | 10.99% | 2522 | $39,261 |
Hyperion has two books over 20k.
SKYHORSE
Skyhorse (placing four books for right about 21k total) is here on the strength of screencap fumetti comics taken from “Minecraft” published in their Sky Pony imprint. All of these comics are “unofficial,” however, as they’re not licensing the Minecraft brand or engine to do so. However no individual book manages even selling 6k, so I won’t run them down one-by-one.
Here’s their Long Tail, such as it is:
| Year | # of listed items | Percent Change | Total Unit Sold | Percent Change | Calculated Retail value | Percent Change | Av. Sale per title | Av $ per title |
| 2012 | 2 | — | 180 | — | $2,331 | — | 90 | $1,166 |
| 2013 | 4 | 100.00% | 1,227 | 681.67% | $15,897 | 681.98% | 307 | $3,974 |
| 2014 | 4 | — | 458 | -62.67% | $6,191 | -61.06 | 115 | $1,548 |
| 2015* | 5 | 25.00% | 14,011 | 3059.17% | $168,332 | 2718.98% | 2,802 | $33,666 |
| 2016* | 6 | 20.00% | 51,833 | 369.95% | $622,000 | 369.51% | 8,639 | $103,667 |
| 2017 | 26 | 433.33% | 81,366 | 56.98% | $1,144,071 | 83.93% | 3,129 | $44,003 |
| 2018 | 35 | 34.62% | 87,021 | 6.95% | $1,326,292 | 15.93% | 2,486 | $37,894 |
| 2019 | 40 | 14.30% | 57,866 | -33.50% | $843,109 | -36.43% | 1,447 | $21,078 |
Skyhorse has no books over 10k.
Outside of those bookstore-native publishers, we’ve got several Direct Market-native publishers who placed more than three titles into the Top 750. We’ll rank them by number of titles placed, and those would be: IDW (7), Oni (5), Dynamite (3), Boom (2), Drawn & Quarterly (2),Archie (1), Fantagraphics (1), and Nobrow (1).
IDW PUBLISHING
IDW Publishing places seven books for a total of 134k sold. George Takei’s “They Called Us Enemy,” about his experiences in the Japanese internment camps in the 1940s, is absolutely their biggest hit, bringing in 54k sold in its first frame. Representative John Lewis’s “March” trilogy, his memoir about the civil rights struggle of the 1960s, comes in next, with v1 doing 28k; v2 and v3 only sell about 9k each. I will never ever understand why, for a historical-driven series like this there’s such a wide spread between v1 and v3.
Finally, there’s a bit of a surprise hit in “Rick & Morty Vs. Dungeons & Dragons,” which sells nearly 21k copies.
Here is IDW’s Long Tail:
| Year | # of listed items | Percent Change | Total Unit Sold | Percent Change | Calculated Retail value | Percent Change | Av. Sale per title | Av $ per title |
| 2007 | 233 | —— | 102,118 | —— | $2,090,647 | —– | 438 | $8,973 |
| 2008 | 335 | 43.78% | 146,125 | 43.09% | $2,766,505 | 32.33% | 436 | $8,258 |
| 2009 | 477 | 42.39% | 215,907 | 47.76% | $4,346,836 | 57.12% | 453 | $9,113 |
| 2010 | 623 | 30.61% | 161,578 | -25.16% | $3,653,680 | -15.95% | 259 | $5,865 |
| 2011 | 785 | 26.00% | 206,136 | 27.58% | $4,884,606 | 33.69% | 263 | $6,222 |
| 2012 | 937 | 19.36% | 162,599 | -21.12% | $4,329,973 | -11.35% | 174 | $4,621 |
| 2013 | 1059 | 13.02% | 180,694 | 11.13% | $4,443,372 | 2.62% | 171 | $4,196 |
| 2014 | 1134 | 7.08% | 228,895 | 26.68% | $5,309,992 | 19.50% | 200 | $4,641 |
| 2015* | 959 | -15.43% | 310,512 | 35.66% | $6,478,023 | 22.00% | 324 | $6,755 |
| 2016* | 978 | 1.98% | 343,197 | 10.53% | $8,194,098 | 26.49% | 351 | $8,378 |
| 2017 | 1639 | 67.59% | 346,368 | 0.92% | $8,278,617 | 1.03% | 211 | $5,051 |
| 2018 | 1811 | 10.05% | 279,435 | -19.32% | $6,525,696 | -21.17% | 154 | $3,603 |
| 2019 | 1817 | 0.33% | 330,051 | 18.11% | $7,443,310 | 14.06% | 182 | $4,096 |
IDW has one book over 50k, and two more over 20k.
ONI PRESS
Oni Press is our next publisher, with four placing books for about 36k total. Their biggest success in 2019 is Brenna Thummler’s magnificent “Sheets,” which brings in nearly 15k copies. They also sell 9400 copies of “A Quick & Easy Guide to They/Them Pronouns.”
Here’s Oni’s Long Tail:
| Year | # of listed items | Percent Change | Total Unit Sold | Percent Change | Calculated Retail value | Percent Change | Av. Sale per title | Av $ per title |
| 2007 | 125 | —— | 11,294 | —— | $141,829 | —– | 90 | $1,135 |
| 2008 | 138 | 10.40% | 21,843 | 93.40% | $320,799 | 126.19% | 158 | $2,325 |
| 2009 | 149 | 7.97% | 51,584 | 136.13% | $713,121 | 122.30% | 346 | $4,786 |
| 2010 | 156 | 4.70% | 446,791 | 866.14% | $5,882,247 | 824.86% | 2864 | $37,707 |
| 2011 | 177 | 13.46% | 162,275 | -63.68% | $2,786,438 | -52.63% | 917 | $15,743 |
| 2012 | 171 | -3.39% | 80,560 | -50.36% | $1,594,016 | -42.79% | 471 | $9,322 |
| 2013 | 195 | 14.04% | 68,140 | -15.42% | $1,401,748 | -12.06% | 349 | $7,188 |
| 2014 | 213 | 9.23% | 61,584 | -9.62% | $1,303,069 | -7.04% | 289 | $6,118 |
| 2015* | 165 | -22.54% | 65,254 | 5.96% | $1,478,997 | 11.35% | 395 | $8,964 |
| 2016* | 191 | 15.76% | 90,222 | 38.26% | $1,992,643 | 34.73% | 472 | $10,433 |
| 2017 | 283 | 48.17% | 117,950 | 30.73% | $2,847,629 | 42.91% | 417 | $10,062 |
| 2018 | 323 | 14.13% | 108,897 | -7.68% | $2,595,362 | -8.86% | 337 | $8,035 |
| 2019 | 378 | 17.03% | 129,934 | 19.32% | $2,786,185 | 7.35% | 344 | $7,371 |
Oni has one book over 10k.
DYNAMITE
For the first time since I’ve been doing these charts, Dynamite finally places enough to make it into the Top 750 survey. They place three books for a bit over 25k copies.
The biggest success is “The Boys Omnibus v1,” which beats 13k copies. V2 comes in at almost exactly half at 6500.
Looks like I have to build a Long Tail for the first time, so let me set the WAYBACK machine….
| Year | # of listed items | Percent Change | Total Unit Sold | Percent Change | Calculated Retail value | Percent Change | Av. Sale per title | Av $ per title |
| 2007 | 21 | —– | 1,082 | —– | $17,861 | —– | 52 | $851 |
| 2008 | 71 | 238.10% | 7,300 | 574.68% | $138,083 | 673.10% | 103 | $1,945 |
| 2009 | 124 | 74.65% | 23,748 | 225.32% | $485,272 | 251.44% | 192 | $3,913 |
| 2010 | 177 | 42.74% | 31,194 | 31.35% | $660,904 | 36.19% | 176 | $3,734 |
| 2011 | 246 | 38.98% | 57,801 | 85.30% | $1,300,079 | 96.71% | 235 | $5,285 |
| 2012 | 288 | 17.07% | 38,798 | -32.88% | $887,083 | -31.77% | 135 | $3,080 |
| 2013 | 347 | 20.49% | 32,296 | -16.76% | $799,021 | -9.93% | 93 | $2,303 |
| 2014 | 405 | 16.71% | 31,528 | -2.38% | $788,130 | -1.36% | 78 | $1,946 |
| 2015* | 192 | -52.59% | 31,452 | -0.24% | $797,977 | 1.25% | 164 | $4,156 |
| 2016* | 174 | -9.38 | 42,280 | 34.43% | $997,956 | 25.06% | 243 | $5,735 |
| 2017 | 552 | 217.24% | 38,053 | -10.00% | $868,682 | -12.95% | 69 | $1,574 |
| 2018 | 630 | 14.13% | 50,538 | 32.81% | $1,227,967 | 41.36% | 80 | $1,949 |
| 2019 | 654 | 3.81% | 81,198 | 60.67% | $2,112,720 | 72.05% | 124 | $3,230 |
Dynamite has one book over 10k for 2019, in the NPD BookScan Top 750.
BOOM! STUDIOS
Boom! sells two titles into the Top 750, for almost 14k. Boom! uses the imprints Archaia, Boom, Boom Box, Boom Town, and Kaboom. The top-seller for Boom! in 2019 is v1 of “Lumberjanes” at 8500 copies.
The Long Tail:
| Year | # of listed items | Percent Change | Total Unit Sold | Percent Change | Calculated Retail value | Percent Change | Av. Sale per title | Av $ per title |
| 2007 | 21 | —– | 10,462 | —– | $246,984 | —— | 498 | $11,761 |
| 2008 | 44 | 109.52% | 10,943 | 4.60% | $394,361 | 59.67% | 249 | $8,963 |
| 2009 | 93 | 111.36% | 25,378 | 131.91% | $485,485 | 23.11% | 273 | $5,220 |
| 2010 | 202 | 117.20% | 64,770 | 155.22% | $1,140,019 | 134.82% | 321 | $5,644 |
| 2011 | 253 | 25.25% | 75,472 | 16.52% | $1,435,514 | 25.92% | 298 | $5,674 |
| 2012 | 307 | 21.34% | 59,758 | -20.82% | $1,160,894 | -19.13% | 195 | $3,781 |
| 2013 | 347 | 13.03% | 86,637 | 44.98% | $1,650,374 | 42.16% | 250 | $4,756 |
| 2014 | 388 | 11.82% | 108,504 | 25.24% | $1,894,658 | 14.80% | 280 | $4,883 |
| 2015* | 295 | -23.97% | 126,029 | 16.15% | $2,159,071 | 13.96% | 427 | $7,319 |
| 2016* | 309 | 4.75% | 134,386 | 6.63% | $2,313,502 | 7.15% | 435 | $7,488 |
| 2017 | 633 | 104.85% | 171,133 | 27.34% | $2,983,775 | 28.97% | 270 | $4,714 |
| 2018 | 768 | 21.33% | 198,773 | 16.15% | $3,659,046 | 22.63% | 259 | $4,764 |
| 2019 | 825 | 7.42% | 228,120 | 14.76% | $4,344,256 | 18.74% | 277 | $5,266 |
Boom! has no books over 10k.
D&Q
Drawn & Quarterly places two books into the Top 750, for about 20k copies. Their best-seller is 12k of “Making Comics” by Lynda Barry.
A Long Tail!
| Year | # of listed items | Percent Change | Total Unit Sold | Percent Change | Calculated Retail value | Percent Change | Av. Sale per title | Av $ per title |
| 2007 | 62 | — | 24,689 | — | $500,764 | — | 398 | $8,077 |
| 2008 | 82 | 32.26% | 42,038 | 70.27% | $912,774 | 82.28% | 513 | $11,131 |
| 2009 | 107 | 30.49% | 42,957 | 2.19% | $920,014 | 0.79% | 401 | $8,598 |
| 2010 | 126 | 17.76% | 44,737 | 4.14% | $1,009,387 | 9.71% | 355 | $8,011 |
| 2011 | 145 | 15.08% | 62,286 | 39.23% | $1,399,793 | 38.68% | 430 | $9,654 |
| 2012 | 155 | 6.90% | 43,098 | -30.81% | $926,233 | -33.83% | 278 | $5,976 |
| 2013 | 189 | 21.94% | 41,887 | -2.81% | $893,905 | 3.49% | 222 | $4,730 |
| 2014 | 205 | 8.47% | 46,030 | 9.90% | $1,032,032 | 15.45% | 225 | $5,034 |
| 2015* | 219 | 6.83% | 73,471 | 59.62% | $1,680,878 | 62.87% | 335 | $7,675 |
| 2016* | 233 | 6.39% | 57,326 | -21.97% | $1,266,170 | -24.67% | 246 | $5,434 |
| 2017 | 247 | 6.01% | 68,087 | 18.77% | $1,548,813 | 22.32% | 276 | $6,271 |
| 2018 | 285 | 15.38% | 79,765 | 17.15% | $2,055,019 | 32.68% | 280 | $7,211 |
| 2019 | 303 | 6.32% | 80,084 | 4.32% | $2,112,455 | 2.79% | 264 | $6,972 |
Drawn & Quarterly has one book over 10k.
ARCHIE COMICS
Archie Comics places just one book in the Top 750, selling a bit under 5k copies of “The Chilling Adventures of Sabrina.”
Here’s Archie’s Long Tail:
| Year | # of listed items | Percent Change | Total Unit Sold | Percent Change | Calculated Retail value | Percent Change | Av. Sale per title | Av $ per title |
| 2007 | 18 | —— | 12,443 | —— | $103,998 | —– | 691 | $5,778 |
| 2008 | 26 | 44.44% | 25,046 | 101.29% | $220,207 | 111.74% | 963 | $8,470 |
| 2009 | 33 | 26.92% | 26,998 | 7.79% | $246,557 | 11.97% | 818 | $7,471 |
| 2010 | 43 | 30.30% | 24,828 | -8.04% | $227,014 | -7.93% | 577 | $5,279 |
| 2011 | 62 | 44.19% | 51,551 | 107.63% | $528,353 | 132.74% | 831 | $8,522 |
| 2012 | 85 | 37.10% | 66,988 | 29.95% | $797,165 | 50.88% | 788 | $9,378 |
| 2013 | 110 | 29.41% | 79,978 | 19.39% | $974,889 | 22.29% | 727 | $8,863 |
| 2014 | 148 | 34.55% | 92,953 | 16.22% | $1,170,486 | 20.06% | 628 | $7,909 |
| 2015* | 165 | 11.49% | 75,222 | -19.08% | $892,756 | -23.73% | 456 | $5,411 |
| 2016* | 163 | -1.21% | 56,241 | -25.23% | $730,252 | -18.20% | 345 | $4,480 |
| 2017 | 156 | -4.29% | 72,574 | 29.04% | $1,102,457 | 50.97% | 465 | $7,067 |
| 2018 | 199 | 27.56% | 72,014 | -0.08% | $1,105,711 | 0.03% | 362 | $5,556 |
| 2019 | 181 | -9.04% | 56,880 | -21.02% | $866,333 | -21.65% | 314 | $4,786 |
Archie has no books over 10k.
FANTAGRAPHICS
Fantagraphics has one book in Top 750: about 5800 copies of “My Favorite Thing is Monsters” by Emil Ferris.
Here’s Fantagraphics’ Long Tail:
| Year | # of listed items | Percent Change | Total Unit Sold | Percent Change | Calculated Retail value | Percent Change | Av. Sale per title | Av $ per title |
| 2007 | 201 | — | 35,903 | — | $640,565 | — | 179 | $3,187 |
| 2008 | 239 | 18.91% | 43,675 | 21.65% | $1,126,587 | 75.87% | 183 | $4,714 |
| 2009 | 263 | 10.04% | 46,562 | 6.61% | $1,149,082 | 2.00% | 177 | $4,369 |
| 2010 | 304 | 15.59% | 50,332 | 8.10% | $1,156,205 | 0.62% | 166 | $3,803 |
| 2011 | 339 | 11.51% | 57,278 | 13.80% | $1,327,308 | 14.80% | 169 | $3,915 |
| 2012 | 387 | 14.16% | 47,476 | -17.11% | $1,094,131 | -17.57% | 123 | $2,827 |
| 2013 | 422 | 9.04% | 52,278 | 10.11% | $1,266,936 | 15.79% | 124 | $3,002 |
| 2014 | 440 | 4.27% | 53,215 | 1.79% | $1,685,171 | 33.01% | 121 | $3,830 |
| 2015* | 394 | -10.45% | 58,938 | 10.75% | $1,835,796 | 8.94% | 150 | $4,659 |
| 2016* | 421 | 6.85% | 67,241 | 14.09% | $1,975,421 | 7.61% | 160 | $4,692 |
| 2017 | 509 | 20.90% | 81,076 | 20.58% | $2,599,552 | 31.59% | 159 | $5,107 |
| 2018 | 617 | 21.22% | 95,600 | 17.91% | $2,843,762 | 9.39% | 155 | $4,609 |
| 2019 | 673 | 9.08% | 86,569 | -9.45% | $2,707,583 | -4.79% | 129 | $4,023 |
Fantagraphics has no books over 10k in 2019.
NOBROW
Finally Nobrow (which only started in 2011, can you believe?) has just one placing book in the Top 750: “Hilda and the Troll” selling just over 7k.
Here’s the Nobrow Long Tail:
| Year | # of listed items | Percent Change | Total Unit Sold | Percent Change | Calculated Retail value | Percent Change | Av. Sale per title | Av $ per title |
| 2011 | 6 | — | 31 | — | $485 | — | 5 | $81 |
| 2012 | 28 | 366.67% | 3,062 | 9777.42% | $60,537 | 12381.86% | 109 | $2,162 |
| 2013 | 36 | 12.57% | 4,536 | 48.14% | $93,703 | 54.78% | 126 | $2,603 |
| 2014 | 45 | 25.00% | 9,612 | 111.90% | $222,681 | 137.65% | 214 | $4,948 |
| 2015* | 47 | 4.44% | 13,095 | 36.24% | $269,445 | 21.00% | 279 | $5,733 |
| 2016* | 51 | 8.51% | 14,867 | 13.53% | $255,229 | -5.28% | 292 | $5,004 |
| 2017 | 69 | 35.29% | 21,997 | 47.96% | $380,323 | 49.01% | 319 | $5,512 |
| 2018 | 76 | 10.14% | 43,249 | 96.61% | $617,854 | 62.25% | 569 | $8,130 |
| 2019 | 91 | 19.74% | 44,225 | 2.26% | $669,218 | 8.31% | 486 | $7,354 |
Nobrow has no books over 10k.
…AND THE REST
After this, I am left with fourteen remaining books in the Top 750 that aren’t at one of the above publishers in 2019.
Only three of the remaining placing books sell over 10k copies. First is “The Fantastic Flatulent Fart Brothers Big Book of Farty Facts” which sells, gosh, 28k copies. It is published by Top Floor Books. Next is “The Loud House 3-in-1 v1” from Papercutz, which sells a hair over 15k. While the third and final title is the “Bone: One Edition” published by Cartoon Books in its original black-and-white, which sells 11k copies – this is very close to what the Color edition from Scholastic sells, by the way (12k).
After that, none of the remaining books sell 10k, so they don’t get individual write-ups (I’m tired! This is nearly 20k words already!).
A few final bits of number-crunching for fun before we go for the year!
First and foremost: I’m sure you noticed that one of the columns on the NPD BookScan chart is listed as “publishers”. I’ve never been able to understand why: that column is clearly the distributor column, with the (very very) weird exception of DC Comics. DC (and Dark Horse, and IDW, and others) are distributed by Random House in the bookstore market, not Diamond. Marvel is distributed by Hachette. Boom! is distributed by Simon, and so on. Now in most analysis that I do, I get fairly rigorous about going in and fixing problems, but this is a simple search. So who are the leaders for distribution, over the breadth of the entire NPD BookScan list?
Turns out it looks like this in 2019:
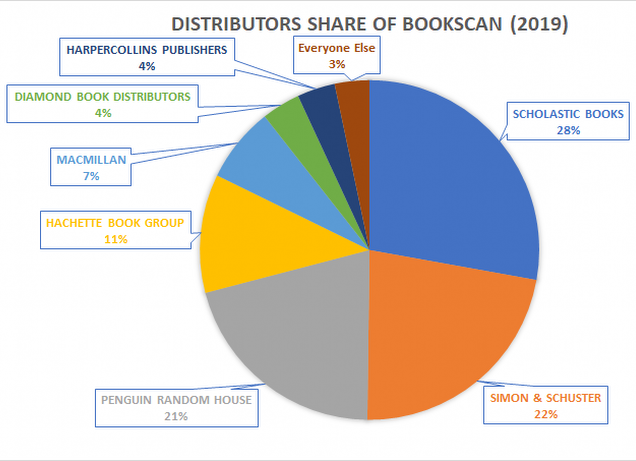
Not what you pictured in your head, was it? This chart is one of the reasons why it is hard to call Diamond a true “monopoly”, despite their presumptive domination in the Direct Market – they are just 4% of sales in the book market.
Lastly: if we look at the entirety of the 41k-long “Long Tail” NPD BookScan list, how do the publishers (all 1540 of them) stack up in 2019? This is everything, including both “East” and “West” comics, and we’ll sort it by Calculated Retail Value, and rounding everything to the nearest 100,000 just for ease of presentation. This is a list of any publisher on a quick sort that generated $1m or more in Calculated Dollar Sales.
Scholastic is strongly the biggest publisher in the bookstores, followed by Viz, then distantly followed by DC and Marvel – more importantly, the gap between the top two and the next two is getting significantly wider. However, those top four publishers together are larger than the bottom 1536 publishers combined.
| #1 | SCHOLASTIC BOOKS | $88.9 |
| #2 | VIZ MEDIA | $60.8 |
| #3 | DC COMICS | $33.4 |
| #4 | MARVEL COMICS | $26.2 |
| #5 | DARK HORSE | $19.5 |
| #6 | HACHETTE BOOK GROUP | $17.5 |
| #7 | KODANSHA COMICS | $15.8 |
| #8 | MACMILLAN | $15.8 |
| #9 | PENGUIN RANDOM HOUSE | $15.7 |
| #10 | IMAGE COMICS | $14.3 |
| #11 | HARPERCOLLINS PUBLISHERS | $13.9 |
| #12 | ANDREWS MCMEEL PUBLISHING | $11.1 |
| #13 | SEVEN SEAS | $9.5 |
| #14 | IDW PUBLISHING | $7.4 |
| #15 | BOOM! STUDIOS | $4.3 |
| #16 | HARRY N. ABRAMS | $4.1 |
| #17 | HOUGHTON MIFFLIN HARCOURT | $2.9 |
| #18 | VERTICAL COMICS | $2.8 |
| #19 | ONI PRESS | $2.8 |
| #20 | FANTAGRAPHICS BOOKS | $2.7 |
| #21 | DISNEY – HYPERION | $2.5 |
| #22 | DRAWN & QUARTERLY | $2.1 |
| #23 | DYNAMITE ENTERTAINMENT | $2.1 |
| #24 | SIMON & SCHUSTER | $1.5 |
| #25 | TITAN COMICS | $1.2 |
| — | Everyone Else Combined | $20.2 |
Or, if you’d prefer a visual chart?
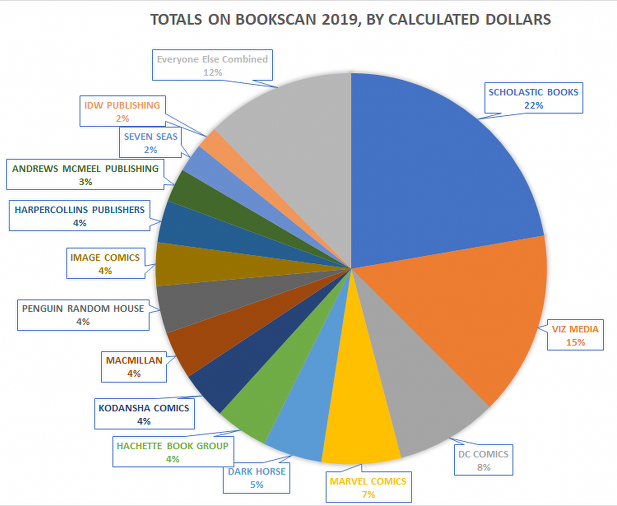
And that’s pretty much what NPD BookScan in 2019 looks like to these eyes.
How does it look to you?
METHODOLOGY AND BACKGROUND INFORMATION:
For some historical context, we have three “eras” of data: 2003-2005 numbers are “what is YTD sold, IF it made the chart in the last week of the year?”
2006-2016: the full “here’s everything that sold throughout the entire year”, but filtered through a leaker – almost certainly accurate, but absolutely missing some bits due to methodology changes and differences, even year-by-year. Important: in 2015 and 2016 I received lists that appeared to be lightly edited, potentially down to “books that are in print at the publisher level only” (obviously, there’s still stock out there on the shelves of stores and in warehouses that is not “in print” per se). Those two years are asterisked to reflect that!
2017-now: “Everything” sold in the calendar year, with no filter. (Though see further notes below!)
Just bear this all in mind if you compare the various “eras” against one another. These are not inherently apples-to-apples comparisons as a result! Moving forward, there should be a much deeper consistency of data.
The biggest and most obvious difference when doing straight comparisons will be in the lower ends of the chart. This year, the “worst selling” book in the Top 750 is just about 4700 copies (up significantly from about 3800 copies last year) In ’03-‘05 there would be many items that didn’t have YTD sales in anything like that amount.
Also of major note is that starting in 2007, I have had the “full and entire” NPD BookScan listing, down to books that have only one copy sold YTD. However, I’ve never tried to really analyze that entire list because that’s too much data, even for a data-junkie like myself. I’ve cut the list off at 750 items because that’s what we’ve historically reported. Still, I have the deeper data, and I’ll summarize it as we go along. As long as I continue to get that much data going forward, I should be able to tell you a few things about “The Long Tail.” In 2018, I possess data on 40,755 items! (for 2018 this was 38,422 items) We’ll talk more about this later in some depth, including the methodology of how these are generated.
This is important, however: this is not a list of every book that sold through every bookstore – the report is limited to those stores that report to NPD BookScan. According to NPD BookScan, more than 16,000 retail locations report to them, but this still leaves many venues that don’t.
Nielsen claimed in 2013 that approximately 85% of retail, physical book sales are tracked through them, though this number appears very much in doubt as an actionable percentage for any specific individual book. A quick internet search can find any number of cases of authors saying that NPD BookScan numbers show half or less of their royalty statements. There’s some really excellent discussion on why and by how much NPD BookScan numbers might be off right here.
NPD BookScan says “Barnes & Noble, Amazon, Costco, General Independents, Hastings, Target, BJ’s, K-Mart, Hudson Group, Meijers, Follett Books, Books-A-Million, CEO Read, Powell’s, Toys R Us, Shoprite, SuperValu, Sam’s Club and Walmart are among our many data providers.”
What sales does NPD BookScan not track? Among others, this would include libraries, schools, specialty stores (like comic book stores!) and book clubs and fairs.
There’s also a certain amount of miscategorization going on. As an example, for the last 16 years the purely-prose novel Bloody Crown of Conan appears on my list, while other books (see; Dork Diaries in a few paragraphs) might appear one year, and disappear another. I do not know what the actual extent of miscategorization might be and how it would impact any of the general data analysis! There are simply too many potential data points to possibly connect them all together in the time I have to assemble this column. It is important to point out that miscategorizations are not the fault of NPD BookScan—the publishers themselves assign the BISACs that drive these categorizations, and then Ingram and Barnes & Noble sometimes alter them before they reach the NPD BookScan universe.
I’ve done the best I can to try and root out any items “of significance” that should be on the chart that I’m given, but are not – for example, I have to have The Complete Persepolis and Maus manually pulled for me every year because of how BISAC codes work. Because this relies on me catching these titles to get them on to the list, this means there are almost certainly comics material missing that I didn’t catch. If you can think of a book I might have missed, please email me, and I’ll try to track down the sales for it, and update my listings for the future! Even with my multiple safeguards, the datastream is too wide for me to not make mistakes. I make constant mistakes, as you’ll see further down in the body of the column.
Either way, what I’m trying to get across to you is that this really is entirely unreliable data in terms of the absolute and total number of books sold, and is only able to give the broadest possible outline of what’s happening in bookstores, based upon the data set that I’m being given, which is in no way comprehensive. I still think that’s much, much better than having no information, so I persevere in writing this each year. Also, now that I am getting data directly from the NPD Group, I feel much more confident that I at least know where the potential problems generally are.
Again, I want to stress that I’m doing my primary analysis on the Top 750 items: the reason for this is that is all that I was able to get in the first four years of this analysis, and otherwise the percentage changes I’m discussing will be even more wrong than they would be otherwise. The Top 750 represents more than half of the total of the full list, and has consistently for years – in 2019 the Top 750 was roughly 15.5 million books sold; the bottom forty thousand-ish represents just about 9.2 million books sold. While there are significant sales below the Top 750, the Top 750 probably represents the majority of items you’d be able to “easily” find on the shelf of a bookstore in America. I’d love to analyze the full “Long Tail” list, but I’m afraid that this might take these little essays to triple their current size, and keeping your attention just through this seems hard enough to me! Maybe if someone paid me by the word…!
Finally, it is probably worth mentioning that although I’m analyzing primarily units sold, I also have some calculations that are purely my own of dollars that they would have been if they were sold at full retail. NPD BookScan does not report on the price that a book actually sold for, so the extrapolation of dollars that I made could be dramatically overstated. More than “could be”: it probably is… because Amazon sells so many books, often at crazy steep discounts. In no way should you take any “Calculated Retail Value” as TRUE – these are just to provide a series of benchmarks, and to help you see the impact and differences that “cover price” can make in sales.
If it was not obvious, this only counts physical books, and does not include any digital sale of any kind; it does however, include physical books sold through Amazon.
One of the things I really never talk about is how I get this data each year. I certainly don’t have a NPD BookScan account (they’re pretty expensive!), so I have historically depended on leaks from industry sources. But this means that the methodology with which the data was generated may actually be very different from year to year. The thing is, since I don’t generate these, NPD BookScan methodology is still largely a black box to me. For a guy who writes these reports for 17 (!) years, I still have only really a passing knowledge of how things work. I am learning, slowly, though!
Now that the NPD Group is directly providing us data, we can assume that the methodology itself will not change going forward, yay!
A Bunch of Information about BISAC codes and how this report is generated!
Here’s where we learn a little bit about the Book Industry Standards and Communications (or “BISAC”) codes. As mentioned above, the publishers assign them themselves, and publishers are allowed to assign up to four different BISAC codes per item. For example: “Diary of a Wimpy Kid” is classified as “Juvenile Fiction: Humorous Stories”; “Juvenile Fiction: Comics & Graphic Novels: General”; and “Juvenile Fiction: Social Issues: General”. But the kicker is that NPD BookScan reports will only spit out for the first BISAC listed for any given book. That is why “Diary of a Wimpy Kid” never ever showed on any of our previous reports, because the “comics” designation of the BISAC is listed second for that series! Conceptually I could also ask for “Juvenile Fiction: Humorous Stories” report, too – but that’s going to have thousands and thousands of prose-only, not-even-slightly-comics items on it, and working to cut those would quintuple the hours I spend on this (no thanks!) This is also why I have to manually ask for titles like “Maus” or “Persepolis” or “Understanding Comics” each and every year – not because they don’t contain the BISAC for comics (“CGN00xxxx” are the primary ones, for the record), but because that BISAC isn’t listed first!
Now, historically, this has really been opaque to me, to the point where I didn’t even really know what BISAC was what, but The NPD Group has been incredibly forthcoming, and I’m learning enough that I almost understand it. First and foremost, we’re now having the report generated using the codes for “Comics & Graphic Novels” (CGN), as well as the “comics” portions of “Juvenile” fiction (JUV) and nonfiction (JNF), and Young Adult Fiction (YAF) and non-fiction (YAN). Please note that the J and Y series of codes extend far past “comics,” but our search is for the narrower section. In addition to that, the NPD Group pulled records for three prominent authors that seldom showed up without intervention: Art Spiegelman, Marjane Satrapi, and Scott McCloud (as well as a small handful of books that I crosschecked against my own best sellers).
So you know, there are more than 75 “main” BISACs that we’re pulling in full.
Again, the publishers are the ones who assign the BISACs, and they can assign up to four per book. But reports can only generate (for now) from what the first BISAC code is listed – The NPD Group tells me they’re working on fixing that, but it’s a limitation of the current tools. That’s why they pulled by Author for Art Spiegelman – and look at how MAUS breaks down: the first individual volume has a primary BISAC of HIS022000 (“History: Jewish”), while the complete hardcover is BIO006000 (“Biography: Historical”). But the box set of the two paperbacks is BIO000000 (“Biography: General”), and METAMAUS (the book, with supporting documentation) for some reason is categorized as LIT017000 (“Literary: Comics & Graphic Novels”) which I’m not at all certain how that is different from CGN006000 (“Comics & Graphic Novels: Literary”) – but my point is that you have essentially one book that the publisher itself doesn’t really know what the “primary” BISAC should be.
There’s also more than a few dumb-ass choices, like how JUV008010 (Juvenile Fiction: Comics & GNs/Manga) features a not-even-slightly “manga” HILO by Judd Winick. These kinds of categorization problems pepper the entire database.
Additionally, only (apparently) the publishers can change BISACs, so even if I find errors year after year (god damn that BLOODY CROWN OF CONAN!!!), it’s very, very difficult to convince folks that it matters enough to devote man-hours to fixing up, even if the folks at The NPD Group agree.
If you want to learn more about the theory and practice of BISAC codes, you can go and follow this link. (It’s a trap!)
The main thing to know is that while BISAC is a pretty good system for categorizing books because it is solely in the publisher’s hands, it has some pretty extreme limitations when creating reports with it as the sole basis. There is not, however, any other way to generate this data without using those limitations, to the best of my knowledge.
Either way, prior to 2017 numbers, the exact methodology from my leakers was slightly different every year and sometimes we got weird spikes and discrepancies. For example, as far as I can tell, in 2014 and prior we were always getting every book that sold one copy anywhere, then in 2015, and slightly in 2016, we’re getting a lightly edited list that only listed in-print books from some (but not all!) publishers. I put an asterisk on 2015 and 2016 because it was missing several thousand data points… But those very strongly appeared to be data points that may not materially affect the actual bottom-line health of dollars and pieces the charts (you’ll see this year, I think). Either way, I really must once again urge you to treat every data point presented here as only part of the possible picture!
Brian Hibbs has owned and operated Comix Experience in San Francisco since 1989, was a founding member of the Board of Directors of ComicsPRO, has sat on the Board of the Comic Book Legal Defense Fund, and has been an Eisner Award judge. Feel free to e-mail him with any comments. You can purchase two collections of the first Tilting at Windmills (originally serialized in Comics Retailer magazine) published by IDW Publishing, as well as find an archive of pre-CBR installments right here. Brian is also available to consult for your publishing or retailing program.


A fun drinking game is to take a drink at every type, or odd sentence structure… you’ll pass out before you reach the end!
Thanks, Brian. Filling in the holes…Fire Force, Catwas, Max and the Midnights, Cosmic Commandos, etc. ? But less every year!
Fantastic stuff as always Brian. Thanks for doing this.
Thanks for doing this Brian. Always interesting to see what sells through book stores. I think it’s worth remembering that Dog Man: Brawl of the Wild had a 5-million copy initial print run. (New York Public Library currently has 157 copies.)
Also, I have to ask, just how many copies of Bloody Crown of Conan sell each year? It might be an interesting comparison point for the comics. : )
So here’s my question.
Given these numbers, versus the direct market, should creator-owned books focus on the bookstore market, or try to crack the DM with single issues first and reach all those readers who are in it for the “love of the medium”?
That’s a very good question. My personal POV is that, given that the “average” graphic novel sells about 600 meager copies in a year into the book market (including Amazon), it seems that having multiple revenue streams is the smartest way to go. Amortizing even part of the cost of production via serialization seems like the smartest possible path.
I’ve not done any analysis of “creator owned” vs “company owned” (ugh, that would take a week just to sort things out), but the “average” includes those millions of copies of DOG MAN. My strongest possible guess is that for a typical creator owned book, the average annual sales would drop significantly from that paltry number.
-B
Last time I commented on one of your BookScan posts was quite a while ago. Great to see as always, but even though there’s a link to that long-ago thread above, it bears repeating:
BookScan undercounts actual sales, and does so with wild inconsistency. I have many more data points now than I did in that 2013 thread you link to, so using the most recent figures I have from my Hachette, Macmillan, and Simon & Schuster royalty statements, I see that BookScan reports between 9% and 57% of actual sales for my books.
The huge and variable difference in what BookScan reports and actual sales makes most comparisons, especially across individual titles, meaningless. For example, if the errors I see for my books to your top 20 chart fall the right way, GUTS could be selling more than the top three DOG MAN books combined. Or not; we have no idea!
Since there is limited returns on books bought via the bookstore market and book scans counts for sales through to customers, the difference could be the books that are still sitting on shelves in bookstores, but count as a sale to the publisher (and show up on royalty statements) since they are outside of the return policy.
I do got to wonder something with the sales of Jojo, why would it increase so much this year specifically.
Like looking at past years data seems like Jojo was doing about the same each year, then all of a sudden double it’s sales?
Something seems a bit off as why would Jojo all of sudden get popular when it’s been having a running anime going on for years then all of a sudden get more popular.
Can’t help but think wires are getting crossed or something… maybe you can help Brian?
Hi Jamie. Though returns might account for some of the discrepancy in the first year after release, publishers hold something they call “reserve against returns” for just this reason: they don’t want to pay authors royalties on copies that haven’t really sold, and for which they haven’t been paid. The percentages I shared above are based on net (read: actual) sales, so if BookScan was doing a good job their numbers would be much closer than approx. 1/10 to 1/2 of what actually happened! (And anyway, no publisher prints two to ten times as many copies as they anticipate selling, especially over the course of almost a decade for some of the books I looked at.)
For Jim, we’ve certainly had this conversation in previous years; BookScan is what BookScan is: a report of sales from STORES that report TO BookScan. Stores that don’t report to BookScan won’t be listed. Copies not sold at reporting stores, sold at book fairs, or to libraries or to schools or to comic book stores, or umpty umpty other places. There are SO MANY paragraphs that talk about how this data is in no way all encompassing or sacrosanct. Heck, read the very last sentence of the piece!
I personally think it is better to have incomplete data out there than no data at all, but there’s absolutely no reason to doubt, that I am aware of, the accuracy of this data judged as what it IS: a report of sales from stores that report to BookScan. I do absolutely believe that within it’s guiderails, this list is correct, based on how I understand their methodology to work.
Anyone thinking that it is anything past or beyond that would be foolish. As I spend way way way too many paragraphs saying.
For “thatguysopinon”: I have no easy way of identifying why JOJO took a sudden spike? Maybe it’s people confusing it with JOJO RABBIT and liking it? I can say, in a statement that means absolutely nothing because it is pure anecdote, at my main store we ALSO tripled sales on the book this year.
-B
Hi Brian.
Well, you did ask how this looks to us, right? :) The point of bringing this up again is because, last sentence and disclaimers in the text aside, you spend a lot more time and space on numbers and lists.
Those things have the look of objective truth, but I’ll go back to the example I gave: when we can’t use BookScan’s numbers to say whether GUTS sold more or less than the top three DOG MAN books combined, what do these lists tell us?
It may be true that “within its guiderails, this list is correct,” but it’s also true that we don’t know how wide those guiderails are, or how they vary from book to book. All I can tell you with absolute certainty — based on comparing actual sales to BookScan’s numbers — is that they vary wildly. BookScan isn’t merely incomplete data. It’s both incomplete and inconsistent. And, surprisingly to me, it’s no better now than it was when I last chimed in on this.
All we have as a result are lots of numbers of unknown accuracy and provenance, and we clearly don’t agree that this allows for much insight into the book trade.
I realize that now it’s probably me that’s tilting at windmills, so maybe it’s time for me to step aside on this…for another seven years, perhaps!
I really doubt that’s why sales would increase to such a degree.
It’s stuff like that I can’t help but find Bookscans really off with stuff, like it not even a gradual increase.
@Brian in the Junji Ito part of the Viz section
Sorry, one other thing – for Mob Psycho 100 vol 1, you say “v1 nearly shifts 11k copies” and for Black Butler vol 1 “brings in just a hair under 13k in the bookstore market”. However on the excel sheet, MP100 ranks at #211 above Black Butler (#228) so I’m wondering if the numbers got possibly mixed up?
In 20kish words, there’s no doubt I have a few spoonerized numbers.
-B
Comments are closed.