

Continuing our look at the sales distribution charts for September, it’s time to see how Marvel looked.
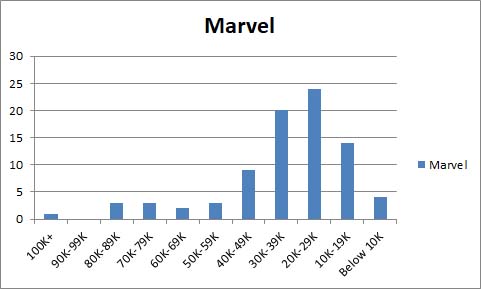
Marvel had a very big launch in September. ~260.4K orders of Return of Wolverine #1. That’s a huge number, but you know Marvel… lots of variant covers and retailer order incentives. That’s not 260K copies snapped up by readers or collectors. If we go back and look at where Return of Wolverine #1 fell on the Comixology chart, we find it in between Justice League #8 (76,360 copies ordered) and Avengers #8 (58,060). Does that mean that somewhere between 58K – 76K readers picked up Return of Wolverine #1? Not necessarily, but that range is probably a lot closer to the truth than pretending 260K has much to do with actual readership.
And really, if it’s outselling Avengers, that’s about all Marvel can really ask for these days. Very few comics can cross that 60K ordering line these days. Speaking of crossing that line, there really are a few at the moment.
- Fantastic Four #2 – ~85.5K
- Amazing Spider-Man #6 – ~84.4K
- Amazing Spider-Man #5 – ~82.9K
- Spider-Geddon #0 – ~74.5K
- Amazing Spider-Man Annual # 1 – ~73.8K
- Venom #6 – ~73.5K
- Avengers #7 – ~65.8K
- Infinity Wars #3 – 63.7K (even)
Now, much like our old Canadian buddy Logan, you can’t really trust these A-list numbers to reflect actual readers. There are speculators out there. There are variant covers. Venom behaves a lot more like a 35K-40K comic than a 73K comic when you look at the Comixology digital charts, though it’s the one with the most drastic difference. Fantastic Four does appear to be their bestseller on digital (outselling Superman, which did ~67.4K in print for September), so there’s probably some truth to where it’s charting, despite any padding from speculators and variants. Amazing Spider-Man and Venom have been out long enough, it seems to be a legitimate ordering level, so whatever’s working better in print seems to be steady so far, though it isn’t clear if Avengers is going to land above or below 60K. Digitally, most of these books act like they’re selling between 50K to… perhaps 58K. As long as the speculators and collectors keep turning up, it’s a business model. Just because things are selling significantly lower doesn’t mean there’s speculator and variant activity boosting the print totals, but based on how the Comixology charts have historically matched up with the Diamond charts, it’s a strong possibility.
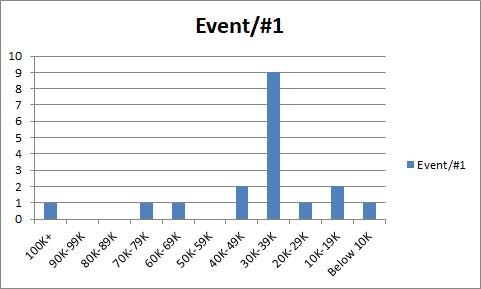
Let’s pull back and have a look at Marvel with the Events and #1s separated out from the rest.
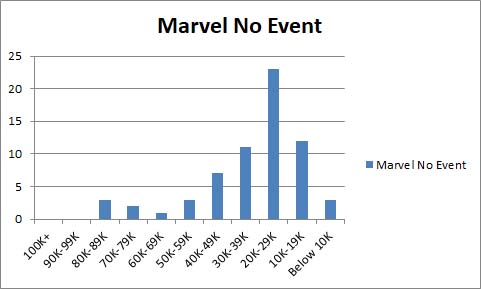
Even without the Events and #1s, that’s as healthy as Marvel has looked in a while. Now, it’s fair to ask where Fantastic Four will settle. It’s actually fair to ask if Amazing Spider-Man and Venom will keep up those numbers. But for the moment that’s not a bad picture.
Are the non-Event ongoing titles still congregating lower on the chart than you’d like to see on average? Absolutely. As has been the case for some time, the line is disproportionally distributed with titles selling under 30K. Still, as long as the math is working for retailers, you have to be happy with the appearance of a top list, even if one suspects things are tilted slightly toward people buying multiple copies.
And you might well ask “why in the @#$%@ are there so many Event comics in the 30K-39K sales band?”
Four issues of Venom First Host. Two Infinity Wars specials. Two issues of Edge of Spider-Geddon. And if you look at the distribution of titles, a comic selling 30K+ is an above average seller for Marvel right now. You could argue that a mid-to-upper 30Ks seller like Venom First Host is a good seller, approaching a minor hit. 37K-38K doesn’t grow on trees anymore.
And let’s face it, Marvel is going all in on these weekly mini-Event titles, so we’ll be seeing more of them.
Standard disclaimers: The numbers are based on the Diamond sales charts as estimated by the very reliable John Jackson Miller. These charts are pretty accurate for U.S. Direct Market sales with the following caveats: 1) you can add ~10% for UK sales, which are not reflected in these charts; 2) everyone’s best guess is you can add ~10% for digital sales – while some titles do sell significantly better in digital (cough Saga cough), that’s the average rule of thumb; 3) it’s not going to include reorders from subsequent months, although reorders will show up in subsequent months if they’re high enough. So if you’re a monster seller in Southampton and it took the US audience 3 weeks to reorder, it’s probably not going to be reflected here.
What’s a sales band? It’s another way to have a higher level view of the market. The general idea is to divide the market into bands of 10K copies sold and see how many issues are in each band. How many issues sold between 90-99K copies, 80-89K copies, etc. etc. In very broad terms, the market is healthier when there are several titles selling in the 70K-100K+ range because titles that move a lot of copies give the retailers some margin of error on their ordering. When you see titles selling in the 20-29K band and especially below, there’s a pretty good chance a lot of retailers aren’t ordering those titles for the shelf (pull box/pre-order only) or minimal shelf copies at best.
Want to learn more about how comics publishing and digital comics work? Try Todd’s book, Economics of Digital Comics


Comments are closed.