
Continuing our look at July’s sales distribution charts for comics in the Direct Market, it’s time to look at Image and the independent publishers. First up, Image:
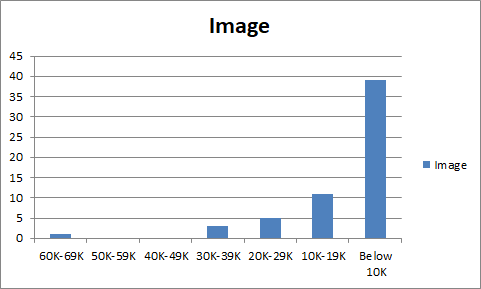
Image is back down to more “normal” levels this month. Walking Dead is king with ~67.7K copies ordered into the DM. Saga, Magic Order and Oblivion Song all sit in the 30K-39K sales band.
The notable debuts are Farmhand with ~26.7K orders and Unnatural with a bit over 26K.
The X-factor here is Die, Die, Die #1. That was the Robert Kirkman comic that was never solicited. It was just shipped out like the orders for Oblivion Song #1. There were not quite 10K re-orders reported, so that means there were probably somewhere around 90K copies shipped. They weren’t all bought by stores, but they shipped. And we’ll see how many copies are ordered for #2.
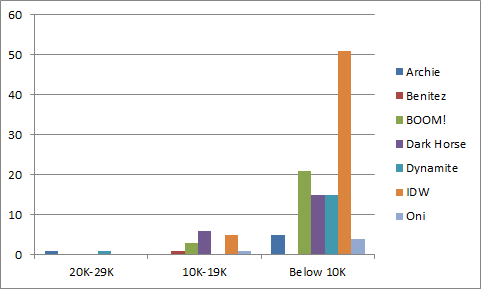
Unlike June, the independent publishers managed to place a couple titles over the 20K line in July. Those would Archie Meets Batman ’66 #1 with ~24.5K copies and Elvira, Mistress of the Dark #1 over at Dynamite with ~23.4K copies.
Notable sellers include: Mighty Morphin’ Power Rangers with ~17.5K, League of Extraordinary Gentlemen Tempest with ~17K, Jim Henson Beneath Dark Crystal with ~16.4K, Sonic the Hedgehog with ~14.2K, Rick & Morty with ~13.9K, Go Go Pwer Rangers with ~13.7K and Lady Mechanika Dame Sans Merci #1 with ~13.6K.
The bestselling creator comic outside of Image was League of Extraordinary Gentlemen Tempest #1, which really shouldn’t be much of a surprise to anyone.
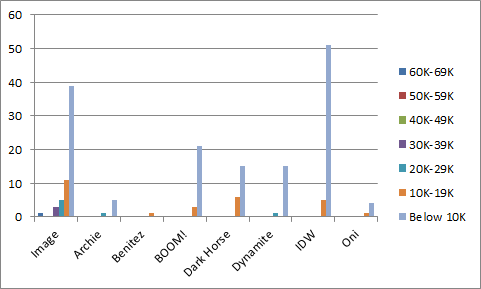
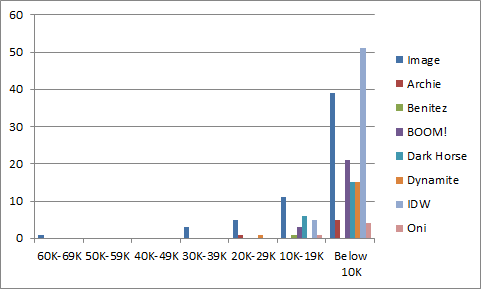
What does it look like when would put Image and the other indies on the same chart? Here are a couple different views:
Standard disclaimers: The numbers are based on the Diamond sales charts as estimated by the very reliable John Jackson Miller. These charts are pretty accurate for U.S. Direct Market sales with the following caveats: 1) you can add ~10% for UK sales, which are not reflected in these charts; 2) everyone’s best guess is you can add ~10% for digital sale – while some titles do sell significantly better in digital (*cough* Ms. Marvel *cough*), that’s the average rule of thumb; 3) it’s not going to include reorders from subsequent months, although reorders will show up in subsequent months if they’re high enough. So if you’re a monster seller in Southampton and it took the US audience 3 weeks to reorder, it’s probably not going to be reflected here.
What’s a sales band? It’s another way to have a higher level view of the market. The general idea is to divide the market into bands of 10K copies sold and see how many issues are in each band. How many issues sold between 90-99K copies, 80-89K copies, etc. etc. In very broad terms, the market is healthier when there are several titles selling in the 70K-100K+ range because titles that move a lot of copies give the retailers some margin of error on their ordering. When you see titles selling in the 20-29K band and especially below, there’s a pretty good chance a lot of retailers aren’t ordering those titles for the shelf (pull box/pre-order only) or minimal shelf copies at best.
For the purposes of these sales band charts, we really are looking for titles that are selling 10K and over, so only publishers with an issue that topped 10K will be listed here. The sad fact is, most independent comics sell under 10K and it’s when they cross that line that they really start getting noticed. The May estimates have the top *500* single issues, which means everything above 980 copies ordered, so this is probably a fairly complete list compared to the old top 300.
Want to learn more about how comics publishing and digital comics work? Try Todd’s book, Economics of Digital Comics


Comments are closed.