


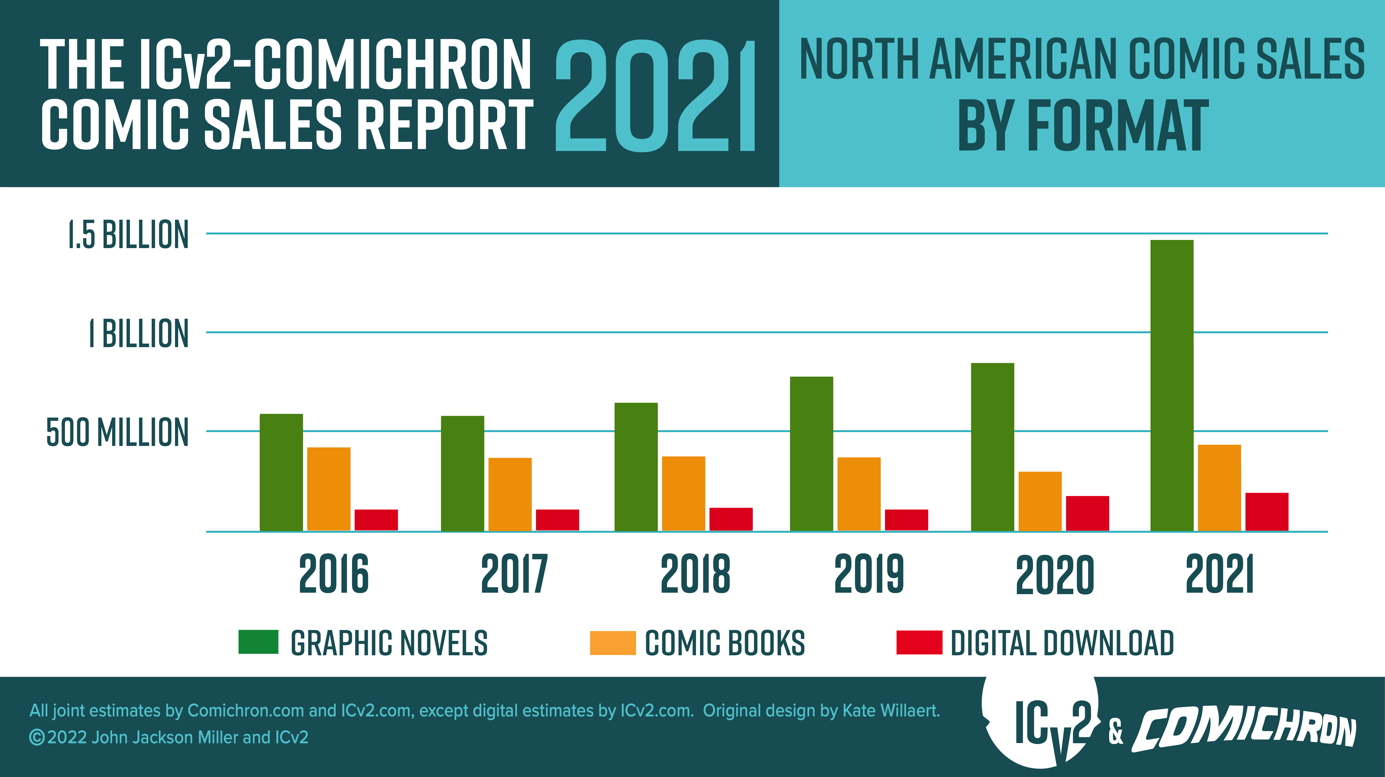
Comics and graphic novel sales surged during the second year of the pandemic, showing growth in every format and channel for an over all growth of 60% in 2021.
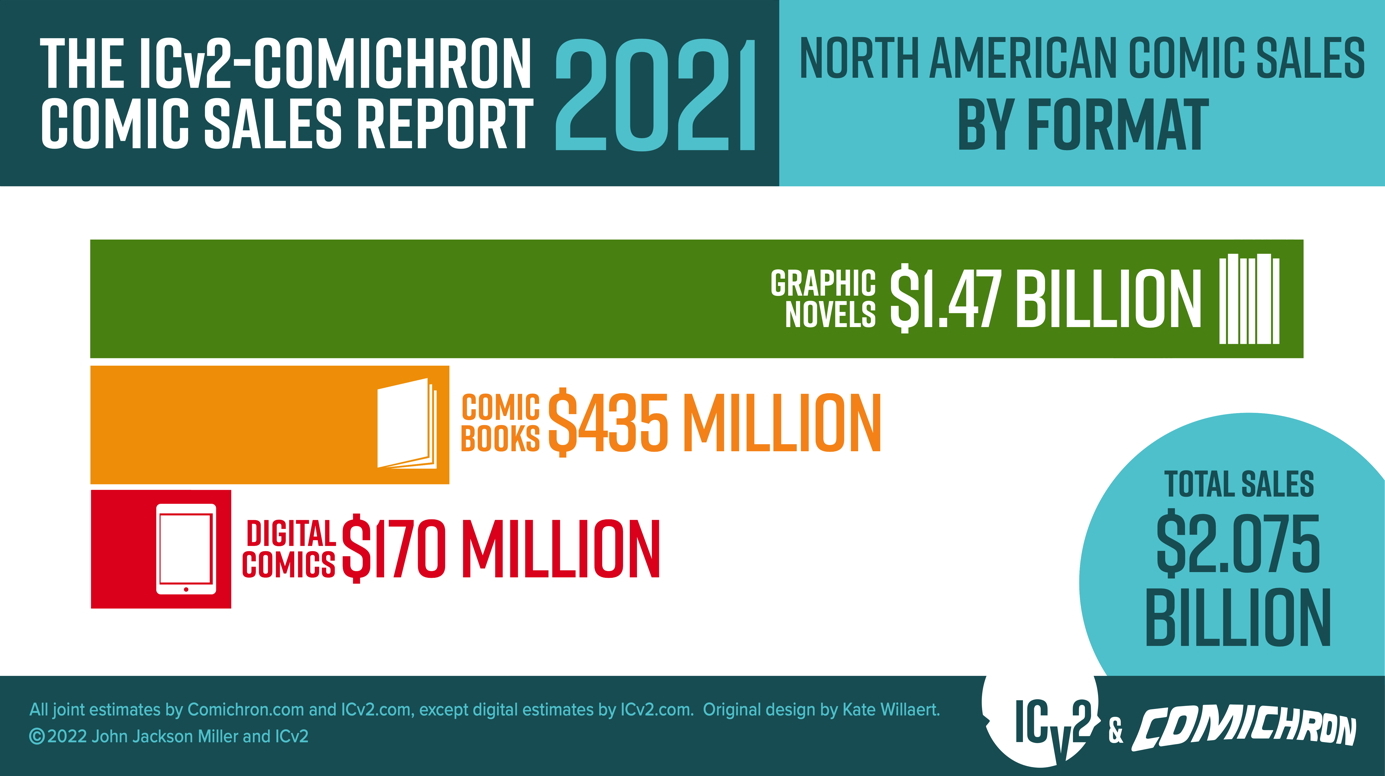
That’s the word from the annual joint sales report from ICv2’s Milton Griepp and Comichron’s John Jackson Miller. Total comics and graphic novel sales to consumers in the U.S. and Canada were approximately $2.075 billion, a 62% increase over sales in 2020, and up over 70% from sales in 2019, the last pre-pandemic year.
“Publishers made more selling comics content than in any year in the history of the business, even when adjusted for inflation,” said Miller of the 2021 estimates. “The biggest year in the modern era, 1993, saw sales of around $1.6 billion in 2021 dollars — and the pricier product mix puts 2021 ahead of what the colossal circulations of the early 1950s brought in, also adjusted for inflation.”
“While graphic novels lead the way, comic sales also exhibited high growth in 2021,” Griepp noted. “Graphic novels were up an astounding 76% growth across channels, while comics were up 53% vs. 2020 and up 23% vs. 2019.”
Growth over 2020, when comics shops were shuttered and strict lockdowns were in place in much of the nation, was not a big accomplishment. But the growth in 2021 was still impressive, with all channels up significantly. Some highlights:
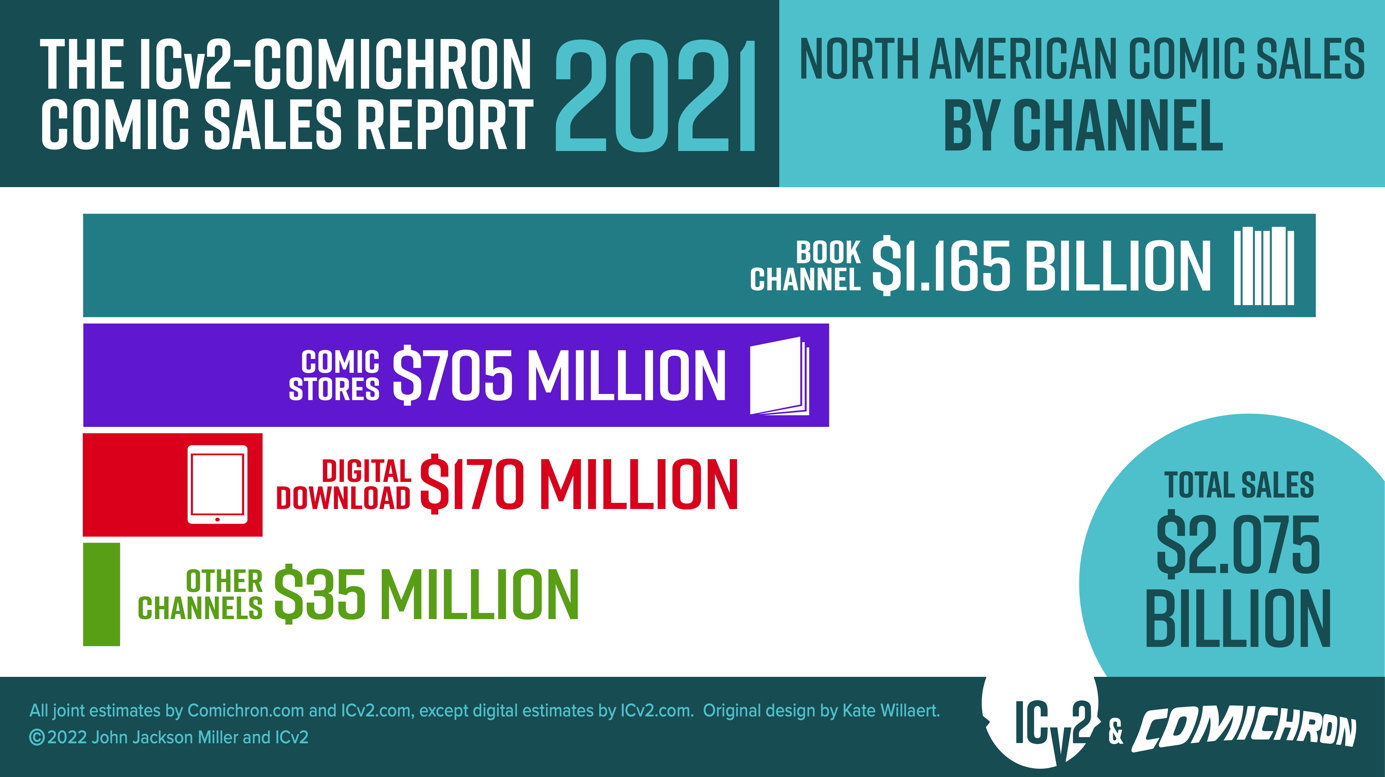
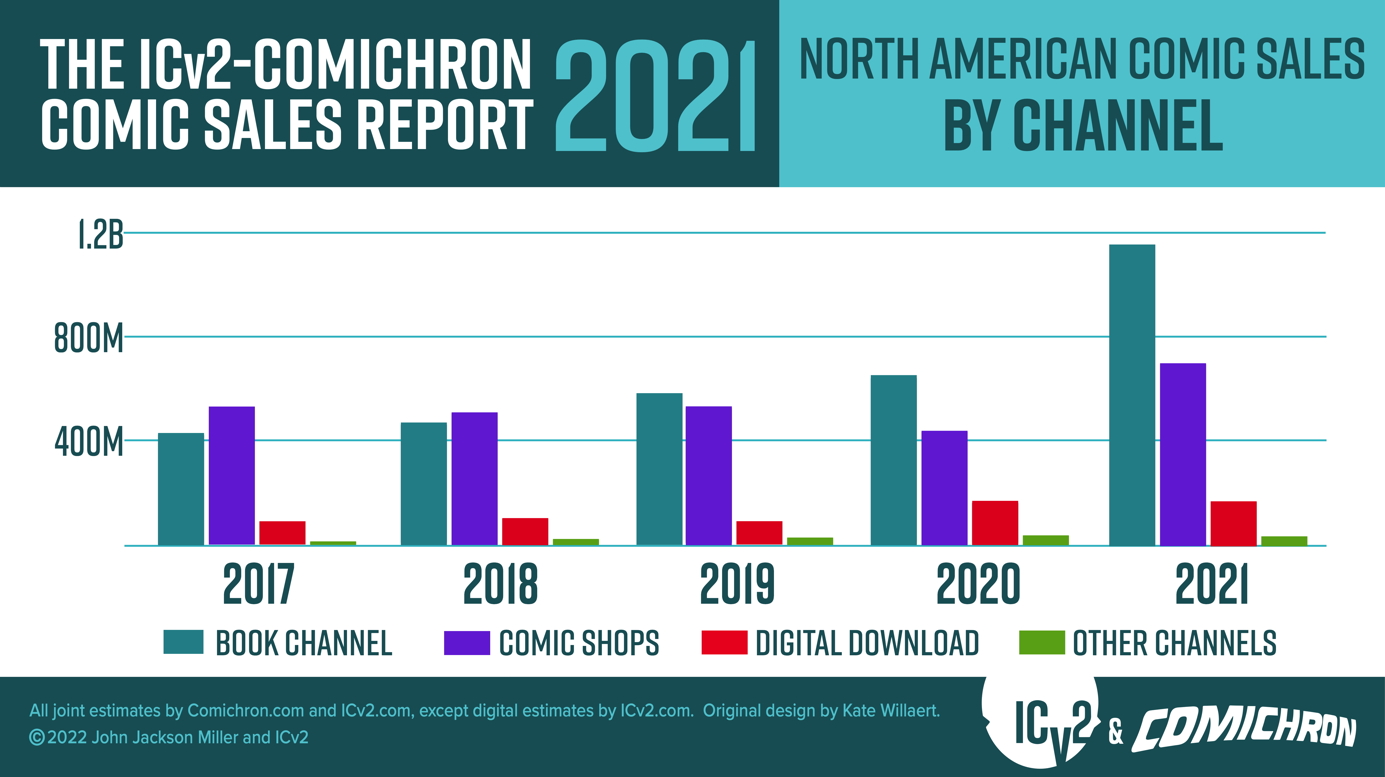
- Comics shop sales were up 60% vs. last year and 34% vs. 2019
- Book channel sales, including book fairs were up 81%.
- Digital growth slowed from 2020.
- Newsstand, which is counted in the “Other” channel continues to decline, but crowdfunding growth offset that.
- The comics periodical format was at $

 , the last pre pandemic year.
 - The number of releases declined, but sales were still up in all channels.
And here are the charts!
The report notes some changes to methodology from previous years:
The analysis now uses data based on sales tracked at point-of-sale by the ComicHub system at over 100 stores. We have used that data to build a model of sales for the entire comic store channel using comparisons developed during periods in which ComicHub and Diamond reporting overlapped.
We also continued refinements in how we use NPD BookScan data; NPD began incorporating ComicHub data into its reports in 2020, so we accounted for the ComicHub portion when estimating the size of the book channel. NPD BookScan collects weekly point-of-sale data on print books from over 16,000 locations including e-tailers, chains, mass merchandisers, independent bookstores, and more. NPD BookScan covers approximately 85% of the overall U.S. trade print book market. Some publishers classify titles that are primarily text, or art books, as graphic novels; those titles are manually removed from the analysis. This year for the first time, via information provided by NPD BookScan, we were able to incorporate sales on graphic novels not classified as such by the publishers (e.g., Maus) in our analysis.
As presented above and in the accompanying infographics, the analysis by Comichron and ICv2 was divided up between periodical comics (what some call “floppies” or “pamphlets”), graphic novels, and digital download-to-own sales. All print figures are calculated based on the full retail price of books sold into the market, and do not account for discounting or markup. Digital sales do not include subscription-based “all you can read” services.
The “Other” channel in our channel breakdown includes the Newsstand (periodical sales through specialty retail and mass merchant chains) and crowdfunding (Kickstarter, etc.) channels. This is the ninth joint market size analysis from ICv2 and Comichron; the first was for 2013 sales.
See below for the Comic Sales Report graphs for 2021!
ICv2
ICv2 is the #1 industry source on the business of geek culture, including comics and graphic novels, hobby games, and the media world surrounding them, on its website, ICV2.com and in its magazine, Internal Correspondence. For the people on the front lines of the geek culture business, staying ahead of the trends isn’t something that can be left to chance-it’s a basic necessity for being successful. That’s why ICv2, where trend-watching is a science, is the #1 source of news and information for the buyers, gatekeepers, and tastemakers.
Comichron
Comichron is the world’s largest public repository of comic-book sales figures, featuring data from the 1930s to today about comic book and graphic novel circulation, cover prices, and market shares on its website, comichron,com. With data and analysis on the distant past as well as the present, Comichron serves as a trusted resource for academics studying the historical reach of the medium and for collectors seeking accurate information about how many copies of a comic book originally circulated.


So the growth was mainly in book stores, not comic shops, and in trades and OGNs, not single issues. While good for the medium, what does that say about the DM in the long run?
Yes, growth in the industry was significant, BUT not for Marvel and DC which saw significant decline due to the unappealing nature of their output.
Dying comics shops.
I wonder how much of it is due to the overheated economy in general. Or in other words, if sales are up overall in every sector, are more people coming to comics or do the same people have more money to spend?
Comments are closed.