

[Editor’s note: I’ve posted today’s complete charts and numbers for May 2014 along with commentary from John jackson Miller from Comichron. My own comments are in itals thus.]
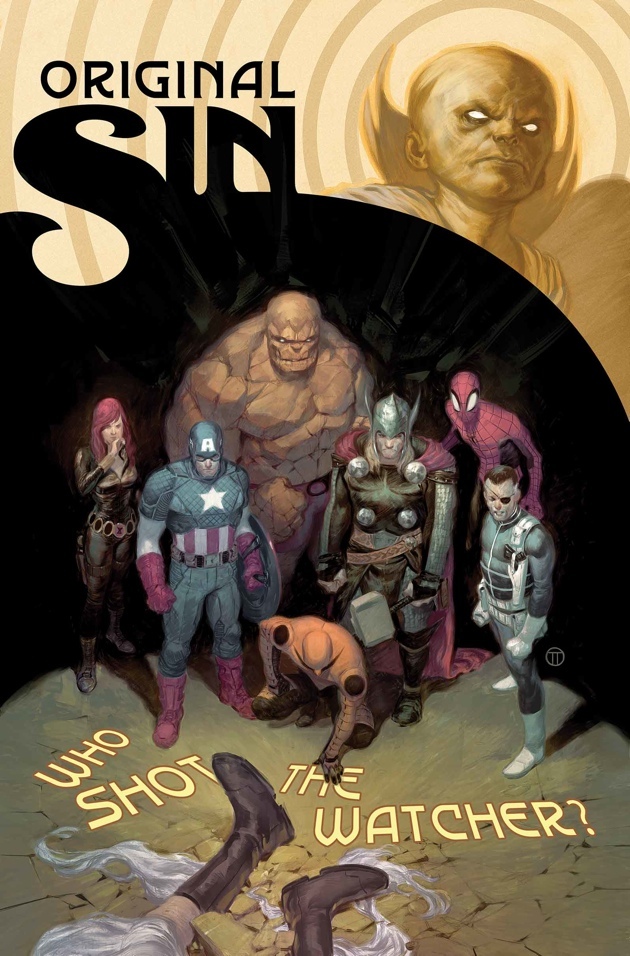
Marvel’s Original Sin #1 led the market in a month that included a Spider-Man movie release and what Diamond Comic Distributors reported was its best Free Comic Book Day yet. That’s according to Diamond’s just-released report on what comics shops in North America ordered in the month of May.
Retailers purchased a little over $43 million in comic books in May, down 4.52%; periodical sales were down only 2%. It was a four-week month versus a five-week month last year, so that performance is not bad, if unremarkable. The slate of new titles was much lighter than we’ve seen in a while: 427 new comic books came out, down 54 from April. It’s the lowest number of new comic releases in six months.
Year-to-date sales are now essentially flat at a little less than $208 million, down about a third of a million dollars versus the same period in 2013. The comparative sales statistics:
| DOLLARS | UNITS | |
| MAY 2014 VS. APRIL 2014 |
||
| COMICS | -10.72% | -7.35% |
| GRAPHIC NOVELS | -10.24% | -19.32% |
| TOTAL COMICS/GN |
-10.57% | -8.41% |
| MAY 2014 VS. MAY 2013 |
||
| COMICS | -2.01% | -6.00% |
| GRAPHIC NOVELS | -9.47% | -15.27% |
| TOTAL COMICS/GN |
-4.52% | -6.79% |
| YEAR-TO-DATE 2014 VS. YEAR-TO-DATE 2013 |
||
| COMICS | -1.13% | -6.72% |
| GRAPHIC NOVELS | 1.96% | 4.54% |
| TOTAL COMICS/GN |
-0.16% | -5.85% |
Again, May included Free Comic Book Day, and Diamond announced at its May seminar and on Twitter that its retailers had overwhelmingly reported in a survey that day was their best sales day ever. The problem is that it’s difficult to put a dollar figure to such a statement — and also we do not know how long the retailers surveyed have been operating.
The single best sales day in all of comic shop history in dollar terms is almost certainly the day that the “Death of Superman” issue, Superman Vol. 2 #75, was released in November 1992: reports at the time were of a $30 million day that day, more than $50 million when adjusted for inflation. There were more than double the number of comic shops then than exist now. A $30 million day today would require more than $10,000 in sales per location ($17,000 inflation-adjusted). Since all the new product retailers ordered in the entire month amounted to $43 million, odds are the “Death of Superman” day still holds the crown — but Diamond probably on the mark that it’s the best Free Comic Book Day, given its finding that retailers said sales were up 38% over last year’s event.
Once again, Original Sin, featuring the death of the perennial murder witness known as The Watcher, was the top title, passing the second — and 1.1 — issues of last month’s blockbuster, Amazing Spider-Man. The top sellers:
| Comic Book | Price | Publisher | |
| 1 | Original Sin #1 | $4.99 | Marvel |
| 2 | Amazing Spider-Man #2 | $3.99 | Marvel |
| 3 | Amazing Spider-Man #1.1 |
$3.99 | Marvel |
| 4 | Batman #31 | $3.99 | DC |
| 5 | Forever Evil #7 | $4.99 | DC |
| 6 | Original Sin #2 | $3.99 | Marvel |
| 7 | Justice League #30 | $3.99 | DC |
| 8 | The Walking Dead #127 | $2.99 | Image |
| 9 | New 52 Futures End #1* |
$2.99 | DC |
| 10 | Batman Eternal #5* | $2.99 | DC |
Meanwhile, the Batman Volume 4: Zero Year: Secret City hardcover led the graphic novel list:
| Graphic Novel or Trade Paperback |
Price | Publisher | |
| 1 | Batman Volume 4: Zero Year: Secret City HC |
$24.99 | DC |
| 2 | Batman Volume 3: Death Of The Family |
$16.99 | DC |
| 3 | Black Science Vol. 1: How To Fall Forever |
$9.99 | Image |
| 4 | X-Men: No More Humans HC |
$24.99 | Marvel |
| 5 | Black Canary And Zatanna: Bloodspell HC |
$22.99 | DC |
| 6 | Manifest Destiny Volume 1 |
$9.99 | Image |
| 7 | Hellboy In Hell Volume 1: Descent |
$17.99 | Dark Horse |
| 8 | Saga Volume 3 | $14.99 | Image |
| 9 | Manhattan Projects Vol. 4: Four Disciplines |
$14.99 | Image |
| 10 | Godzilla: Awakening HC |
$19.99 | DC |
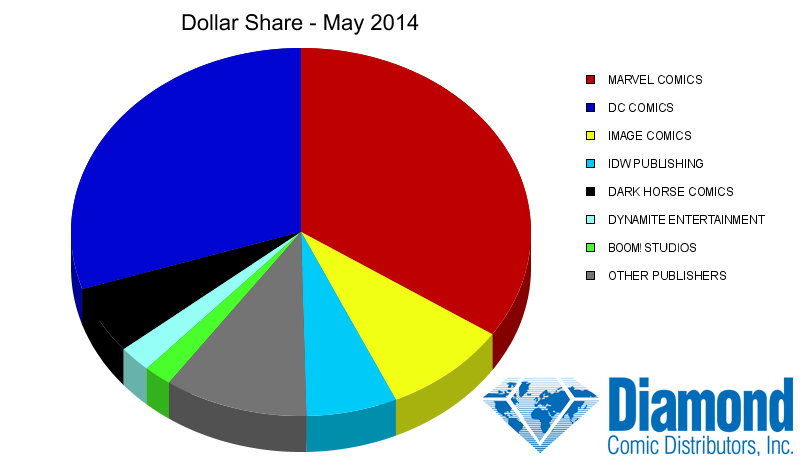
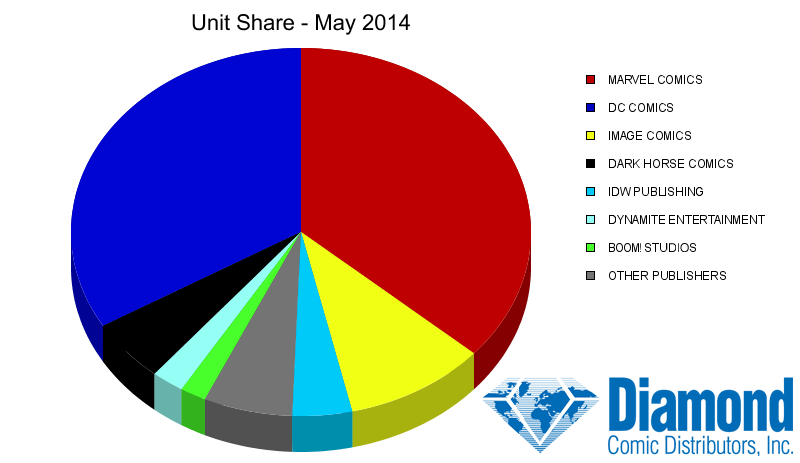
In the market share department:
| PUBLISHER | DOLLAR SHARE | UNIT SHARE |
| Marvel | 34.38% | 36.46% |
| DC | 30.04% | 33.52% |
| Image | 8.86% | 9.96% |
| IDW | 6.38% | 4.18% |
| DarkHorse | 5.96% | 5.50% |
| Dynamite | 2.30% | 2.29% |
| Boom | 1.97% | 1.84% |
| Avatar | 1.03% | 0.88% |
| Random House | 0.88% | n.a. |
| Zenescope | 0.81% | 0.84% |
| Archie | n.a. | 0.97% |
| Other | 7.39% | 3.56% |
Finally, a look at the number of titles released. Again, it was the lightest slate since November on the comics side:
| Publisher | New Comics | New Graphic Novels |
New Magazines | Total New Items |
| DC | 87 | 30 | 0 | 117 |
| Marvel | 74 | 38 | 0 | 112 |
| IDW | 45 | 21 | 0 | 66 |
| Image | 54 | 11 | 0 | 65 |
| Dark Horse | 36 | 23 | 0 | 59 |
| Dynamite | 35 | 1 | 0 | 36 |
| Boom | 20 | 7 | 0 | 27 |
| Zenescope | 13 | 2 | 0 | 15 |
| Random House | 0 | 14 | 0 | 14 |
| Avatar Press | 8 | 1 | 0 | 9 |
| Other Publishers |
55 | 98 | 18 | 171 |
| TOTAL | 427 | 246 | 18 | 691 |


")


“The problem is that it’s difficult to put a dollar figure to such a statement — and also we do not know how long the retailers surveyed have been operating. The single best sales day in all of comic shop history in dollar terms is almost certainly the day that the “Death of Superman” issue, Superman Vol. 2 #75, was released in November 1992”
Our FCBD this year at the main store was was 268% of the day that Superman #75 came out (actually, the SECOND day of sales in ’92 was stronger for us…. by about $20)
We actually regularly (at least once a month) top the sales from Superman #75 day-ish,
-B
Yeah, I guess there’s two different ways to approach it. It’s possible it could be the best day for all shops existing now — and yet still rank below the 1992 day when you look at all shops overall, which is what that $30 million total referred to. Leaving inflation out of it, the average shop today would need to triple or quadruple the average shop’s sales then to reach the same overall figure, given the difference in the number of shops. (Not all ordering accounts were shops, to be sure, which makes it difficult to put a number on it.)
I also believe there was a lot of variance in shop performance back in 1992 based on stores’ markup policies. Given the reports we got of stores marking that issue up to $20 and $30, some chunk of that $30 million (if that figure is correct) came from that.
If one researches the ICV2 White Papers, calculates the Direct Market share, and divides by the number of stores, what is the annual figure per store?
Granted, this would include online sales as well, but would still give a better approximation.
An easy calculation which is not so easy, plus the nuances. We know that Diamond sold $517.66 million in comics, graphic novels, and magazines into the North American direct market. Heidi reported that Diamond had 2,638 accounts last September — http://www.publishersweekly.com/pw/by-topic/industry-news/comics/article/59513-diamond-reports-number-of-comics-shops-up-4-in-2013.html. So we’d be looking at $196,000 per account, which is not far off what it’s been for a very long time, in my years of reading retailer surveys.
Now, it’s not clear whether that 2,638 total includes UK — and it almost certainly does include mail-order outlets. I seem to recall that Hastings is in the mix, too. So the average mainline shop total would be north of $200k annually — but my feeling is it would need to be a good deal above it for the average one to have a $11,373 day — which would then result in a $30 million day marketwide. Inflation included, the average shop would have needed $18k to hit that mark.
None of this is to reject the idea that existing shops had their best day ever, just that in aggregate, the much larger pool of shops likely did better as a group in that single day in 1992. We’d be looking at something like $100k annually per account at that point or less — many of those accounts didn’t represent storefronts, and it’s suspected there was duplication in the numbers because of accounts with different distributors not being weeded out of the count.
“November 1992: reports at the time were of a $30 million day that day, more than $50 million when adjusted for inflation”
I dunno, man. I think a dollar was worth quite a bit more back then than whatever source you’re using for inflation. Look at how the price of gas, milk, gold, and single-issue comic books have changed since back then, They’ve all way more than doubled, so I’m not sure a $30 -> $50 conversion is accurate. I mean, I’m sure it says that on some chart somewhere, but in my experience it seems that official sources try to downplay inflation as much as possible so as not to freak people out.
Comments are closed.