
Marvel, DC, and Image split the charts in various ways in June, as comics sales continued to stay above 2012 levels, according to charts just released by Diamond.
DC’s Superman Unchained #1 by Scott Snyder and Jim Lee was the Number 1 comics, while Image had the #1 graphic novel with Walking Dead #18; and Marvel led in both dollars and units, with a 32.77% market share in retail dollars and a 38.29% market share in units.
Comics sales were down from May, which was a five-week month, but otherwise generally up and continue to be strong. John Jackson Miller’s preliminary analysis suggests “A $500 million year is within reach for the first time in the nearly two decades since the glut market of the early 1990s.” And that would be something.
The top three graphic novels in June were Wlaking Dead, the second Saga collection and then Boom’s Adventure Time Collection. The GN charts continue to show strength from a number of different publishers. Periodicals, however, are still a Big Two contest. DC has the top three titles, while Mark Millar’s Kick Ass V.3 #1 came in at #10, meaning a lot of moolah for him. Maybe not time to kill the Icon imprint after all?
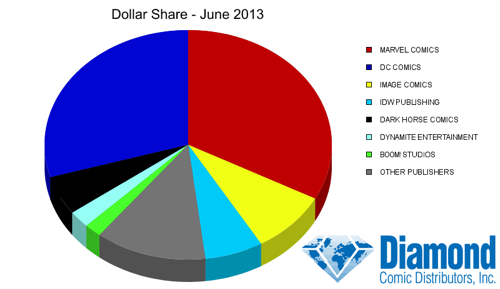
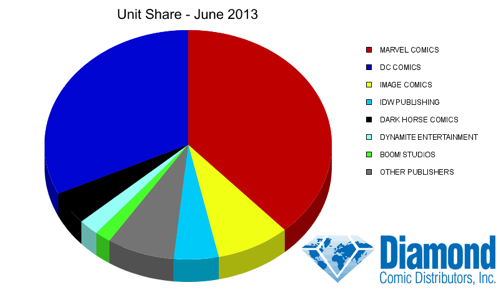
TOP COMIC BOOK PUBLISHERS
|
PUBLISHER |
DOLLAR SHARE |
UNIT SHARE |
| MARVEL COMICS |
32.77% |
38.29% |
| DC COMICS |
29.57% |
32.03% |
| IMAGE COMICS |
8.77% |
8.31% |
| IDW PUBLISHING |
6.55% |
5.01% |
| DARK HORSE COMICS |
5.51% |
4.64% |
| DYNAMITE ENTERTAINMENT |
2.40% |
2.30% |
| BOOM! STUDIOS |
1.93% |
1.82% |
| EAGLEMOSS PUBLICATIONS |
1.76% |
0.36% |
| VALIANT ENTERTAINMENT |
1.04% |
1.03% |
| AVATAR PRESS |
0.91% |
0.84% |
| OTHER NON-TOP 10 |
8.80% |
5.38% |
COMPARATIVE SALES STATISTICS
|
|
DOLLARS |
UNITS |
|
JUNE 2013 VS. MAY 2013 |
||
| COMICS |
-2.27% |
-2.86% |
| GRAPHIC NOVELS |
-19.07% |
-20.90% |
| TOTAL COMICS/GN |
-7.92% |
-4.40% |
|
JUNE 2013 VS. JUNE 2012 |
||
| COMICS |
5.28% |
1.17% |
| GRAPHIC NOVELS |
-3.35% |
-4.31% |
| TOTAL COMICS/GN |
2.57% |
0.76% |
|
SECOND QUARTER 2013 VS. FIRST QUARTER 2013 |
||
| COMICS |
2.27% |
-0.31% |
| GRAPHIC NOVELS |
10.39% |
11.83% |
| TOTAL COMICS/GN |
4.72% |
0.57% |
|
SECOND QUARTER 2013 VS. SECOND QUARTER 2012 |
||
| COMICS |
6.30% |
2.95% |
| GRAPHIC NOVELS |
3.62% |
5.63% |
| TOTAL COMICS/GN |
5.43% |
3.16% |
|
FIRST HALF 2013 VS. FIRST HALF 2012 |
||
| COMICS |
13.26% |
10.25% |
| GRAPHIC NOVELS |
9.25% |
8.72% |
| TOTAL COMICS/GN |
11.98% |
10.13% |
TOP 10 COMIC BOOKS
|
RANK |
DESCRIPTION |
PRICE |
ITEM CODE |
VENDOR |
|
1 |
SUPERMAN UNCHAINED #1 |
$4.99 |
APR130107 | DC |
|
2 |
BATMAN/SUPERMAN #1 |
$3.99 |
APR130117 | DC |
|
3 |
BATMAN #21 |
$3.99 |
APR130161 | DC |
|
4 |
AGE OF ULTRON #10 |
$3.99 |
APR130589 | MAR |
|
5 |
AGE OF ULTRON #9 |
$3.99 |
APR130586 | MAR |
|
6 |
JUSTICE LEAGUE #21 |
$3.99 |
APR130137 | DC |
|
7 |
SUPERIOR SPIDER-MAN #11 |
$3.99 |
APR130603 | MAR |
|
8 |
SUPERIOR SPIDER-MAN #12 |
$3.99 |
APR130604 | MAR |
|
9 |
ALL-NEW X-MEN #12 |
$3.99 |
APR130600 | MAR |
|
10 |
KICK-ASS 3 #1 (MR) |
$2.99 |
MAR130713 | MAR |
TOP 10 GRAPHIC NOVELS & TRADE PAPERBACKS
|
RANK |
DESCRIPTION |
PRICE |
ITEM CODE |
VENDOR |
|
1 |
THE WALKING DEAD VOL. 18: WHAT COMES AFTER |
$14.99 |
APR130482 | IMA |
|
2 |
SAGA VOLUME 2 TP (MR) |
$14.99 |
APR130443 | IMA |
|
3 |
ADVENTURE TIME VOLUME 3 TP |
$14.99 |
APR130964 | BOO |
|
4 |
STAR-LORD: THE HOLLOW CROWN TP |
$7.99 |
APR130679 | MAR |
|
5 |
DEADPOOL KILLUSTRATED TP |
$14.99 |
MAR130735 | MAR |
|
6 |
THE WALKING DEAD VOL. 2: MILES BEHIND US |
$14.99 |
SEP088204 | IMA |
|
7 |
FATALE VOLUME 3 TP (MR) |
$14.99 |
APR130422 | IMA |
|
8 |
BATMAN & ROBIN VOL. 1: BORN TO KILL TP |
$16.99 |
MAR130270 | DC |
|
9 |
HARLEY QUINN: NIGHT AND DAY TP |
$16.99 |
MAR130276 | DC |
|
10 |
BEFORE WATCHMEN: MINUTEMEN/SILK SPECTRE DELUXE HC (MR) |
$29.99 |
MAR130264 | DC |
TOP 10 TOYS
|
RANK |
DESCRIPTION |
ITEM CODE |
VENDOR |
|
1 |
THE WALKING DEAD: MICHONNE RESIN STATUE | MAR130599 | TMP |
|
2 |
BATMAN: THE KILLING JOKE: THE JOKER ARTFX STATUE | NOV121817 | KOT |
|
3 |
DC COMICS: BATMAN ” NEW 52″ ARTFX+ STATUE | DEC121704 | KOT |
|
4 |
BATMAN: ARKHAM CITY – THE JOKER STATUE | JAN130348 | DC |
|
5 |
MARVEL SELECT: GHOST RIDER ACTION FIGURE | NOV063174 | DST |
|
6 |
MARVEL SELECT: IRON MAN 3 – IRON MAN MK. 42 FIGURE | DEC121590 | DST |
|
7 |
INJUSTICE: THE FLASH VS. RAVEN FIGURE 2-PACK | MAR130315 | DC |
|
8 |
INJUSTICE: CYBORG VS. HARLEY QUINN FIGURE 2-PACK | MAR130314 | DC |
|
9 |
TOMB RAIDER PLAY ARTS ~KAI~: LARA CROFT FIGURE | DEC121781 | SQU |
|
10 |
STAR TREK: FIRST CONTACT – USS ENTERPRISE-E SHIP | AUG108211 | DST |
TOP 10 GAMES
|
RANK |
DESCRIPTION |
ITEM CODE |
VENDOR |
|
1 |
MARVEL HEROCLIX: FEAR ITSELF MONTH 2 ORGANIZED PLAY KIT | FEB138562 | NEC |
|
2 |
MAGIC THE GATHERING TCG: MODERN MASTERS BOOSTER PACKS | APR132231 | WZK |
|
3 |
DC HEROCLIX: MAN OF STEEL BOOSTER PACKS | MAR132260 | NEC |
|
4 |
DC HEROCLIX: MAN OF STEEL STARTER SET | MAR132263 | NEC |
|
5 |
LORD OF THE RINGS HEROCLIX: FELLOWSHIP BOOSTERS | FEB138641 | NEC |
|
6 |
THE WALKING DEAD TV BOARD GAME | JUL112137 | CRY |
|
7 |
DC HEROCLIX: MAN OF STEEL MINI GAME | MAR132262 | NEC |
|
8 |
DC HEROCLIX: MAN OF STEEL MARQUEE PACK | MAR132261 | NEC |
|
9 |
MAGIC THE GATHERING TCG: DRAGON’S MAZE BOOSTER PACKS | FEB131931 | WZK |
|
10 |
PATHFINDER BATTLES BUILDER SERIES: WE BE GOBLINS BOOSTER PACKS | MAR132264 | NEC |
How does Diamond calculate the charts? It all starts at the comic book shop.
Data for Diamond’s sales charts — which include the monthly market shares and all top product charts — are compiled by Diamond Comic Distributors from a universe of over 3,500 comic book specialty shops located in North America and around the world. The account base includes brick-and-mortar comic book specialty shops, Internet merchants, and other specialty stores.
Unit and dollars sales are calculated based upon orders invoiced and shipped to Diamond accounts during any given month, which comprises initial pre-orders, advance reorders, and reorders, minus any copies that are received back from a title marked as returnable.


(That’s $500 million in the direct market; the business is of course well past that figure in the overall North American market. And yes, inflation caveats apply as usual.)
Didn’t a wise old book tell us that we should all be God’s children?
Comments are closed.