
The Beat has always been fascinated by sales charts. Of course, it’s fun to see who’s #1, who’s coming up fast with a bullet, who’s a surprise hit, and so on. But it also reflects my long standing belief that comics are a medium not a genre. For a very, very long time superheroes dominated the American comic book market, and as comics shops became the main outlet for comic books, retailers continued to believe that their customers were only interested in superheroes and anything else was a tough sell.
Of course this became something of a self-fulfilling prophecy as publishers put out more superhero comics, retailers ordered more superhero comics and customers expected comics shops to sell superhero comics as the vast majority of their business. Back in the 90s I helped form an organization called Friends of Lulu whose goal was to persuade publishers and retailers that women liked to read comics. I remember one discussion that involved suggesting that putting a poster for a Simpsons comic book in the window of a comics shop might draw in new customers who liked the Simpsons – a show that was then perhaps at the peak of its popularity. This idea was not an easy sell to many retailers of that era.
Anyway, my thought was that accurate sales charts would show that various kinds of material were selling at profitable levels, and promote the idea that non-superhero materials could hold their own in the market.
Once Borders and Barnes and Noble began carrying more graphic novels – and most crucially, more manga – at the turn of the century, Bookscan charts became more widely accessible to people in the industry, mostly through Brian Hibbs’s yearly analysis. I have those charts archived at The Beat, although in writing this I see I need to update some of my links. Here’s the first chart from 2003 (as an Excel download). And here’s a screen shot of the first 25 or so titles:
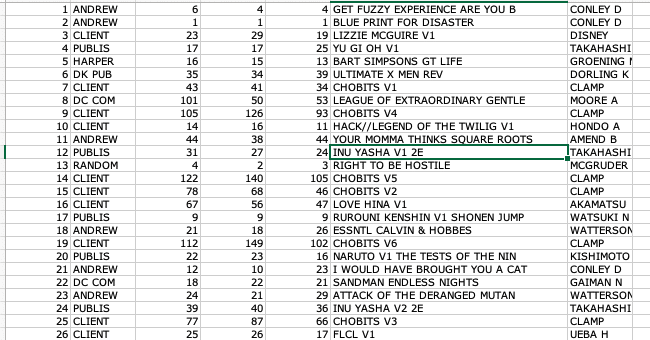
As you can see, not very many superhero books there, and so the revolution was well underway. (Also, man Get Fuzzy was popular.) I can attest to the amazement that these numbers created in the industry at the time.
Unfortunately, Bookscan no longer allows this kind of analysis, and with comics distribution scattered to the winds, we no longer get the kind of official unified sales charts we once had. I first started moaning about this in 2023, as did others in the industry, and over the last few years there’s been a steady drumbeat of “We need sales charts!” from various industry players, followed by frustration over the inability to get them. (And yes we do have highly selective charts from various entities, which I will get to.)
Interestingly, this has been something of a steady argument between myself and David Harper of SKTCHD over the last few years. I’m very pro sales chart but David thought that we might want them but didn’t necessarily need them. He felt that the industry was doing fine without them, which is true, as far as it goes.
David being the kind of person who likes data and facts (whereas I go by my gut and want to see sales charts to prove that I’m right, wink wink), at this year’s ComicsPRO he undertook an informal straw poll asking people two questions: do you want sales charts and do you NEED sales charts. He published his findings on SKTCHD and I am thrilled to say that for the first time there is a chart about sales charts.
David’s article is paywalled (behind a modest $5 $3 subscription price) but since they prove I was right, I’m going to reproduce them here.
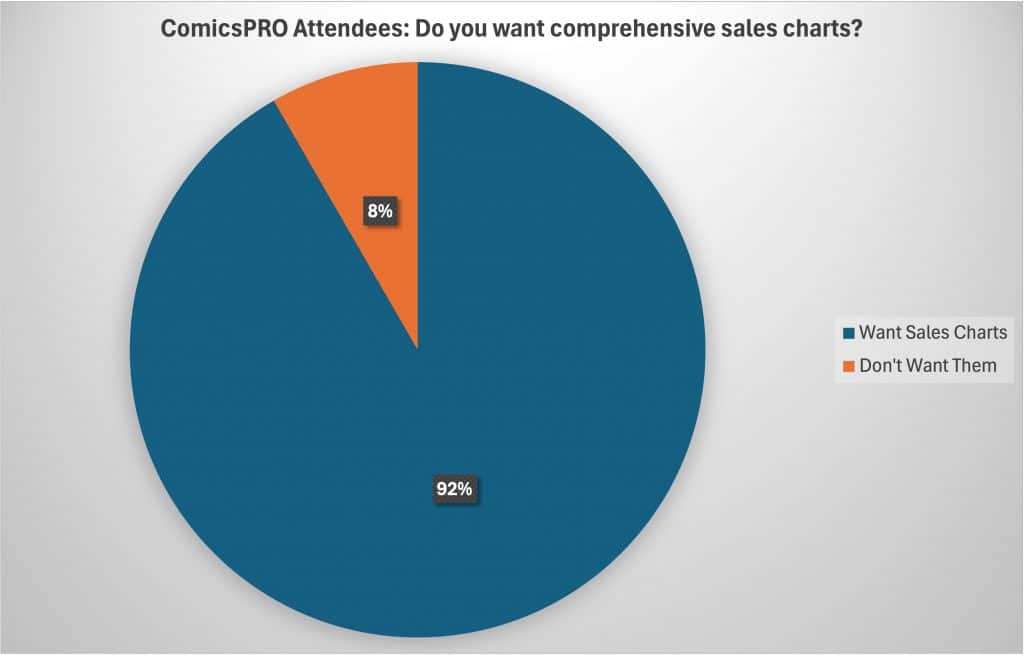
See? I WAS RIGHT! TOLJA! I WAS RIGHT!
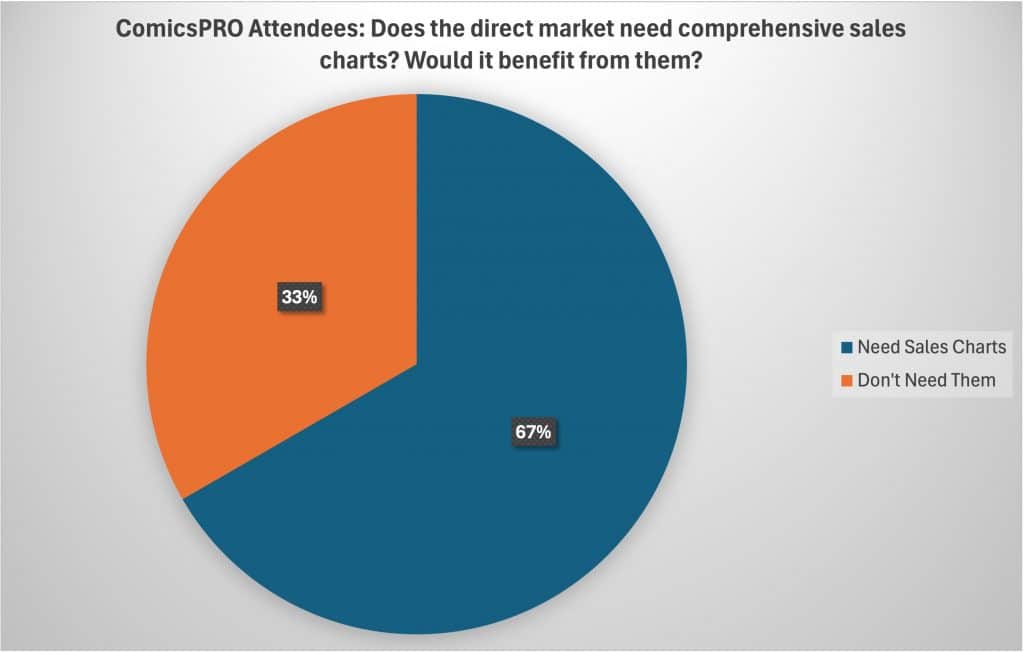
I do acknowledge that “want” outweighs “need,” and the argument that we’re doing perfectly fine without sales charts is a powerful one. But how do we know we are doing perfectly fine? Well, because every comics shop and every publisher has their own sales chart that tell them they are doing fine, and then they tell us.
Harper noted that the people who DON’T want sales charts back are mostly publishers, and I get that. Charts show failure as well as success, and some things that are highly touted are not as highly purchased. Every great author or musician sees their efforts slowly go down the charts as time passes, and that’s not a great feeling, for sure. But as Colleen McCullough fades away, Colleen Hoover rises, in the great circle of culture.
The SKTCHD article actually lays out a lot of more complex and nuanced reasons we need sales charts, however, one of them being so creators can see their relative sales and know their worth better. Harper gives four reasons (#1 is just transparency) but here are #2 and #3:
The next two points were the most compelling to me. One was contextualization, as in sales charts would give everyone involved a better idea of their performance relative to the market. One creator asked, “How do I know if I’m doing well?” because if they don’t have access to any sales data, they’re just guessing, effectively. That’s a great point. The context sales charts offer creators allows them to better position themselves in the market and to publishers when trying to strike deals for new books, giving them more ammunition during negotiations.
…
That data also allows them to better justify certain titles and genres when pitches come their way. For example, if sales charts say that a slice of life title is doing surprisingly well in comic shops, then maybe publishers would be more accepting of that genre, one that’s typically outside the imagined wheelhouse for this side of the industry. While some worried it could lead to doubling down on the typical genres and titles publishers accept, others think it could open the market up to story types it’s often hesitant to embrace.
The fourth reason is to goose competition a bit more. Maybe if a book is sliding it needs to be a little better?
Reason #3, comps, is one that I’ve often heard. “Supernatural thrillers are doing well, so you should publish my supernatural thriller!” It also helps publishers with marketing plans and more. Indeed, when the NY Times did away with their graphic novel bestseller lists, it was a sad day for publishers (apologies for all the broken Twitter links, sigh.)
I guess another reason that I’ve always been pro-sales charts is that EVERYONE ELSE HAS THEM! Bookscan tells us that Dav Pilkey is one of the world’s best selling authors, and Jujutsu Kaisen sells like crazy. Webtoons – the generic format not the company – all have likes and rankings and popularity charts that help readers find new things to check out. Far from hurting popularity, these rankings contextualize it.
After his straw poll, David saw the light, and he is now pro sales chart as well!
While I went in thinking sales charts are a want, not a need, I now believe that true, comprehensive sales charts are both a want and a need. It was one of my early conversations that convinced me, as a chat with a publisher and a notable creator resulted in that shift. While I do believe there would be cons to the pros of sales charts, these discussions helped me understand that the latter would almost certainly outweigh the former, especially for creators and publishers. The current deficit of information can be harmful to those in certain roles, and even if retailers don’t use it in the way many believe they do, the value is still there.
Thank god the last apostate has been converted!
But that still leaves us with the problem of not actually having any means to have accurate and comprehensive sales charts for the comic book direct sales market. We do have several efforts that provide metrics. Most prominent for now is ICv2’s monthly charts based on Bookscan and, for the DM, stores that use the ComicHub POS system. Unfortunately, ComicHub is used by only about 100 stores and a lot of people think they don’t reflect the entire industry. But, as I like to say, they are a metric!
Most recently, Prana Direct Market Solutions has been offering sales rankings in their newsletter, based on “the Top 400 selling issues based on Point Of Sales data from the 500+ stores in the Manage Comics and Comic Shop Assistant systems.” We don’t have an index number so John Jackson Miller can’t do his maths, but we can see where things rank.
I confess, I haven’t had a chance to analyze these lists due to various factors….but I intend to start.
In fact, in the latest newsletter, there’s this publisher’s market share chart:
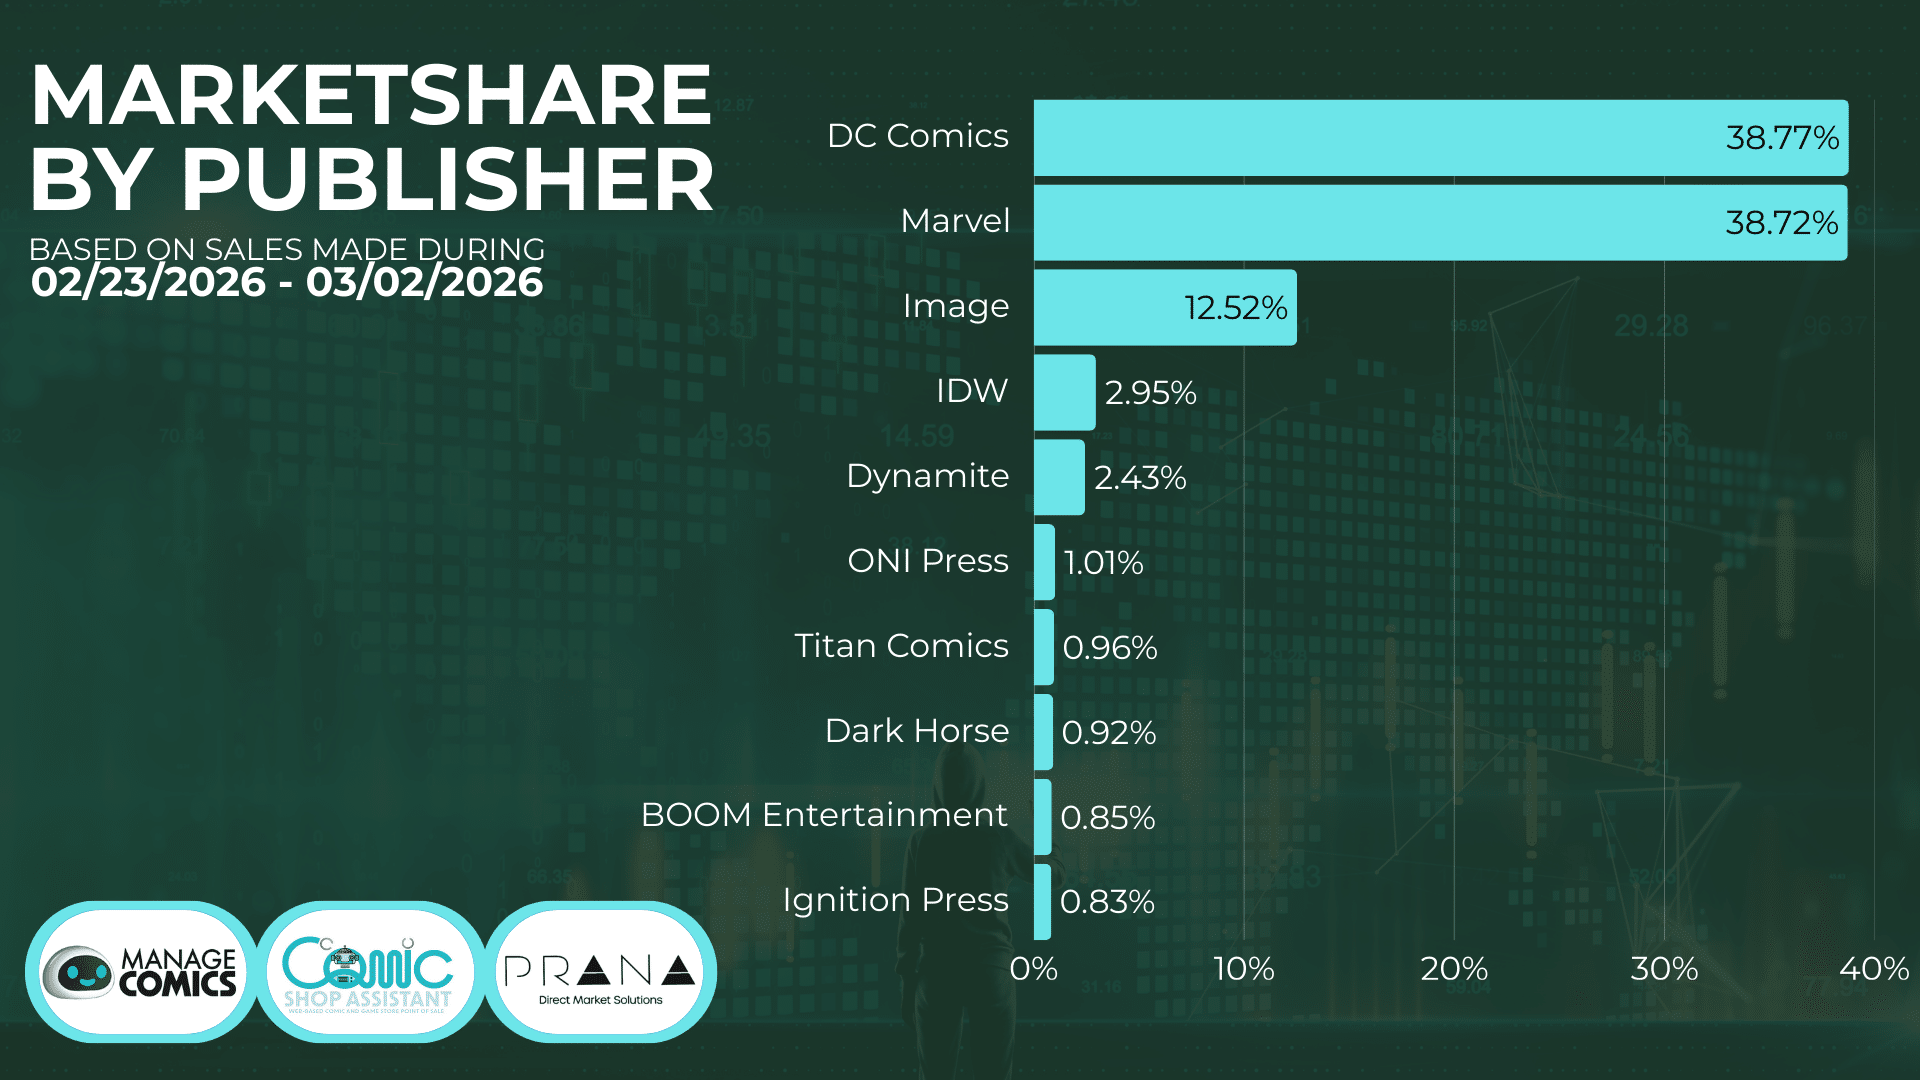
Which I find incredibly fascinating!
DC IS #1! TOLJA! By only a sliver but if you go back a month they were #1 by a much huger margin.
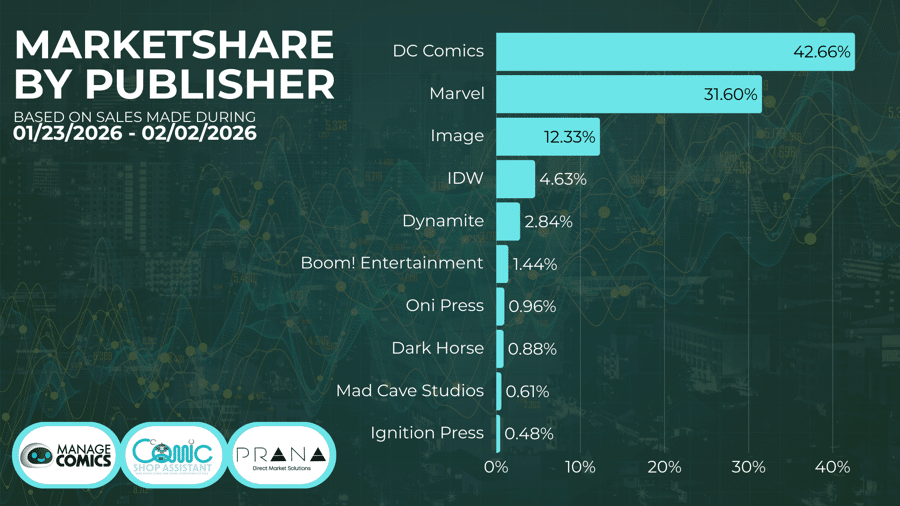
I also find Ignition holding steady at #10 quite interesting…as well as IDW at #4 and Dynamite at #5. Honestly before I saw this chart I could only have vaguely guessed who came after DC, Marvel and Image but thanks to this sales chart…..now we have an idea.
Of course, this is still only part of the retail environment, but, like I said, it’s a metric!
Will we get comprehensive sales charts for the whole industry any time soon? Probably not soon no matter how we might wish for it. The COMET Standard for metadata is the project that will allow a bigger picture but getting all publishers to conform with it is a very slow process. (It wasn’t even a huge topic at ComicsPRO although it was discussed.) I do know that making sales charts has been discussed by all the major publishers and distributors, but just how to do it remains a problem.
But it will happen.
I’ll leave you with one more Heidi-ism, something that I’ve been saying for years or decades on countless podcasts and probably stated here time after time, but I’m going to say it one more time.
The Diamond charts which provided the information on which we based direct market success for 20 years were based on sell-in – that is, what comics shops ordered from Diamond, not what customers actually bought. The direct market has never had comprehensive sell-through data, meaning that the end user of the system was retailers. It is why marketing efforts from publishers were aimed at retailers, and retailers did the hand selling to customers.
The thing that I said over and over is that when we finally had sell-through data….the industry would change forever. For instance, is manga absolutely crushing it? Yes, so maybe superhero stories need to have updated, more immediate storytelling. Are kids buying graphic novels in massive numbers? Yes, so maybe we should have more kids comics. And so on and so forth.
While I concede that any retailer who stays in business has a great understanding of what their customers want to buy, sell-in does not reflect what READERS are finding and liking and buying. It reflects what retailers want to sell. It is not capable of showing the surprise, viral hit, or sudden trends. It is not nimble.
The last year of absolute sales triumph for the direct market has been based on retailers’ own sell-through data, so I can say that I was right again, sort of. (I assume that publishers have still been using sell-in orders, as it’s the most accurate data they have.) Like any smart business person, they are looking at what people are buying, and ordering more of it. And so far, it’s working.
(Didn’t retailers always have sell-through data? Yes, but POS systems, believe it or not, only became widely adopted in this century.)
Both the ICv2 charts and the Prana charts reflect sell-through. That is HUGE. And when we finally get the COMET Standard charts they will also be sell-through. The end user of the system is the reader, as it should be.
So that’s my sales charts sermon. Make it so.


I miss Friends of Lulu. Sad to see what happened to it.
I’ve always said there were different markets for sell-through data and sell-in data, and that we needed both. At Krause Publications, which is where I began my data collection project, we preferred the second, and it wasn’t just because the first was logistically difficult — although we tried for years to make sell-through work. It was that our customers were retailers and collectors — as literally described in our magazine titles, COMICS RETAILER and COMICS BUYER’S GUIDE. The “who’s leading” bit was seen as entertaining information, but the bigger deal was “how can you set a price as a retailer — or know as a collector if a price is fair — if you don’t know whether or not a BATMAN issue in 1985 has the same number of copies in circulation as an issue of UNCANNY X-MEN?”
This was a job for which distributor data — and we had far more internal information for the ones in comics than we ever admitted to having — was well suited. It also “rhymed” with what we at Krause considered the gold standard for transparency in collectible hobbies: numismatics. In coin and paper money collecting, transparency about initial supply is mandated by law in most countries. Thus my STANDARD CATALOG OF COMIC BOOKS had the same mission as our other books: here’s what we’re observing on pricing, but also here’s the initial circulation. And at Comichron I kept sharing that long after I left the company and the book line was kaput.
So why have retailers and collectors been able to function without it, as David says? In part, it’s what caused the downfall of Krause in general: eBay became a source of pricing and professional graders (something that literally started in the coin hobby) began offering census reports to say how many copies of the rarer issues — read as, the ones comics retailers and collectors needed the most information about. I warned my bosses back in 2001 that “data was cheap” because of these sources — which is why I sought to add both the census data and eBay sales averages in our books, so people wouldn’t just look up the info themselves. But they could do it in the absence of anyone collating the data, and have been doing so.
I’ll personally always prefer circulation numbers to sell-through rankings, but in part it’s because I’m yet another kind of customer for data: a historian. Comics historians want something they can compare across time — and for 85 years, we had the number of copies in circulation to one degree or another. But I also think publishers gain a lot of information about doing their own jobs from circulation numbers. I was there when Bob Wayne came to the table where we had our first STANDARD CATALOG OF COMIC BOOKS, wanting to look up what Marvel’s sales numbers were on THUNDERCATS so he’d be better informed when DC released its own series, later that year. On Comichron, that sort of thing certainly happened a lot.
(By the way, there are about nine copies of UNCANNY X-MEN for every BATMAN copy from 1985. Or at least there were in the beginning!)
This also confirms something I wrote, that sales charts can help (mostly smaller) publishers figure out what types of comic are selling, which can factor in what types of pitches they accept to publish. I imagine it also helps creators too, who probably have a bunch of ideas and picking which one(s) to pursue can be difficult at times. What’s most likely to get accepted by publishers and do well can be helpful.
Hey John, thanks for weighing in. You and I have also had a lot of discussions about your emphasis on “copies in print” but what is really interesting is that Comics Retailer and CBG were so far ahead of the curve as there are now so many sites that cover sales and collectibles….and drive the market with things like the D’orc run and so on.
I think what Chet Krause figured out — his answer to the much-discussed question of how you get people to pay for hobby journalism — was that while you needed to cover everything, aftermarket commerce was where the money was. It was easier then for CBG to prove to an advertiser that it facilitated the sale of $300 back issue than it was to tell a publisher its coverage helped sell 100 copies of a $3 issue.
COMICS SCENE had splashy color and celebrity interviews, but it took WIZARD adding a lot of pricing coverage (and plenty of attitude) to really make a mainstream magazine work. We also saw decent runs for laser-focused things like COMICS VALUES MONTHLY, though their journalistic contribution was smaller.
I don’t think things would have turned out differently had Krause taken a different approach — as it was, an executive infamously said the internet was a fad. But the success of sites, channels, and apps causing or facilitating transactions tells me what a modern, working version would have looked like.
Comments are closed.