 by David Carter
Greetings, sales charts fans! It’s time once again to look at Image Comics’s sales figures.
Please refer to the July 2015 column for a preamble and explanation as to why sales standards for Image books are likely to be different than those for DC or Marvel.
Image shipped 47 comics in December, compared to 48 in November, 55 in October and 52 in September. They shipped 67 in December 2015.
Warning: The commentary below may contain reasoned analysis, speculation (unfounded and otherwise), opinion, and/or snark. Those looking for a more straightforward analysis are directed to John Jackson Miller’s excellent Comichron analysis, posted earlier this month over at Comichron!
Please consider the fine print at the end of the column. Thanks to Milton Griepp and ICv2.com for the permission to use their figures. An overview of ICv2.com’s estimates can be found here.
(Note that the percentage comparisons are done with total orders including reorder activity, as opposed to initial orders.)
11 - THE WALKING DEAD ($2.99)
12/2006: The Walking Dead #33  --  21,232
12/2011: The Walking Dead #92  --  31,496
12/2012: The Walking Dead #105 --  57,781
12/2013: The Walking Dead #118 --  68,020
12/2014: The Walking Dead #135 --  67,361
-----------------------------------------
12/2015: The Walking Dead #149 --  65,406 (-  1.6%)
01/2016: The Walking Dead #150 -- 156,166 (+138.8%)
02/2016: The Walking Dead #151 --  67,381 (- 59.6%)
03/2016: The Walking Dead #152 --  67,258 (-  0.2%)
04/2016: The Walking Dead #153 --  67,358 (+  0.1%)
05/2016: The Walking Dead #154 --  68,922 (+  2.3%)
06/2016: The Walking Dead #155 --  71,755 (+  4.1%)
07/2016: The Walking Dead #156 --  76,355 (+  6.4%)
08/2016: The Walking Dead #157 --  97,689 (+ 37.0%) [104,596]
09/2016: The Walking Dead #158 --  94,316 (-  9.8%)
10/2016: The Walking Dead #159 --  91,291 (-  3.2%)
11/2016: The Walking Dead #160 --  88,367 (-  3.2%)
12/2016: The Walking Dead #161 --  85,459 (-  3.3%)
-----------------
6 months: + 19.1%
1 year  : + 30.7%
2 years : + 26.9%
5 years : +171.3%
10 years: +302.5%
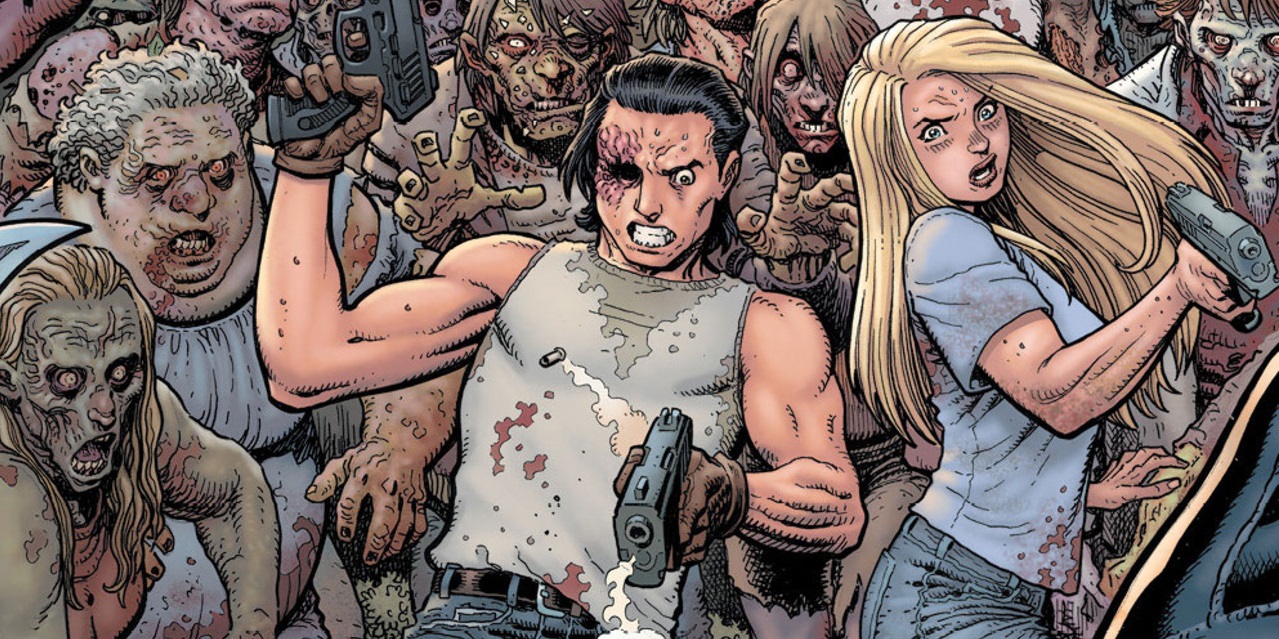
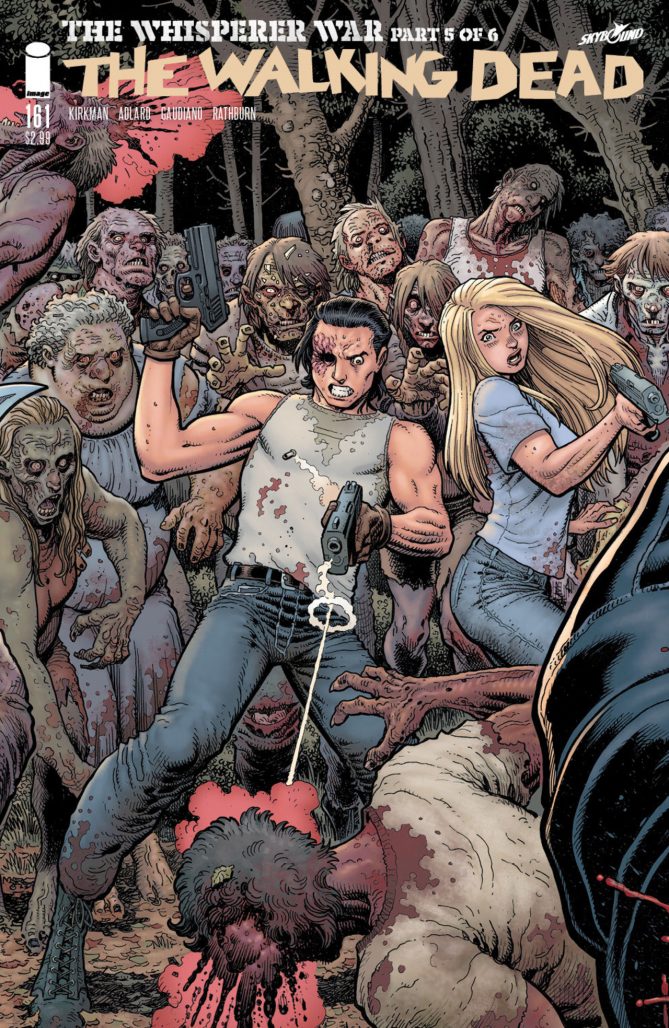
“Whisper War” and the Art Adams variant covers continue. As you can see we’re solidly in standard attrition territory, with the variant just raising the base.
—
49 - SAGA ($2.99)
12/2012: Saga #8  -- 42,324  [48,965]
12/2013: Saga #17 -- 53,264
12/2014: --
---------------------------
12/2015: Saga #32 -- 51,850 (-  5.1%)
01/2016: Saga #33 -- 50,415 (-  2.8%)
02/2016: Saga #34 -- 49,363 (-  2.1%)
03/2016: Saga #35 -- 48,845 (-  1.0%)
04/2016: Saga #36 -- 48,957 (+  0.2%)
05/2016: --
06/2016: --
07/2016: --
08/2016: Saga #37 -- 50,016 (+  2.2%)
09/2016: Saga #38 -- 48,106 (-  3.8%)
10/2016: Saga #39 -- 46,749 (-  2.8%)
11/2016: Saga #40 -- 44,944 (-  3.9%)
12/2016: Saga #41 -- 43,628 (-  2.9%)
-----------------
6 months:    n.a.
1 year  : - 15.9%
2 years :    n.a.
More fun with standard attrition.
—
74 - REBORN ($3.99)
10/2016: Reborn #1  -- 74,967
11/2016: Reborn #2  -- 41,484 (- 44.7%)
12/2016: Reborn #3  -- 36,718 (- 11.5%)
A typical third issue drop.
—
102 - SEVEN TO ETERNITY ($3.99)
09/2016: Seven to Eternity #1  -- 32,790           [39,394]
10/2016: Seven to Eternity #2  -- 27,968 (- 29.0%)
11/2016: Seven to Eternity #3  -- 26,669 (-  4.6%)
12/2016: Seven to Eternity #4  -- 25,729 (-  3.5%)
Already in standard attrition territory, which is a good sign.
—
109 - A.D.: AFTER DEATH ($5.99)
11/2016: AD After Death #1 of 3 -- 41,484
12/2016: AD After Death #2 of 3 -- 21,844 (- 28.7%)
A typical second issue drop.
—
110 - MOTOR CRUSH ($3.99)
12/2016: Motor Crush #1  -- 21,801
A decent enough debut for the new comic from the old Batgirl team.
—
132 - MOONSHINE ($2.99)
10/2016: Moonshine #1  -- 34,533           [41,012]
11/2016: Moonshine #2  -- 20,217 (- 50.7%)
12/2016: Moonshine #3  -- 17,574 (- 13.1%)
A typical third issue drop. If it sticks to standard attrition patterns, this should be fine to make a go of it (along with trade collection sales, natch).
—
133 - MONSTRESS ($3.99)
12/2015: Monstress #2  -- 23,367 (- 36.6%)
01/2016: Monstress #3  -- 22,945 (-  1.8%)
02/2016: --
03/2016: Monstress #4  -- 22,406 (-  2.3%)
04/2016: Monstress #5  -- 21,820 (-  2.6%)
05/2016: Monstress #6  -- 20,850 (-  4.4%)
06/2016: --
07/2016: --
08/2016: --
09/2016: --
10/2016: Monstress #7  -- 20,799 (-  0.2%)
11/2016: Monstress #8  -- 18,830 (-  9.5%)
12/2016: Monstress #8  -- 17,515 (-  7.0%)
-----------------
6 months:    n.a.
1 year  : - 25.0%
A couple of large percentage drops here int he second story arc are a bit concerning, but sales of the first trade collection seem to be fairly strong, so no need for worry.
—
136 - SNOTGIRL ($2.99)
07/2016: Snotgirl #1  -- 37,765
08/2016: Snotgirl #2  -- 23,830 (- 36.9%)
09/2016: Snotgirl #3  -- 20,527 (- 13.9%)
10/2016: --
11/2016: Snotgirl #4  -- 19,025 (-  7.3%)
12/2016: Snotgirl #5  -- 17,122 (- 10.0%)
Not yet stabilized. The numbers are still a good deal above 10K though, so it can still afford a bit more instability.
—
138 - SPAWN ($2.99)
12/2006: Spawn #163      -- 24,920
12/2011: Spawn #214      -- 13,017
12/2012: --
12/2013: Spawn #238      -- 12,459
12/2014: Spawn #249      -- 12,121
----------------------------------
12/2015: Spawn #259      -- 16,906 (+ 11.5%)
01/2016: --
02/2016: Spawn #260      -- 17,877 (+  5.7%)
02/2016: Spawn #261      -- 16,949 (-  5.2%)
03/2016: --
04/2016: Spawn #262      -- 18,775 (+ 10.8%)
05/2016: Spawn #263      -- 16,109 (- 14.2%)
06/2016: --
07/2016: Spawn #264      -- 17,157 (+  6.5%)
08/2016: Spawn #265      -- 15,927 (-  7.2%)
09/2016: --
10/2016: Spawn #266      -- 22,304 (+ 40.0%)
11/2016: Spawn #267      -- 16,976 (- 23.9%)
12/2016: Spawn #268      -- 16,652 (-  1.9%)
-----------------
6 months:    n.a.
1 year  : -  1.5%
2 years : + 37.4%
5 years : + 27.9%
10 years: - 33.2%
—
142 - EAST OF WEST ($3.99)
12/2013: East of West #8  -- 31,059
12/2014: East of West #16 -- 35,920
-----------------------------------
12/2015: East of West #22 -- 19,867 (-  5.7%)
12/2015: East of West #23 -- 19,184 (-  3.4%)
01/2016: East of West #24 -- 18,460 (-  3.8%)
02/2016: --
03/2016: --
04/2016: East of West #25 -- 19,297 (+  4.5%)
05/2016: East of West #26 -- 17,645 (-  8.6%)
06/2016: East of West #27 -- 18,146 (+  2.8%)
07/2016: East of West #28 -- 17,019 (-  6.2%)
08/2016: East of West #29 -- 16,613 (-  2.4%)
09/2016: --
10/2016: --
11/2016: --
12/2016: East of West #30 -- 15,635 (-  5.9%)
-----------------
6 months: - 13.8%
1 year  : - 21.3%
2 years : - 56.5%
Back from break with a biggish percentage drop for this stage of the game.
—
143 - DESCENDER ($2.99)
12/2015: Descender #8  -- 20,999 (- 11.3%)
01/2016: Descender #9  -- 20,017 (-  4.7%)
02/2016: Descender #10 -- 19,642 (-  3.4%)
03/2016: Descender #11 -- 18,842 (-  2.6%)
04/2016: --
05/2016: --
06/2016: Descender #12 -- 19,782 (+  5.0%)
07/2016: Descender #13 -- 17,783 (- 10.1%)
08/2016: Descender #14 -- 17,296 (-  2.7%)
09/2016: Descender #15 -- 16,386 (-  5.3%)
10/2016: Descender #16 -- 15,963 (-  2.6%)
11/2016: --
12/2016: Descender #17 -- 15,296 (-  4.2%)
-----------------
6 months: - 22.7%
1 year  : - 27.2%
—
147 - THE WICKED + THE DIVINE ($3.50)
12/2014: Wicked + Divine #6  -- 22,159
--------------------------------------
12/2015: Wicked + Divine #17 -- 18,479 (-  4.6%)
01/2016: --
02/2016: --
03/2016: --
04/2016: Wicked + Divine #18 -- 17,722 (-  4.1%)
05/2016: Wicked + Divine #19 -- 16,929 (-  4.4%)
06/2016: Wicked + Divine #20 -- 17,831 (+  5.3%)
07/2016: Wicked + Divine #21 -- 16,283 (-  8.7%)
08/2016: Wicked + Divine #22 -- 15,969 (-  1.9%)
09/2016: W + D 1831 one-shot -- 16,408 (+  2.7%)
10/2016: --
11/2016: Wicked + Divine #23 -- 15,238 (-  7.1%)
12/2016: Wicked + Divine #24 -- 14,666 (-  3.8%)
-----------------
6 months: - 17.7%
1 year  : - 20.6%
2 years : - 33.8%
—
178 - BLACK SCIENCE ($3.99)
12/2013: Black Science #2  -- 20,151
12/2014: Black Science #11 -- 19,688
------------------------------------
12/2015: Black Science #18 -- 14,465 (-  4.2%)
01/2016: Black Science #19 -- 13,966 (-  3.4%)
02/2016: Black Science #20 -- 13,251 (-  5.1%)
03/2016: Black Science #21 -- 13,092 (-  1.2%)
04/2016: --
05/2016: --
06/2016: --
07/2016: Black Science #22 -- 12,829 (-  2.0%)
08/2016: Black Science #23 -- 12,466 (-  2.8%)
09/2016: Black Science #24 -- 11,810 (-  5.3%)
10/2016: Black Science #25 -- 11,425 (-  3.3%)
11/2016: --
12/2016: Black Science #26 -- 11,041 (-  3.4%)
-----------------
6 months:    n.a.
1 year  : - 23.7%
2 years : - 43.9%
—
186 - ROCKSTARS ($3.99)
12/2016: Rockstars #1  -- 10,048
New period mystery series from Joe Harris and Megan Hutchison.
—
202 - DEADLY CLASS ($3.99)
12/2014: --
-----------------------------------
12/2015: Deadly Class #17 -- 11,035 (-  3.2%)
01/2016: Deadly Class #18 -- 10,485 (-  5.0%)
02/2016: --
03/2016: Deadly Class #19 -- 10,440 (-  0.4%)
04/2016: Deadly Class #20 -- 10,366 (-  0.7%)
05/2016: --
06/2016: Deadly Class #21 -- 10,892 (+  5.1%)
07/2016: --
08/2016: --
09/2016: Deadly Class #22 --  9,865 (-  9.4%)
10/2016: --
11/2016: Deadly Class #23 --  9,215 (-  6.6%)
11/2016: Deadly Class #24 --  8,757 (-  5.0%)
12/2016: Deadly Class #25 --  8,567 (-  2.2%)
-----------------
6 months: - 21.3%
1 year  : - 22.4%
2 years :    n.a.
—
208 - THE FIX ($3.99)
04/2016: The Fix #1  -- 14,959
05/2016: The Fix #2  -- 10,433 (- 30.3%)
06/2016: The Fix #3  -- 11,128 (+  6.7%)
07/2016: The Fix #4  -- 11,115 (-  0.1%)
08/2016: --
09/2016: The Fix #5  -- 10,463 (-  5.9%)
10/2016: The Fix #6  --  9,425 (-  9.9%)
11/2016: --
12/2016: The Fix #7  --  8,246 (- 12.5%)
-----------------
6 months: - 25.9%
—
209 - GREEN VALLEY ($2.99)
10/2016: Green Valley #1 of 9 -- 16,091
11/2016: Green Valley #2 of 9 --  9,713 (- 39.6%)
12/2016: Green Valley #3 of 9 --  8,219 (- 15.4%)
—
217 - VIOLENT LOVE ($3.99)
11/2016: Violent Love #1  -- 15,671
12/2016: Violent Love #2  --  7,836 (- 50.0%)
The first issue was returnable, while this issue was not. Both have variant covers.
—
222 - CANNIBAL ($3.99)
10/2016: Cannibal #1  -- 17,172
11/2016: Cannibal #2  --  9,582 (- 44.2%)
12/2016: Cannibal #3  --  7,340 (- 23.4%)
—
230 - NAILBITER ($2.99)
12/2014: Nailbiter #8  -- 12,096
--------------------------------
12/2015: Nailbiter #18 --  8,853 (-  5.1%)
01/2016: Nailbiter #19 --  8,464 (-  4.4%)
02/2016: Nailbiter #20 --  8,368 (-  1.1%)
03/2016: --
04/2016: --
05/2016: Nailbiter #21 --  8,196 (-  2.1%)
06/2016: Nailbiter #22 --  8,477 (+  3.4%)
07/2016: Nailbiter #23 --  7,938 (-  6.4%)
08/2016: Nailbiter #24 --  7,780 (-  2.0%)
09/2016: Nailbiter #25 --  7,474 (-  3.9%)
10/2016: --
11/2016: Nailbiter #26 --  7,239 (-  3.1%)
12/2016: Nailbiter #27 --  6,989 (-  3.5%)
-----------------
6 months: - 17.6%
1 year  : - 21.1%
2 years : - 42.2%
Standard attrition appears to be the rule for this title’s final arc.
—
248 - ECLIPSE ($3.99)
09/2016: Eclipse #1  -- 12,375
10/2016: Eclipse #2  --  7,764 (- 37.3%)
11/2016: Eclipse #3  --  6,818 (- 12.2%)
12/2016: Eclipse #4  --  5,762 (- 15.5%)
252 - GLITTERBOMB ($3.99)
09/2016: Glitterbomb #1  -- 14,105
10/2016: Glitterbomb #2  --  8,160 (- 42.1%)
11/2016: Glitterbomb #3  --  6,742 (- 17.4%)
12/2016: Glitterbomb #4  --  5,530 (- 18.0%)
257 - HADRIAN'S WALL ($3.99)
09/2016: Hadrian's Wall #1  -- 10,038
10/2016: Hadrian's Wall #2  --  6,791 (- 32.3%)
11/2016: Hadrian's Wall #3  --  5,832 (- 14.1%)
12/2016: Hadrian's Wall #4  --  5,265 (-  9.7%)
269 - LAKE OF FIRE ($3.99)
08/2016: Lake of Fire #1 of 5 -- 9,142
09/2016: Lake of Fire #2 of 5 -- 6,637 (- 27.4%)
10/2016: Lake of Fire #3 of 5 -- 5,738 (- 13.5%)
11/2016: Lake of Fire #4 of 5 -- 5,258 (-  8.4%)
12/2016: Lake of Fire #5 of 5 -- 4,967 (-  5.5%)
Four titles with the proof that while a consistent schedule may be necessary for strong sales, it is not sufficient.
—
271 - REVIVAL ($3.99)
12/2012: --
12/2013: Revival #16 -- 11,065
12/2014: Revival #26 --  8,696
------------------------------
12/2015: Revival #35 --  6,510 (-  5.9%)
01/2016: Revival #36 --  6,182 (-  5.0%)
02/2016: --
03/2016: Revival #37 --  5,987 (-  3.2%)
03/2016: Revival #38 --  5,826 (-  2.7%)
04/2016: --
05/2016: Revival #39 --  5,826 (-  1.1%)
06/2016: Revival #40 --  6,004 (+  4.2%)
07/2016: Revival #41 --  5,527 (-  7.9%)
08/2016: --
09/2016: Revival #42 --  5,434 (-  1.7%)
10/2016: Revival #43 --  5,130 (-  5.6%)
11/2016: Revival #44 --  5,001 (-  2.5%)
12/2016: Revival #45 --  4,841 (-  3.2%)
-----------------
6 months: - 19.4%
1 year  : - 25.6%
2 years : - 44.3%
Ending with issue #47.
—
273 - WAYWARD ($3.50)
12/2014: Wayward #5  -- 10,009
------------------------------
12/2015: Wayward #12 --  7,015 (- 14.5%)
01/2016: Wayward #13 --  6,589 (-  6.1%)
02/2016: Wayward #14 --  6,397 (-  2.9%)
03/2016: Wayward #15 --  6,089 (-  4.8%)
04/2016: --
05/2016: --
06/2016: --
07/2016: --
08/2016: --
09/2016: Wayward #16 --  6,165 (+  1.2%)
10/2016: Wayward #17 --  5,431 (- 11.9%)
11/2016: Wayward #18 --  5,109 (-  5.9%)
12/2016: Wayward #19 --  4,771 (-  6.6%)
-----------------
6 months:    n.a.
1 year  : - 32.0%
2 years : - 52.3%
—
278 - MAYDAY ($3.99)
11/2016: Mayday #1 of 5 -- 15,671
12/2016: Mayday #2 of 5 --  4,677 (- 56.6%)
Oh when will creators stop giving their comics these sorts of titles…?
—
292 - SURGEON X ($3.99)
09/2016: Surgeon X #1  -- 14,866
10/2016: Surgeon X #2  --  8,180 (- 45.0%)
11/2016: Surgeon X #3  --  5,347 (- 34.6%)
12/2016: Surgeon X #4  --  4,232 (- 20.9%)
Acting just like a Vertigo title.
—
299 - ISLAND ($7.99)
12/2015: Island #5  --  6,422 (- 15.0%)
01/2016: Island #6  --  5,764 (- 10.2%)
02/2016: --
03/2016: --
04/2016: --
05/2016: Island #7  --  5,503 (-  4.5%)
06/2016: Island #8  --  5,849 (+  6.3%)
07/2016: Island #9  --  ????? (< 5,069)
08/2016: Island #10 --  ????? (< 5,497)
09/2016: Island #11 --  4,239
10/2016: --
11/2016: Island #12 --  ????? (< 4,799)
12/2016: Island #13 --  3,957
-----------------
6 months: - 32.3%
1 year  : - 38.4%
The floor of the Top 300 drops low enough in December for Island to pop its head up.
—
Image titles shipping but not making the Top 300 in November (cutoff at 3,954) include: 3 Floyds Alpha King, Cyber Force, Demonic, Drifter, Elephantmen, Horizon, The Hunt, Invisible Republic, No Mercy, Peter Panzerfaust, Ringside, Romulus, Savage Dragon, Sex, Shutter, Southern Cross.
Note that this doesn’t necessarily mean that any of them are in danger of being cancelled; there are many reasons that the creators of these books may desire to keep them going.
The Fine Print (Disclaimers, et cetera)
The numbers above are estimates for comic-book sales in the North American direct market, as calculated by ICv2.com according to the chart and index information provided by Diamond Comic Distributors.
ICv2.com’s estimates are somewhat lower than the actual numbers, but they are consistent from month to month, so the trends they show are fairly accurate. Since it’s a “month-to-month” column, the comments, unless otherwise noted, are on the most recent month.
Bear in mind that the figures measure sales of physical comics to retailers, not customers. Also, these numbers do not include sales to bookstores, newsstands, other mass-market retail chains or the United Kingdom. Re-orders are included, so long as they either reached stores in a book’s initial calendar month of release or were strong enough to make the chart again in a subsequent month. Keep in mind that sales for some titles may include incentives to acquire variants and not every unit sold is necessarily even intended to be sold to a customer.
If additional copies of an issue did appear on the chart after a book’s initial calendar month of release, you can see the total number of copies sold in brackets behind those issues (e.g. “[36,599]”). Should more than one issue have shipped in a month which is relevant for one of the long-term comparisons, the average between them will be used.
Titles which are returnable have their numbers artificially adjusted down by Diamond. To make up for that this column increases the reported numbers for those titles by 10%. Which is likely also wrong, but it’s a different and likely less wrong kind of wrong, and experience has shown that this leads to sales figures which are more consistent.
Image is not a normal comics publisher, and the typical metrics for sales success may not apply. For many titles, collection sales tend to be a significant factor, so the numbers for those books should be taken with a grain of salt as well.
Please keep in mind that raw sales numbers do not tell us about how profitable a book is for a publisher or for the creators.
Above all, do not allow sales numbers to dictate your purchasing and enjoyment of a particular comic. If you enjoy reading a comic series then go right on buying and reading that comic, no matter what the sales figures say.
** Two asterisks after a given month in the average charts mean that one or more periodical release did not make the Top 300 chart in that month. In those cases, it’s assumed that said releases sold as many units as the No. 300 comic on the chart for that month for the purposes of the chart, although its actual sales are likely to be less than that.
Opinions expressed in this column are mine alone, and do not necessarily reflect those of my employer, Heidi MacDonald or anyone at The Comics Beat, the National Christmas Tree Association, or my former neighbor’s dog Miles.
The author of this column does weekly snapshots of Amazon comic sales charts at http://yetanothercomicsblog.blogspot.com/ and tweets about comics and related subjects on Twitter at @davereadscomics (PM me there if you need to contact me).
As always, we welcome your comments and corrections below. Please try to keep things civilized.



Violent Love #2 is returnable. So is #3.
A correction: The sales on the 1st issue of AD After Death were 30,626 in November. (The percentage drop from #1 to #2 is correct). I’m not sure how I entered the 41,484 (which was the sales of Reborn #2 last month…) in there…
Man, it really is frustrating to see such a large drop for good, quality comics with great stories like Nailbiter, Hadrian’s Wall etc. The speculators are out in force and are obviously buying the number 1s but not continuing with the book. I hate seeing this! Memories of the 90s are rampant.
Are you sure it’s speculators boosting the #1’s?
As a reader, I buy a lot of Image #1’s, but a lot less #2’s. Has nothing to do with speculating on value and everything to do with not thinking most of the new series are books I want to keep buying.
I imagine for retailers they order big on the #1 in case it’s the new hot series that regulars eat up and then brings in non-regular readers – Saga, Sex Criminals etc.
Looking at the numbers for Nailbiters and Hadrian’s Wall in particular I can’t see signs of a speculators bump there – losing a third of the audience for #2 is a standard drop not just for comics but tv shows too.
Comments are closed.