Tag: Sales Charts
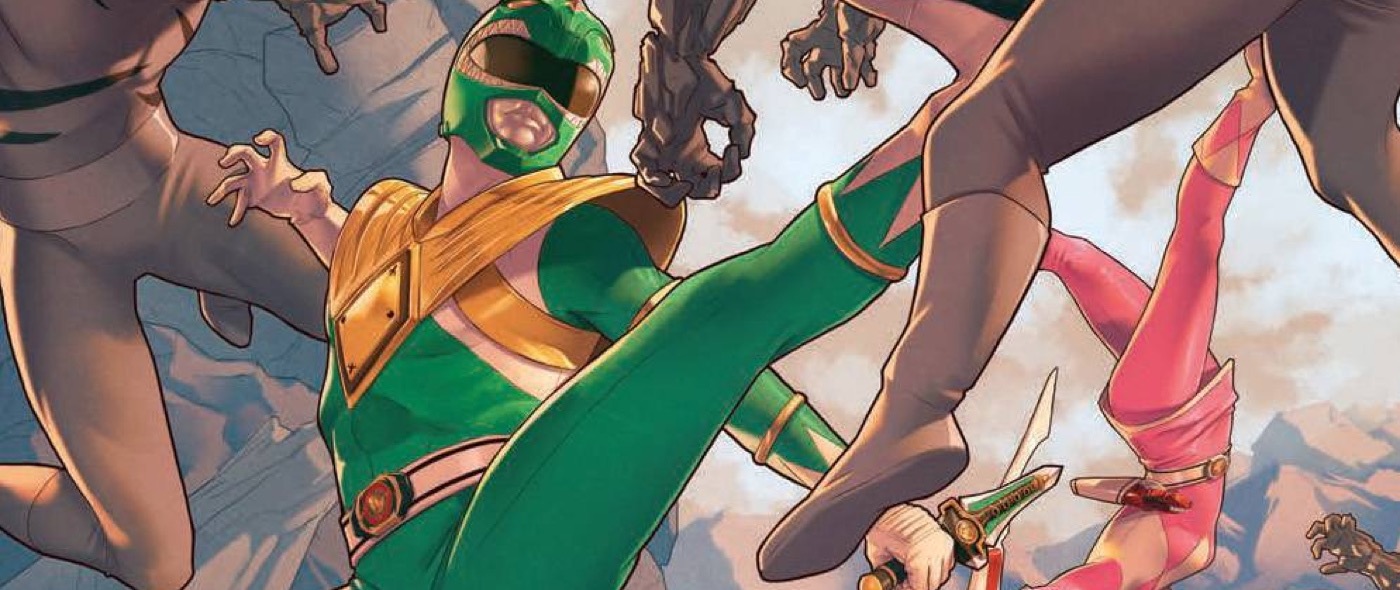
Batman and Mighty Morphin’ Power Rangers lead March Sales
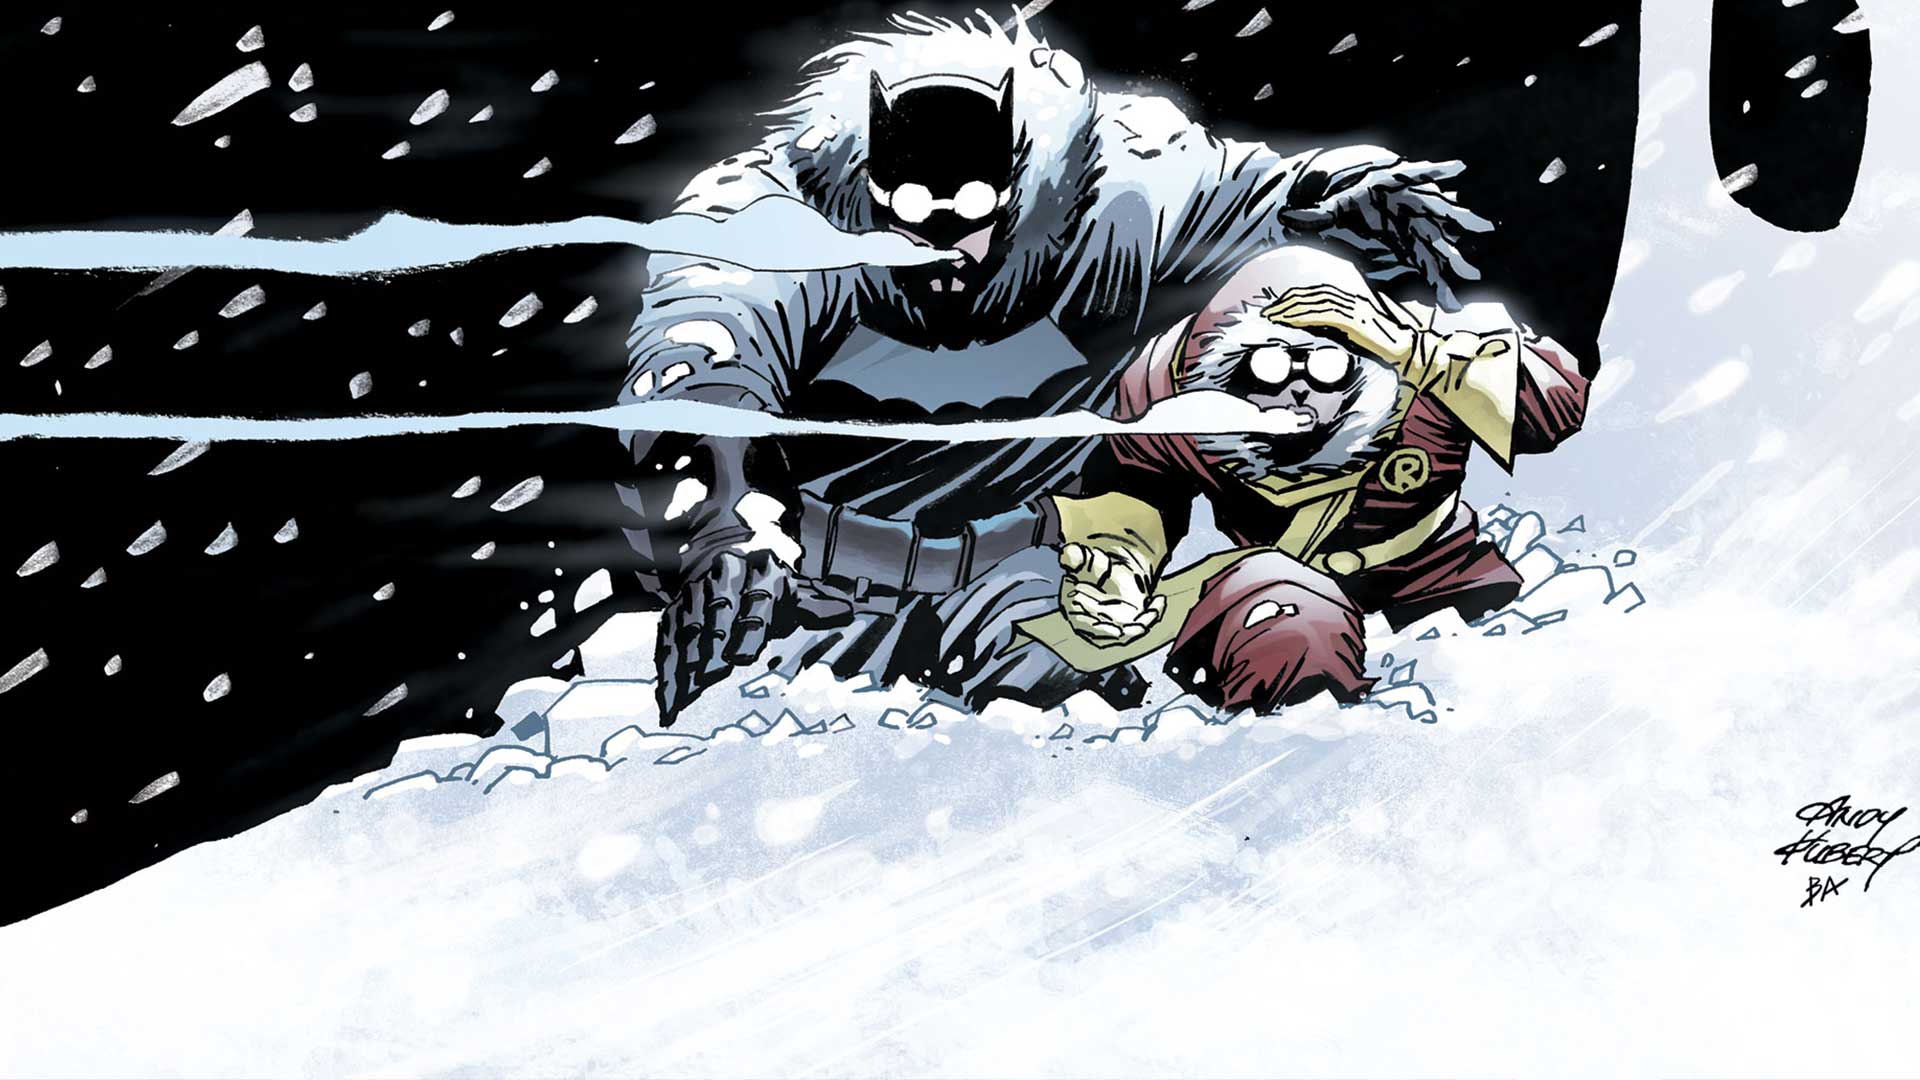
DC Comics Month-to Month Sales February 2016: Late the Dark Knights Fall!
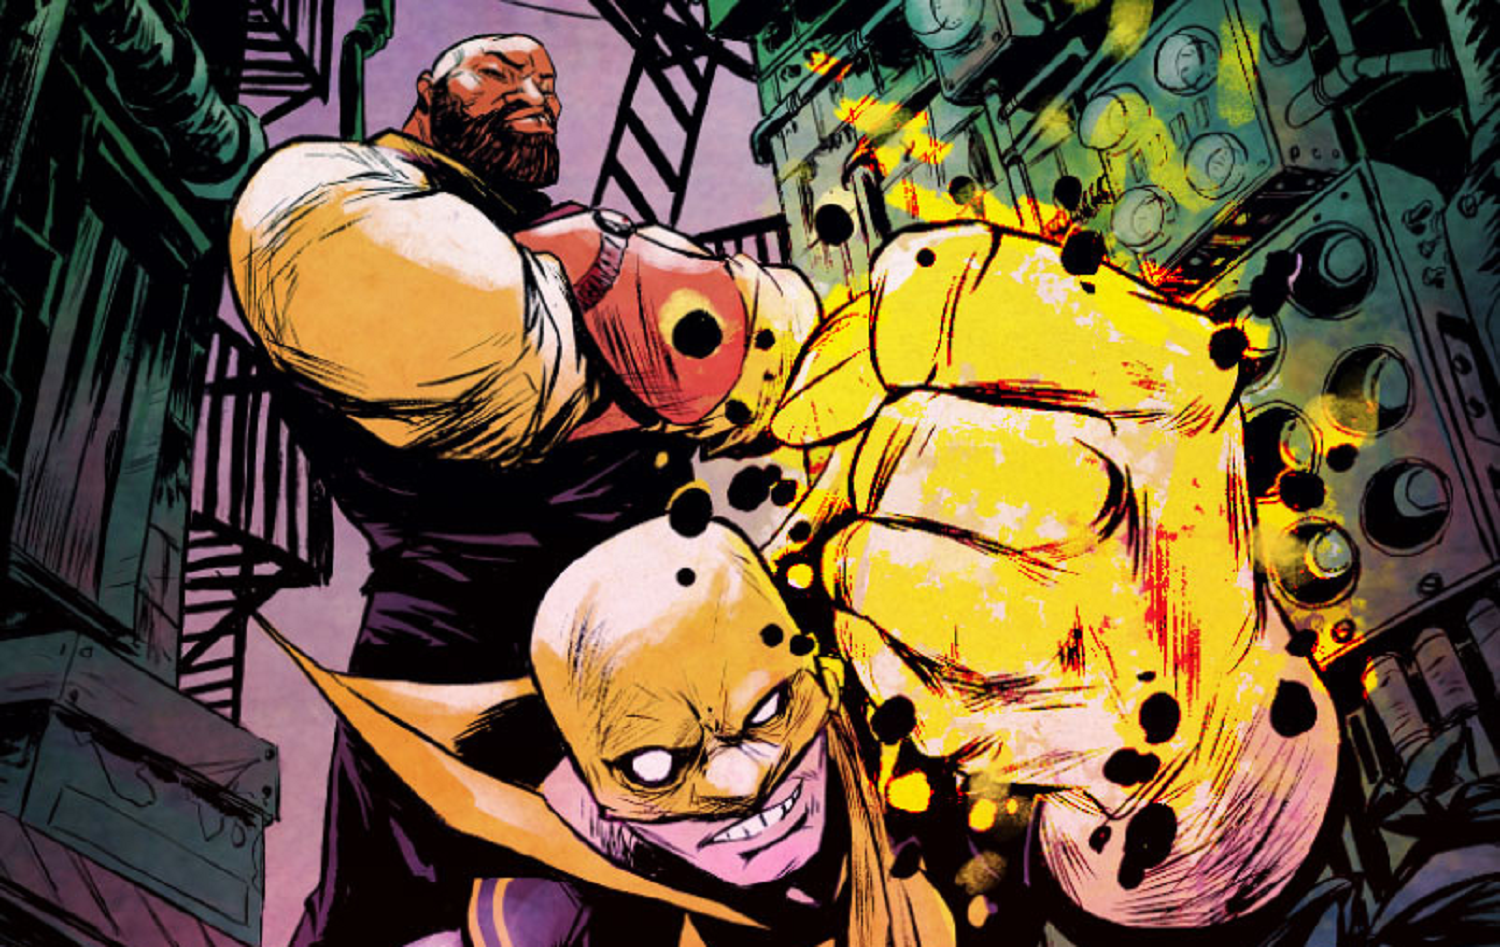
Marvel Month-to-Month Sales February 2016: The Marvel Universe Caught a Cold!
Image Comics Sales Chart: Just how many books has the Walking Dead sold?
February sales numbers are out and if you’re the worrying kind, plenty of fodder
Sales Chart: Scholastic was the #1 graphic novel publisher in bookstores and more from...
Image Comics Month-to-Month Sales: January 2016 – Point of Know Return
Surprise! Raina Telgemeier tops indie bookstore graphic novels sales
Marvel Month-to-Month Sales January 2016: “LOOK AT THE STARS! (WHILE THE GROUND IS SHAKING)”
DC Comics Month-to Month Sales: January 2016 – The Adjustment Bureau
Greetings, sales charts fans! It's time once again to look at DC's sales figures.
Things were bad for DC in January. How bad? With records going back to March 2003, DC had its second worst average sales on record of 21,845, just barely beating the March 2009 low point of 21,792. The Vertigo line had its lowest average sales on record by far: 6,832, beating the previous average low of 7,055 in March 2015. And the median sales for both lines was even lower: 24,624 & 5,802 respectively.
DC shipped twenty fewer comics in January as compared to December (74 versus 94). Two titles not shipping in January were two of DC's top sellers, Dark Knight III and Justice League. They moved a total estimated 1,616,524 comic units in January, compared to 2,640,519 in December, a difference of over a million units!
