
![]()
By Brian Hibbs
 “There are three kinds of lies: Lies, Damned Lies, and Statistics”
I am fundamentally shocked that this is the fourteenth annual report of something that is hard to exactly perceive and understand: the size and shape of the sales of graphic novels and trade paperbacks through the book store market, as seen through the prism of BookScan.
Some preamble:
“Direct Market” stores (also known as “your Local Comics Shop”) buy much of their material for resale from Diamond Comics Distributors (though, not, by any means, all of the material your LCS has for sale – many DM stores are also buying from book-market wholesalers, or directly from publishers). While a number of DM stores have Point-of-Sales (POS) systems, because our market buys non-returnable, what we track in our side of the industry is what sells-in to the store, not what sells-through to the eventual consumer. In a very real way, this means that the DM store owner is the actual customer of the publisher, as opposed to the end consumer.
The bookstore market, however, buys their material semi-returnable, where they can send back some portion of titles that don’t sell (but not, usually, all unsold product). Because of this, sell-through is the data that is tracked and trended. Bookstores that have POS systems are able to report their sales to BookScan, a subsidiary of Nielsen.
Each week, BookScan generates a series of reports detailing the specific sales to consumers through its client stores. I have several well trained spies who have, for several years, provided me with access to the BookScan reports at the end of each year.
If you go over here you can find a copy of the 2016 BookScan Top 750 year end report for the comics category.
(For points of comparison, try these links [I can’t guarantee these links will always work, this being the internet and all]: [Editor’s note: here’s the archive page in progress – all pages will be updated so check back.]
For the last ten years, what I’ve been given is the actual end-of-the-year total report, as opposed to 2003-2005 where I only had the report of the final week of the year. The effective difference for a casual chart reader is probably very little, but it does change some of the value in the percentage changes year-to-year. Please bear it in mind when comparing this year’s report to the previous ones – comparing 2016 to 2006-2015 is probably as close to apples-to-apples as it can get, as is 2003-2005, but comparing the ’06-‘16 data to ’03-’05 isn’t going to be necessarily as valuable, and any analysis I can make of comparative growth is going to be off by some factor, possibly a significant one.
The biggest and most obvious difference when doing straight comparisons will be in the lower ends of the chart. This year, the “worst selling” book in the Top 750 is just over 4000 copies. (up from about 3600 copies in 2015, 2900 copies in 2014 and 2600 copies in 2013) In ’03-‘05 there would be many items that didn’t have YTD sales in anything like that amount.
Also of major note is that starting in 2007, I have had the full and entire BookScan listing, down to books that have only one copy sold YTD. However, I’m not going to provide that entire list because that’s too much data, even for a data-junkie like myself. I’ve cut the list off at 750 items because that’s what we’ve historically reported. Still, I have the deeper data, and I’ll summarize it as we go along. As long as I continue to get that much data going forward, I should be able to tell you a few things about “The Long Tail”. In 2016, I possess data on just over 21,000 items! We’ll talk more about this later in some depth.
This is not a list of every book that sold through every book store – the report is limited to those stores that report to BookScan. According to BookScan, more than 7500 venues report to them, but this still leaves many venues that don’t.
Neilsen claimed in 2013 that approximately 85% of retail, physical book sales are tracked through them, though this number appears very much in doubt as an actionable percentage for any specific individual book. A quick internet search can find any number of cases of authors saying that BookScan numbers show half or less of their royalty statements. There’s some really excellent discussion on why and by how much BookScan numbers might be off right here.
BookScan says “Barnes & Noble, Amazon, Costco, General Independents, Hastings, Target, BJ’s, K-Mart, Hudson Group, Meijers, Follett Books, Books-A-Million, CEO Read, Powells, Toys R Us, Shoprite, SuperValu, Sam’s Club and Walmart are among our many data providers.” Walmart was only added to BookScan in 2013
What sales do BookScan not track? Among others, this would include libraries, schools, specialty stores (like comic book stores!) and book clubs and fairs. BookScan does not track most sales at independent bookstores. For many books those are very very important sales channels, and thus, BookScan under-reports by some potentially significant degree, and don’t, in any way, represent all physical book sales or even all “book stores” selling comic book material.
 There’s also a certain amount of miscategorization going on. As an example, for the last fourteen years the prose novel Bloody Crown of Conan appears on my list, while other books (see; Dork Diaries in a few paragraphs) might appear one year, and disappear another. I do not know what the actual extent of miscategorization might be and how it would impact any of the general data analysis! There are simply too many potential data points to possibly connect them all together in the time I have to assemble this column.
I’ve done the best I can to try and root out any items “of significance” that should be on the chart that I’m given, but are not – for example, I have to have The Complete Persepolis and Maus manually pulled for me every year because they are actually classified as (I believe) “Memoir” rather than comics. Because this relies on me thinking of things to get them on to the list – each item apparently only has one classification – there’s almost certainly comics material missing that I didn’t catch. However, that doesn’t mean that I didn’t miss one or more books that didn’t show up on the reports; I am certain I missed something. If you can think of a book I might have missed, please email me, and I’ll try to track down the sales for it, and update my listings for the future!
Either way, what I’m trying to get across to you is that this really is entirely unreliable data in terms of the absolute and total number of books sold, and is only able to give the broadest possible outline of what’s happening in book stores, based upon the data-set that I’m being given, which is in no way comprehensive. I still think that’s better than having no information, so I persevere in writing this each year.
As always, I strongly encourage you to look at the BookScan numbers on your own and make your own conclusions – I’m trying to be balanced and fair, but, of course, I have huge bookshelves worth of biases I’m dragging around with me, and your analysis might be more correct than my own. Every year I write this and hope and pray that we’d get three or four competing analyses of the data dump, but that never happens. Maybe this year? (probably not)
Again, I want to stress that I’m doing my primary analysis on the Top 750 items: the reason for this is that is all that I was able to get in the first four years of this analysis, and otherwise the percentage changes I’m discussing will be even more wrong than they would be otherwise. The Top 750 represents more than half of the total of the full list, and has consistently for years. While there are significant sales below the Top 750, the Top 750 probably represents the majority of items you’d be able to “easily” find on the shelf of a bookstore in America. I’d love to analyze the full “long tail” list, but I’m afraid that this might take these little essays to triple their current size, and keeping your attention just through this seems hard enough to me! Maybe if someone paid me by the word…
Finally, it is probably worth mentioning that although I’m analyzing both units and dollars, those dollars are what they would have been at full retail. BookScan does not report on the price that a book actually sold for, so the extrapolation of dollars that I made could be dramatically overstated. More than could be: it probably is because Amazon sells so many books, often at crazy steep discounts.
One of the things I really never talk about is how I get this data each year. I certainly don’t have a BookScan account (they’re pretty expensive!), so I am dependent on leaks from industry sources. But this means that the methodology with which the data was generated may actually be very different from year to year. The thing is, since I don’t generate these, BookScan methodology is largely a Black Box to me. For a guy who writes these reports for 14 (!) years, I have only really a passing knowledge of how things work. I am learning, slowly, though!
Here’s where we learn a little bit about the Book Industry Standards and Communications (or “BISAC”) codes. It turns out that the publishers assign them, themselves, and that publishers are allowed to assign up to four different BISAC codes per item. For example: “Diary of a Wimpy Kid” is classified as “Juvenile Fiction: Humorous Stories”; “Juvenile Fiction: Comics & Graphic Novels: General”; and “Juvenile Fiction: Social Issues: General”. But the kicker is that BookScan reports will only spit out for the first BISAC listed for any given book. That is why “Diary of a Wimpy Kid” never ever shows on any of our reports, because the “comics” designation of the BISAC is listed second for that series! Conceptually I could also ask for “Juvenile Fiction: Humorous Stories” report, too – but that’s going to have thousands and thousands of prose-only, not-even-slightly-comics items on it. This is also why I have to manually ask for titles like “Maus” or “Persepolis” or “Understanding Comics” each and every year – not because they don’t contain the BISAC for comics (“CGN00xxxx”, for the record), but because that BISAC isn’t listed first!
Either way, because the exact methodology from my leakers is slightly different every year, sometimes we get weird spikes and discrepancies. For example, as far as I can tell, in 2014 and prior we were always getting every book that sold one copy anywhere, then in 2015, and slightly in 2016, we’re getting a lightly edited list that only listed in-print books from some (but not all!) publishers. I put an asterisk on 2015 because it was missing several thousand data points… But those very strongly appeared to be datapoints that may not materially affect the actual bottom-line health of the charts. Either way, I really must once again urge you to treat every datapoint presented here as only part of the possible picture!
*********
OK, that’s the boilerplate and background out of the way, let’s start looking at the data.
2016 Overview
 As always, I continue to cut out anything that clearly wasn’t a “comic” (though such definitions are sometimes difficult to make). For instance, the #3 book of the year – The “Dork Diaries” volumes (and more on that below) are not really a “comic” – they have words, they have pictures, but they don’t work together in the way I’d think we’d commonly agree is “comics”. However, it’s just close enough that I decided to keep it. Much less controversial (I’d imagine) is my decision to remove prose-driven books like DK Publishing’s “Marvel Encyclopedia” (38,319 copies sold in 2016), which, while nominally about comics or comics culture, is factually an encyclopedic prose book with pictures. Or “Dork Diaries” OMG! All About Me! Diary” (27,650 sold in 2016) which is actually a branded write-in Journal, or “DC Super Heroes: My First Book of Girl Power” (26,212 copies sold in 2016) where the Amazon “Look Inside” clearly shows is an illustrated reader for 2nd graders. There is clearly an enormous market for this kind of material – in fact, in many cases a larger market than for the actual comics themselves – it just isn’t the “comics” market, as I would define it.
In all, I removed more than 37 items from the Top 750 that didn’t match my personal definition of “comics”, to make room for 37 items that I think are comics. However, if there was a legitimate question about it, like our #3 book, I erred on the side of keeping it.
Here’s the big picture for the Top 750 in 2016:
| Year | Total Unit | Growth | Total Dollars | Growth |
| 2003 | 5,495,584 | ——- | $66,729,053 | ——– |
| 2004 | 6,071,123 | 10.5% | $67,783,487 | 1.6% |
| 2005 | 7,007,345 | 15.4% | $75,459,669 | 11.3% |
| 2006 | 8,395,195 | 19.8% | $90,411,902 | 19.8% |
| 2007 | 8,584,317 | 2.3% | $95,174,425 | 5.3% |
| 2008 | 8,334,276 | -2.9% | $101,361,173 | 6.5% |
| 2009 | 7,634,453 | -8.4% | $93,216,014 | -8.0% |
| 2010 | 6,414,336 | -15.9% | $85,266,166 | -8.5% |
| 2011 | 5,696,163 | -11.2% | $79,961,951 | -6.2% |
| 2012 | 5,438,329 | -4.53% | $89,918,354 | 12.45% |
| 2013 | 5,654,351 | 3.97% | $96,062,709 | 6.83% |
| 2014 | 6,659,031 | 17.77% | $112,768,709 | 17.39% |
| 2015 | 8,762,983 | 31.60% | $141,226,518 | 25.24% |
| 2016 | 9,967,907 | 13.75% | $159,510,075 | 12.95% |
So, yeah, that’s another year of amazing growth in 2016, and it brings the Top 750 to the highest numbers it has ever charted in the history of this exercise – Now topping over ten million graphic novels sold! Amazing performance, and hopefully we can now stop talking forever about silliness like “the death of comics” or “the death of print”. Both are doing just fine!
The trend for print books in general (not just looking at comics) through BookScan appears to be a general growth of 3.3% in 2016 — which continues the three-year trend of comics-material being far stronger than the curve.
(For what it is worth, overall book sales through Diamond in the Direct Market appear to be up by just 1.2%, so the book market continues to grow significantly faster. Diamond only directly reports the Top 300 best-sellers each month, and those Top 300s in the DM sum up to $93.72m. Deep deep into the micro, my own individual sales were up 7.76% in 2016.)
As I noted, I primarily write about the top 750 because a) that’s all the data I was initially leaked back in 2003, b) it’s a “manageable” chunk of data, and c) “as above, so below” – the top 750 represents about half of sales. However, since 2007, I’ve received the “entire” database, which now gives us a solid eight years of data to track. We refer to this as “the Long Tail”. Here’s what the sales of all comics sales BookScan tracks in this category looks like – but, seriously, let me remind you that the dataset changes enough each year this is a fairly meaningless set of comparisons! Prior to 2013, this didn’t include Walmart, for just one example.
| Year | # of listed items | Percent Change | Total Unit Sold | Percent Change | Total Dollars Sold | Percent Change | Av. Sale per title | Av $ per title |
| 2007 | 13,181 | —– | 15,386,549 | —– | $183,066,142 | —– | 1167 | $13,888.64 |
| 2008 | 17,571 | 24.98% | 15,541,769 | 1.00% | $199,033,741 | 8.02% | 885 | $11,327.40 |
| 2009 | 19,692 | 12.07% | 14,095,145 | -9.31% | $189,033,736 | -5.02% | 716 | $9,599.52 |
| 2010 | 21,993 | 11.68% | 12,130,232 | -13.94% | $172,435,244 | -8.78% | 552 | $7,840.32 |
| 2011 | 23,945 | 8.88% | 11,692,058 | -3.61% | $175,634,490 | 1.86% | 488 | $7,334.91 |
| 2012 | 23,365 | -2.42% | 9,562,236 | -18.22% | $164,415,366 | -6.39% | 409 | $7,036.82 |
| 2013 | 24,492 | 4.82% | 10,153,628 | 6.18% | $176,419,370 | 7.30% | 415 | $7,325.63 |
| 2014 | 26,976 | 10.14% | 11,820,324 | 16.41% | $207,598,355 | 17.67% | 438 | $7,695.56 |
| 2015* | 22,431 | -16.85% | 15,269,550 | 29.18% | $259,807,532 | 25.15% | 681 | $11,582.52 |
| 2016 | 21,295 | -5.06% | 17,302,891 | 13.32% | $293,583,180 | 13.00% | 813 | $13,786.48 |
There are just over 6000 items that disappeared between BookScan 2015 and 2016 (see above for how I get this data). In 2015 those books sold nearly 645k copies for $13.3 million. But even without those titles we’ve still got amazing and solid growth right down the line, at the top and down at the bottom.
Let’s take a look at the Top 20 best-selling items on the 2016 chart; it looks like this (I apologize for the truncated titles, it is baked in):
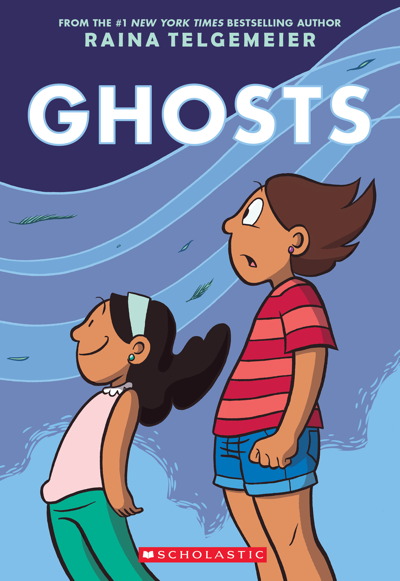
| 213,235 | GHOSTS |
| 212,852 | DRAMA |
| 208,033 | DORK DIARIES 10: TALES FROM A |
| 188,861 | SMILE |
| 166,124 | SISTERS |
| 162,118 | KRISTY’S GREAT IDEA: FULL-COLO |
| 142,805 | CLAUDIA AND MEAN JANINE |
| 130,907 | THE KILLING JOKE |
| 126,825 | THE MISADVENTURES OF MAX CRUMB |
| 116,560 | THE TRUTH ABOUT STACEY: FULL-C |
| 105,510 | MARY ANNE SAVES THE DAY: FULL- |
| 99,206 | DANTDM: TRAYAURUS AND THE ENCH |
| 97,948 | DORK DIARIES 1: TALES FROM A N |
| 87,717 | DORK DIARIES 9: TALES FROM A N |
| 84,856 | STAR WARS: THE ORIGINAL TRILOG |
| 82,388 | FIRELIGHT |
| 77,669 | ROLLER GIRL |
| 76,733 | BIG NATE: THUNKA, THUNKA, THUN |
| 71,741 | THE WALKING DEAD COMPENDIUM, V |
| 66,714 | EL DEAFO |
Clearly, the first thing you can’t help but notice is that eighteen of the Top Twenty are books aimed at younger readers – it was just fifteen last year. The second thing you can’t help but notice is the complete domination of the Top 20 by Raina Telgemeier, clearly the “it” cartoonist of our day. The conventional wisdom is that the BookScan reporting is only the tip of the iceberg because the real market for kids books (and Raina, in particular) is going to be through things like Scholastic Book Fairs that run directly through elementary schools all over America. That’s all largely invisible, though, and something we can but speculate on.
The #1 book, “Ghosts” is Raina’s newest – just released this year (and not until September, for that, which means that this is the #1 book with just three months worth of sales!)
Raina also takes slots #2 (“Drama”), #4 (“Smile”), #5 (“Sisters”), then, with her adaptations of the “Baby Sitter Club” books, also takes spaces #6 (“Kristy’s Great Idea”), #7 (“Claudia and Mean Janine”), #10 (“The Truth About Stacey”) and #11 (“Mary Anne Saves the Day”) – literally every book she’s done that is in-print is a top-of-the-charts best-seller, which is wildly unprecedented in our dataset.
Altogether, Raina’s eight books sell a staggering 1.3 million copies for $14.4 million dollars in sales. To put that in context, that means that nearly 5% of all dollars generated by all graphic novels listed (all 21k of them!) are coming from the pen of one woman: Raina Telgemeier.
Coming in at #3 is volume 10 of Rachel Renee Russell’s “Dork Diaries”, is only kind of vaguely “comics” to my eyes, but it is also not not-comics! She also scores with v1 at #13 and v9 at #14 …. But that’s all that is listed for this series. We don’t know exactly how v 2-8 or 11 do, because they are apparently not BISCED “comics”-first! One presumes that many of those also sold in the 75-100k range as well, in 2016, but it’s more books than I’m really that comfortable with trying to chase down since they’re only kinda-sorta comics. Honestly, I should probably just remove it from the conversation at all, but that feels like ignoring a vital part of at least a comics-like infrastructure.
Plus, if I chase all of those down, then I really also should chase down Jay Kinney’s very similar semi-comics series, “Diary of a Wimpy Kid”, of which there are also eleven volumes – and we’re told more than 180 million copies in print. It’s a conundrum. Just what is “comics” when it comes to the balance of comics-to-prose? Should I eliminate these books entirely, or go all-in and track them down each year? Opinions, reader?
Russell now also has a second series (I think it’s a series, at least?), with the #9 book, “The Misadventures of Max Crumbly.
At #8 comes out first not for kids book, and one that celebrated it’s twenty-eighth anniversary at that: “Batman: The Killing Joke” by Alan Moore and Brian Bolland, a superhero comic that’s absolutely not for children. At 130k, that’s closing on double of 2015’s performance of 70k, and double again 2014’s showing of 32k. One imagines the animated adaptation last year drove that growth to a large extent.
At #12 is something that I’m entirely ignorant about, a comic apparently from someone famous for playing Minecraft on YouTube, ““DanTDM: Trayaurus and the Enchanted Crystal”. How that gets you to sell almost 100k books, I’m not sure I understand fully, but that’s OK, I’m not the only person who lives in this world. Despite the providence, it is clearly and explicitly comics.
At #15 is the seventh volume of Kazu Kibuishi’s “Amulet”, “Firelight”, #16 is “Roller Girl” by Victoria Jamieson, #17 is Lincoln Peirce’s “Big Nate: Thunka Thunka Thunka”, and #19 is Cece Bell’s “El Deafo” – all aimed pretty squarely at middle readers.
Finally, the Top 20 is filled out by Robert Kirkman and Charlie Adlard’s “The Walking Dead” at #18 & 20.
Only five of the top twenty books are created by white men, and only three of them could be considered work primarily aimed or created through the Direct Market comic book system. Things are clearly changing.
What if you sort the chart by dollars grossed, instead? That changes things a bit:
| $4,303,743 | THE WALKING DEAD COMPENDIUM, V |
| $3,995,394 | THE WALKING DEAD COMPENDIUM VO |
| $3,032,974 | THE WALKING DEAD COMPENDIUM VO |
| $2,910,382 | DORK DIARIES 10: TALES FROM A |
| $2,355,017 | THE KILLING JOKE |
| $2,343,453 | GHOSTS |
| $2,339,243 | DRAMA |
| $2,097,154 | POKEMON ADVENTURES RED & BLUE |
| $2,075,582 | SMILE |
| $1,983,128 | DANTDM: TRAYAURUS AND THE ENCH |
| $1,825,703 | SISTERS |
| $1,781,677 | KRISTY’S GREAT IDEA: FULL-COLO |
| $1,774,282 | THE MISADVENTURES OF MAX CRUMB |
| $1,569,427 | CLAUDIA AND MEAN JANINE |
| $1,441,703 | STAR WARS: THE ORIGINAL TRILOG |
| $1,370,293 | DORK DIARIES 1: TALES FROM A N |
| $1,354,379 | MARCH (TRILOGY SLIPCASE SET) |
| $1,280,994 | THE TRUTH ABOUT STACEY: FULL-C |
| $1,227,161 | DORK DIARIES 9: TALES FROM A N |
| $1,175,772 | HYPERBOLE AND A HALF |
Here you’ll see the power of the higher cover price, and “The Walking Dead” zooms up to take the top three spaces with the $60 Compendia (that reprint 48 issues at a throw), a boxed set of “Pokemon” books makes the cut ($55), as does the slipcased set of Representative John Lewis’ “March” ($50)
Perhaps as importantly, the 2016 charts have twenty-three books that generated more than a million dollars in gross sales – completely smashing the previous record from 2015 of just fifteen books.
How about if we sort it by author? Here are people with more than 10 books placing in the Top 750:
| KIRKMAN ROBERT | 40 |
| ISAYAMA HAJIME | 23 |
| SNYDER SCOTT | 17 |
| PEIRCE LINCOLN | 15 |
| MASHIMA HIRO | 13 |
| KIBUISHI KAZU | 12 |
| JOHNS GEOFF | 11 |
| MATSUI YUSEI | 11 |
| VAUGHAN BRIAN K. | 11 |
| ISHIDA SUI | 10 |
This is a lot smaller list than previous years – only ten people who place more than ten books each, with Kirkman being the real winner here. Just over 2.3 million copies, total, of the Top 750 are by these ten authors, or a bit under 23% of the total sales. Just a few people are writing a lot of the comics sold!
Let’s add some dollar amounts, with these being all of the authors selling over $1m combined in books, according to BookScan. That looks like this:
| KIRKMAN ROBERT | $17,787,623 |
| TELGEMEIER RAINA | $9,960,880 |
| RUSSELL RACHEL REN | $6,520,091 |
| MARTIN ANN M. | $5,791,653 |
| KIBUISHI KAZU | $4,476,503 |
| MOORE ALAN | $3,946,461 |
| PEIRCE LINCOLN | $3,900,271 |
| LEWIS JOHN | $3,664,001 |
| ISHIDA SUI | $3,569,405 |
| VAUGHAN BRIAN K. | $3,154,715 |
| SNYDER SCOTT | $2,941,665 |
| KUSAKA HIDENORI | $2,627,723 |
| ISAYAMA HAJIME | $2,458,302 |
| MURATA YUSUKE | $2,318,239 |
| DANTDM | $1,983,128 |
| SATRAPI MARJANE | $1,927,513 |
| MILLAR MARK | $1,783,692 |
| ENNIS GARTH | $1,765,525 |
| JOHNS GEOFF | $1,638,483 |
| WAY DANIEL | $1,618,637 |
| GILLEN KIERON | $1,542,045 |
| LUCASFILM BOOK GROUP | $1,441,703 |
| YANG GENE LUEN | $1,440,012 |
| BROWN JEFFREY | $1,422,964 |
| RUSSELL RACHEL RENEE | $1,370,293 |
| SPIEGELMAN ART | $1,344,811 |
| BROSH ALLIE | $1,175,772 |
| KISHIMOTO MASASHI | $1,172,701 |
| LOEB JEPH | $1,119,842 |
| MASHIMA HIRO | $1,083,636 |
| AARON JASON | $1,075,414 |
| ARAKI HIROHIKO | $1,052,074 |
| TOBIN PAUL | $1,031,787 |
| JAMIESON VICTORIA | $1,008,920 |
This gives us 34 authors, who sell a combined $101.1m worth of books. That is just under one-third of all comics dollars being spent on BookScan (all 21k+ entries!) from the pens of just a small number of people.
What you can take from this is that only a small number of creators drive the majority of the business in comics (and books in general, I think); and conversely, this probably means that most comics aren’t actually significantly profitable any given year.
(The best one is “Lucasfilm Book Group” where the publisher is listed in the author field, sheesh)
Let’s switch our attention to looking how publishers performed.
As a way to make the publisher breakdowns more readable, I split the chart into “eastern” (Manga) and “western” comics, because I think there are a few clear market distinctions between those categories. So, without further ado:
2016 Manga
No real clear dominance of series in Manga in 2016 – sales are up for the second year in a row, but over a wider variety of titles than historically typical.
Here’s a year-to-year comparison chart for the Top 750:
| Year | # of placing titles | Unit sales | Dollar sales |
| 2003 | 447 | 3,361,966 | $34,368,409 |
| 2004 | 518 | 4,603,558 | $45,069,684 |
| 2005 | 594 | 5,691,425 | $53,922,514 |
| 2006 | 575 | 6,705,624 | $61,097,050 |
| 2007 | 575 | 6,837,355 | $61,927,238 |
| 2008 | 514 | 5,624,101 | $53,033,579 |
| 2009 | 451 | 4,414,705 | $41,068,604 |
| 2010 | 436 | 3,117,019 | $30,212,561 |
| 2011 | 392 | 2,627,570 | $27,017,081 |
| 2012 | 367 | 1,908,186 | $21,324,368 |
| 2013 | 315 | 1,665,487 | $21,256,777 |
| 2014 | 271 | 1,748,185 | $22,601,720 |
| 2015 | 279 | 2,033,534 | $26,191,474 |
| 2016 | 311 | 2,629,366 | $35,915,488 |
Another up year for manga in America, though grow is slower than it is on the Western side. Manga is also nowhere near the heights that it reached a decade ago in 2006-2007. The top selling Manga in the US, via the BookScan reporters is “Tokyo Ghoul”, with just a bit over 54k in sales for the first volume.
Because manga tends to be long, ongoing series, instead of relatively self-contained graphic novels, there are generally fewer properties on the manga list than you will find on the Western lists. I count ninety-six distinct series among these three hundred and eleven placing books – that was only 89 series in 2015, so that seems like a positive trend to a wider list.
Manga, as a category, has a long tail:
| Year | # of listed items | Percent Change | Total Unit Sold | Percent Change | Total $ Sold | Percent Change | Av. Sale per title | Av $ per title |
| 2007 | 6231 | —— | 11,323,487 | —— | $108,770,537 | —– | 1817 | $17,456.35 |
| 2008 | 7842 | 20.54% | 10,173,091 | -11.31% | $100,800,283 | -7.91% | 1297 | $12,853.90 |
| 2009 | 8756 | 11.66% | 8,148,490 | -19.90% | $81,770,442 | -18.78% | 931 | $9,338.79 |
| 2010 | 8764 | —— | 6,239,725 | -23.42% | $67,092,668 | -17.95% | 712 | $7,655.48 |
| 2011 | 8991 | 2.59% | 5,690,327 | -8.80% | $62,810,728 | -6.38% | 633 | $6,985.96 |
| 2012 | 6332 | -29.57% | 3,510,057 | -38.32% | $40,943,613 | -34.81% | 554 | $6,466.14 |
| 2013 | 7024 | 10.93% | 3,516,208 | 0.01% | $44,651,823 | 9.06% | 501 | $6,357.04 |
| 2014 | 7452 | 6.09% | 3,914,385 | 11.32% | $51,557,925 | 15.47% | 525 | $6,918.67 |
| 2015* | 4412 | -40.79% | 4,580,434 | 17.02% | $62,253,624 | 20.75% | 1038 | $14,110.07 |
| 2016 | 4968 | 12.60% | 5,821,892 | 27.10% | $81,314,479 | 30.62% | 1172 | $16,367.65 |
These are solid results, though absolutely on the top of the charts, Manga is looking for its Next “Attack on Titan” or Next “Naruto” – in 2008 in the newest volume of “Naruto” sold over 104k copies all by itself, nearly twice what a best-seller today does.
Breaking down the manga portion of the chart by publisher, Viz takes 145 of the 311 manga spots in the Top 750, once again keeping them as the overwhelmingly dominant manga player with nearly half of the placing titles. Within the Top 750, Viz charted about 1,487,641 pieces, for just over $20 million – Viz continues to control the manga charts as they have for a very long time now, and it is really difficult envisioning anyone really challenging them substantially for that role because they are about three times larger than their nearest competitor.
Viz’s best-selling titles are “Tokyo Ghoul” and “One Punch Man”. “Tokyo Ghoul” v1 moves just over 54k copies, and is the best-selling manga comic of the year. The series charts ten volumes within the Top 750 for a combined total of nearly 275k copies sold. “One Punch Man” has nine volumes in the Top 750 for a total of about 232k copies combined (v1 sold just under 49k of those).
“Pokemon” also does well with a $55 boxed set (“Red & Blue” – it has the first seven “Pokemon Adventures” volumes) that sells just over 38k copies, which makes that over $2 million dollars in sales. In the Top 750 there are 11 “Pokemon” items that sell almost 126k copies combined. This would seem to be in response to the “Pokemon” mobile game’s major success last year.
One time powerhouse “Naruto” has fallen quite a bit – of the seventy-two (!) in-print volumes of Naruto (which doesn’t even count the “3-in-1” editions), only eleven place in the Top 750, for a total of about 110k copies sold.
| Year | # of listed items | Percent Change | Total Unit Sold | Percent Change | Total $ Sold | Percent Change | Av. Sale per title | Av $ per title |
| 2007 | 2018 | —— | 6,249,324 | —— | $55,123,347 | —– | 3097 | $27,315.83 |
| 2008 | 2447 | 21.26% | 5,536,286 | -11.41% | $50,311,791 | -8.97% | 2263 | $20,560.60 |
| 2009 | 2793 | 14.14% | 4,819,407 | -12.95% | $44,310,790 | -11.93% | 1726 | $15,864.94 |
| 2010 | 3088 | 10.56% | 3,576,671 | -25.79% | $35,041,305 | -20.92% | 1158 | $11,347.57 |
| 2011 | 3393 | 9.88% | 3,276,297 | -8.40% | $32,766,960 | -6.49% | 966 | $9,657.22 |
| 2012 | 3518 | 3.68% | 2,099,560 | -35.92% | $22,433,721 | -31.54% | 597 | $6,376.84 |
| 2013 | 3636 | 3.35% | 1,853,211 | -11.73% | $21,586,923 | -3.77% | 510 | $5,937.00 |
| 2014 | 3765 | 3.55% | 1,855,161 | 0.11% | $22,732,074 | 5.30% | 493 | $6,037.74 |
| 2015* | 2264 | -39.87% | 2,150,656 | 15.93% | $28,134,971 | 23.77% | 950 | $12,427.11 |
| 2016 | 2405 | 6.23% | 2,811,978 | 30.75% | $38,854,681 | 38.10% | 1169 | $16,155.79 |
Viz has one book (v1 of “Tokyo Ghoul”) that does over 50k in sales in 2015, another fifteen that do over 20k, and twenty-six more that do over 10k.
In second place among manga publishers, we have Kodansha Comics, which places 62 titles within the top 750, with 469k in sales, and $5.6 million dollars (compared to 493k and $6.1m in 2014).
Kodansha’s licenses formerly were both the original backbone of Tokyopop, as well as being the majority of Del Rey Manga. Kodansha pulled Tpop’s license in March of ’09 and Del Rey in October of ’10. You may want to look at those publisher’s listings below to get a better historical overview.
Kodansha’s current best-seller is “Attack on Titan”, where v 1 pulls in about 26k (compared to 34k in 2015), while v2 drops below 20k. The next best-seller is “Fairy Tail” at just over 24k.
These Long Tail figures are just for Kodansha-published titles, and they reflect that Kodansha, itself, first started publishing in 2010:
| Year | # of listed items | Percent Change | Total Unit Sold | Percent Change | Total $ Sold | Percent Change | Av. Sale per title | Av $ per title |
| 2010 | 9 | —— | 13,291 | —— | $322,717 | —— | 1477 | $35,857.44 |
| 2011 | 108 | 1200.00% | 197,021 | 1482.36% | $2,537,221 | 786.21% | 1825 | $23,492.79 |
| 2012 | 246 | 127.78% | 324,827 | 64.87% | $4,026,770 | 58.71% | 1320 | $16,368.98 |
| 2013 | 320 | 30.08% | 501,554 | 54.41% | $6,299,487 | 56.44% | 1567 | $19,685.90 |
| 2014 | 442 | 38.13% | 821,298 | 63.75% | $10,481,008 | 66.38% | 1858 | $23,712.69 |
| 2015* | 455 | 2.94% | 855,347 | 4.15% | $10,938,531 | 4.37% | 1880 | $24,040.73 |
| 2016 | 587 | 29.01% | 981,386 | 14.74% | $12,596,281 | 15.16% | 1672 | $21,458.74 |
In 2015 Kodansha has just those two titles over 20k, and eight more over 10k.
The #3 manga publisher is Yen Press, which places 56 titles in the Top 750, with about 350k copies sold, and nearly $5.8 million retail gross – they’re getting closer to Kodansha every year. Yen is a division of Hachette (more on them later).
In the Long Tail Yen is actually selling slightly better than Kodansha.
| Year | # of listed items | Percent Change | Total Unit Sold | Percent Change | Total $ Sold | Percent Change | Av. Sale per title | Av $ per title |
| 2007 | 10 | —— | 12,896 | —— | $147,449 | —– | 1,290 | $14,744.90 |
| 2008 | 90 | 800.00% | 110,126 | 753.95% | $1,237,860 | 739.52% | 1,224 | $13,754.00 |
| 2009 | 211 | 134.44% | 330,962 | 200.53% | $3,697,113 | 198.67% | 1,569 | $17,521.86 |
| 2010 | 344 | 63.03% | 560,983 | 69.50% | $6,650,871 | 79.89% | 1,680 | $19,333.93 |
| 2011 | 460 | 33.72% | 764,125 | 36.21% | $9,953,966 | 49.66% | 1,661 | $21,639.06 |
| 2012 | 548 | 19.13% | 647,948 | -15.20% | $8,735,264 | -12.24% | 1,182 | $15,940.26 |
| 2013 | 654 | 19.34% | 692,380 | 6.86% | $9,715,421 | 11.22% | 1,059 | $14,855.38 |
| 2014 | 776 | 18.65% | 682,135 | -1.48% | $9,985,502 | 2.78% | 776 | $12,867.92 |
| 2015* | 649 | -16.37% | 917,620 | 34.52% | $13,248,445 | 32.68% | 1414 | $20,413.63 |
| 2016 | 793 | 22.19% | 1,072,008 | 16.82% | $15,520,207 | 17.15% | 1352 | $19,571.51 |
Their best-selling title is v1 of “Black Butler” at just over 21k sold. They have just the one title over 20k, and four more over 10k
The fourth largest publisher of manga in 2016, on the Top 750 of BookScan is Seven Seas, which places 25 titles, for 168k and $2.4 million in sales. This is a solid rise on last year’s 110k and $1.4m.
Seven Seas’ Long Tail shows another superb year, four years now of over 30% growth!
| Year | # of listed items | Percent Change | Total Unit Sold | Percent Change | Total $ Sold | Percent Change | Av. Sale per title | Av $ per title |
| 2007 | 54 | —— | 50,641 | —— | $558,450 | —– | 938 | $10,341.67 |
| 2008 | 76 | 41.74% | 80,112 | 58.20% | $833,667 | 49.28% | 1,054 | $10,969.30 |
| 2009 | 97 | 27.63% | 74,967 | -6.42% | $807,666 | -3.12% | 773 | $8.326.45 |
| 2010 | 93 | -4.12% | 75,764 | 1.06% | $875,612 | 8.41% | 815 | $9,415.18 |
| 2011 | 118 | 26.88% | 116,360 | 53.58% | $1,426,618 | 62.93% | 986 | $12,089.98 |
| 2012 | 151 | 27.97% | 124,262 | 6.79% | $1,684,994 | 18.11% | 823 | $11,158.90 |
| 2013 | 223 | 47.68% | 204,419 | 64.51% | $2,942,608 | 74.64% | 917 | $13,195.55 |
| 2014 | 300 | 34.53% | 284,484 | 39.17% | $3,979,338 | 35.23% | 948 | $13,264.46 |
| 2015* | 304 | 1.34% | 374,715 | 31.72% | $5,177,568 | 30.11% | 1233 | $17,031.47 |
| 2016 | 417 | 37.17% | 491,947 | 31.29% | $6,960,634 | 34.44% | 1180 | $16,692.17 |
Their best-selling title is “Orange: The Complete Collection” (and an absolutely lovely book) at just over 16k. “Monster Musume” v8, which sells about 12.5k, is their only other book over 10k.
Moving back up to fifth largest publisher of manga, as measured by the BookScan Top 750, is Vertical. They place ten into the Top 750, 73k copies, for $1.3 million – that’s big ups on 17k and $354k the previous year.
The Long Tail continues this growth, and accelerates their superb last four years:
| Year | # of listed items | Percent Change | Total Unit Sold | Percent Change | Total $ Sold | Percent Change | Av. Sale per title | Av $ per title |
| 2007 | 25 | —— | 23,444 | —— | $417,914 | —— | 938 | $16,716.56 |
| 2008 | 34 | 36.00% | 21,003 | -10.41% | $343,109 | -8.21% | 617 | $10,091.44 |
| 2009 | 39 | 14.71% | 19,434 | -7.47% | $325,437 | -5.15% | 498 | $8,344.54 |
| 2010 | 62 | 58.97% | 33,097 | 70.30% | $494,098 | 51.83% | 534 | $7,969.32 |
| 2011 | 84 | 35.48% | 49,062 | 48.24% | $699,253 | 41.52% | 584 | $8,324.44 |
| 2012 | 118 | 40.48% | 45,026 | -8.23% | $671,086 | -4.03% | 382 | $5,687.17 |
| 2013 | 159 | 34.75% | 61,906 | 37.49% | $1,128,252 | 68.12% | 389 | $7,095.92 |
| 2014 | 187 | 17.61% | 83,312 | 34.58% | $1,491,984 | 32.24% | 446 | $7,978.53 |
| 2015* | 162 | -13.37% | 110,172 | 32.24% | $1,956,167 | 31.11% | 680 | $12,075.10 |
| 2016 | 185 | 14.20% | 172,792 | 56.84% | $2,931,568 | 49.86% | 934 | $15,846.31 |
Vertical places two books over 10k: v1 of the “Complete Chi’s Sweet Home” and nearly 14k copies sold, and the first volume of “Nichijou” which is less than 500 copies than that.
Bringing up the back of the pack at #6 will be Dark Horse, with eight placing titles in the Top 750, for 58k copies sold and $961k in dollar sales (that’s up a lot from last year’s 28k copies sold and $500k in dollar sales.
The best-selling DH title is Unofficial Hatsune Mix”, scoring 13,399 copies sold.
Looking at the Long Tail, this is what Dark Horse’s (manga only!) recent performance looks like – they seems to have finally reversed and stabilized their years-long slump.
| Year | # of listed items | Percent Change | Total Unit Sold | Percent Change | Total $ Sold | Percent Change | Av. Sale per title | Av $ per title |
| 2007 | 341 | —— | 249,943 | —— | $3,329,464 | —– | 733 | $14,744.90 |
| 2008 | 420 | 23.17% | 248,981 | -0.38% | $3,176,870 | -4.58% | 593 | $7,563.98 |
| 2009 | 455 | 8.33% | 226,497 | -9.03% | $2,915,693 | -8.22% | 498 | $6,408.12 |
| 2010 | 473 | 3.96% | 194,494 | -14.13% | $2,633,077 | -9.69% | 411 | $5,566.76 |
| 2011 | 497 | 5.07% | 189,329 | -2.66% | $2,602,230 | -1.17% | 381 | $5,235.86 |
| 2012 | 493 | -0.80% | 112,373 | -40.65% | $1,631,038 | -37.32% | 228 | $3,308.39 |
| 2013 | 521 | 5.68% | 103,538 | -7.86% | $1,678,563 | 2.91% | 199 | $3,221.81 |
| 2014 | 559 | 7.29% | 100,894 | -2.60% | $1,617,251 | -3.65% | 180 | $2,893.11 |
| 2015* | 303 | -45.80% | 135,444 | 34.24% | $2,238,167 | 38.39% | 447 | $7,386.69 |
| 2016 | 225 | -25.74% | 174,298 | 28.69% | $2,291,355 | 2.38% | 775 | $10,183.80 |
Dark Horse Manga also sells nearly 11k copies of the first “Berserk”, giving them two books over 10k..
There’s more about Dark Horse down below in the “Western” section.
There are also three titles from Udon (“Kill La Kill” sells best with just under 8k), and one from Sublime (“Ten Count” v1 sells a hair over 4k copies)
2016 Western Publishers
When I say “Western” here, I mean publishers/work from Europe and America, as opposed to Asia, not publishers of the genre of “western” comics!
I’d like to continue to remind you that back in 2008 there was some sort of behind-the-scenes recategorization in what got sent to me – I now know this is probably a change in BISAC codes! – and most of the “cartoon-strip humor” books like “Calvin & Hobbes” and “The Far Side” suddenly disappeared, so there’s kind of a not-strictly apples thing going on with the pre-2008 numbers here. Do keep that in mind when making comparisons both in the Top 750 chart, as well as the Long Tail.
Naturally, BookScan can’t seem to keep some sort of internally-consistent method of categorizing titles that doesn’t seem to change in some fashion from year-to-year – there was an influx of “strip” comics last year, and a few more this year too. It is apparently a limitation of how publishers assign BISACs and in what order.
Here comes some exceptional year-over-year growth in the Top 750 in 2016!
| Year | # of placing titles | Unit sales | Dollar sales |
| 2003 | 304 | 2,133,618 | $32,360,644 |
| 2004 | 233 | 1,467,535 | $22,713,802 |
| 2005 | 142 | 1,315,920 | $21,537,155 |
| 2006 | 174 | 1,689,571 | $29,314,852 |
| 2007 | 175 | 1,746,962 | $33,247,187 |
| 2008 | 236 | 2,710,175 | $48,327,594 |
| 2009 | 299 | 3,219,748 | $52,147,410 |
| 2010 | 314 | 3,297,317 | $54,515,605 |
| 2011 | 358 | 3,068,593 | $77,254,870 |
| 2012 | 383 | 3,530,143 | $68,593,986 |
| 2013 | 435 | 3,988,864 | $74,805,932 |
| 2014 | 479 | 4,910,846 | $90,166,989 |
| 2015* | 471 | 6,729,449 | $115,035,044 |
| 2016 | 439 | 7,338,541 | $123,594,588 |
Record breaking figures, and up nearly 400% from thirteen years ago.
Let’s take a look at the Long Tail for Western publishers collectively:
| Year | # of listed items | % Change | Total Pieces | % Change | Total Dollars | % Change | Av. Sale per title | Av $ per title |
| 2007 | 6950 | — | 3,029,039 | — | $74,595,605 | — | 436 | $10,733.18 |
| 2008 | 9728 | 39.97% | 5,368,678 | 77.24% | $98,233,459 | 31.69% | 552 | $10,098.01 |
| 2009 | 10,936 | 12.30% | 5,946,595 | 10.76% | $107,263,294 | 9.19% | 544 | $9,808.27 |
| 2010 | 13,229 | 20.97% | 5,890,507 | -0.01% | $105,342,577 | -0.02% | 445 | $7,963.00 |
| 2011 | 14,954 | 13.04% | 6,001,731 | 1.89% | $112,823,763 | 7.10% | 401 | $7,544.72 |
| 2012 | 17,031 | 13.89% | 6,052,179 | 0.84% | $123,471,753 | 9.44% | 355 | $7,249.82 |
| 2013 | 17,468 | 2.57% | 6,637,420 | 9.67% | $131,767,547 | 6.72% | 380 | $7,543.37 |
| 2014 | 19,524 | 11.77% | 7,905,939 | 19.11% | $156,040,431 | 18.21% | 405 | $7,992.24 |
| 2015* | 18,019 | -7.71% | 10,689,116 | 34.44% | $197,553,909 | 26.60% | 593 | $10,963.64 |
| 2016 | 16,328 | -9.38% | 11,516,867 | 7.74% | $212,698,759 | 7.67% | 705 | $13,026.63 |
Again, this is a great collective performance, compared to the overall state of print books in 2016 – Manga as a whole was up by higher percentages, but circulation and gross dollars are at the highest they’ve ever been. Comics are doing really fantastic.
Next, we’ll survey each of the publishers, and their best-selling titles, ranking them by the number of pieces they sold this year.
 For the second year in a row, the #1 Western publisher in the Top 750 is Scholastic. Scholastic has several imprints – besides the Graphix imprint, they also publish Arthur A. Levine and Blue Sky, and together, they place 36 titles in 2016 for almost 1.9 million copies, and almost $23 m in sales.
(Though, note that this is exclusively through BookScan reporters – there is a working assumption that whatever retail bookstore sales we’re seeing here are just a tiny fraction of their overall sales – between Book Fairs, school sales, Library sales and such, Scholastic might be racking up much more impressive numbers, but I can only analyze what data I actually have!)
What’s impressive is that Scholastic does this with such a relatively low number of titles – only about one third of the #2 publisher, and they’re selling 58% more comics into the Top 750.
In alphabetical order by imprint:
Arthur A. Levine places just one book into the Top 750: just a touch under 9k copies of “The Arrival” by Shaun Tan.
Blue Sky is also just one book in the Top 750 – Dav Pilkey’s “Ook & Gluk, Kung-Fu Cavemen”, comes in almost at 11k copies sold.
The Graphix imprint has 34 placing titles, for just under 1.9m in sales, and a bit under $23 million in dollars. Obviously, Graphix’s big hits are the Raina Telgemeier books (“Sisters”, “Smile”, “Drama”, and the “Baby Sitter’s Club” adaptations), all of which are discussed up top.
Graphix also does extremely well with Kazu Kibuishi’s “Amulet”, continues to soar, with all seven volumes and two different box sets charting, with the newly released volume 7 (“Firelight”) racking up an incredible 82k copies. Jeffrey Brown’s “Jedi Academy” books also do exceptionally well, with the first volume racking up over 63k copies. Jeff Smith’s “Bone”, which largely launched Scholastic as a comics power, continues to slip with only four of the nine volumes appearing in the Top 750 this year. V1, “Out From Boneville”, sells nine copies over 14k copies this year.
The Long Tail for Scholastic looks like this – really an astonishingly great growth:
| Year | # of listed items | Percent Change | Total Unit Sold | Percent Change | Total $ Sold | Percent Change | Av. Sale per title | Av $ per title |
| 2007 | 28 | —— | 203,900 | —— | $2,018,694 | —– | 7282 | $72,096.21 |
| 2008 | 39 | 39.29% | 346,134 | 69.76% | $3,498,012 | 73.28% | 8875 | $89,692.62 |
| 2009 | 52 | 33.33% | 432,070 | 24.83% | $4,654,686 | 33.07% | 8309 | $89,513.19 |
| 2010 | 60 | 15.38% | 361,086 | -16.43% | $4,084,718 | -12.25% | 6018 | $68,078.63 |
| 2011 | 72 | 20.00% | 419,010 | 16.04% | $4,708,860 | 15.28% | 5819 | $65,400.83 |
| 2012 | 76 | 5.56% | 325,088 | -22.42% | $3,955,249 | -16.00% | 4277 | $52,042.75 |
| 2013 | 91 | 19.74% | 437,590 | 34.61% | $5,365,921 | 35.67% | 4809 | $58,966.16 |
| 2014 | 97 | 6.59% | 846,277 | 93.39% | $10,204,175 | 90.17% | 8725 | $105,197.68 |
| 2015* | 140 | 44.33% | 1,449,296 | 71.26% | $17,170,714 | 68.27% | 10,352 | $122,647.96 |
| 2016 | 131 | -6.43% | 1,940,760 | 33.91% | $23,919,704 | 39.31% | 14,815 | $182,593.16 |
Wow, Scholastic has more than doubled the amount of pieces that they’ve sold into the book market in the last two years..
Scholastic has two books over 200k, six more over 100k, two more over 50k, nine more over 20k, and another five over 10k. That’s a crazy good performance.
Our #2 publisher in the Top 750, once again, is DC Entertainment.
In 2016 they placed 117 titles in the Top 750, for 1.2 million units, and just over $23 m in retail dollars, from their two charting imprints. “DC” itself is 98 of those placements, while Vertigo represents 19.
Here’s a year-to-year comparison chart of the Top 750:
| Year | # of placing titles | Unit sales | Dollar sales |
| 2003 | 74 | 336,569 | $6,151,258 |
| 2004 | 39 | 179,440 | $3,135,983 |
| 2005 | 42 | 298,484 | $5,440,001 |
| 2006 | 59 | 551,160 | $10,246,082 |
| 2007 | 58 | 487,467 | $9,953,976 |
| 2008 | 71 | 1,015,864 | $19,805,098 |
| 2009 | 93 | 1,223,733 | $24,061,834 |
| 2010 | 96 | 648,403 | $12,523,128 |
| 2011 | 107 | 660,706 | $13,083,378 |
| 2012 | 104 | 688,870 | $14,811,979 |
| 2013 | 130 | 767,686 | $15,620,981 |
| 2014 | 131 | 931,239 | $19,207,755 |
| 2015 | 119 | 1,074,304 | $21,701,088 |
| 2016 | 117 | 1,234,047 | $23,203,071 |
DC has yet another great year during 2016 in the book stores according to the BookScan reporters – but they still haven’t topped their ’09 performance (mostly driven by the incredible comics success of “Watchmen”, which was driven by the film). Getting closer, though!
As noted towards the top of the report, DC’s highest placing book is “Batman: The Killing Joke”, which sold almost 131k copies. Last year, “Killing Joke” sold just 70k copies, so: nearly double. And here’s one place we can see what I think is a clear sign that other-media adaptations (This was animated adaptation, that had a rare short theatrical engagement as well) can directly sell comics in some circumstances, especially when it is a specific adaptation of a specific story like this was. The success of “Killing Joke” didn’t necessarily appear to drive success of “Batman” comics in general – in fact, most Bat-titles in the Top 750 seemed to decline year-over-year. For example, the first volume of Snyder & Capullo’s run on “Batman” dropped more than 5k copies, while Miller’s “Dark Knight Returns” sold about 7k fewer copies. So it isn’t that an other-media success necessarily rises all members of a property’s boat – just the ones most-related to that other-media success.
Batman is DC’s most lucrative property, quelle surprise – a staggering forty-seven of the ninety-eight DC branded books are either directly Batman, or a member of his extended “family” (“Nightwing”, “Batgirl”, and so on), and account for 599k of DC’s sales. Notable books here include “Batman Vs Superman: The Greatest Battles” which soars up to 46k in the face of the BvS movie (I’d expect this to plummet in 2017) as DC’s #2 book, “Harley Quinn” v1 (33k) at #4, and “Court of Owls” and “Hush”, both selling around 21k at #9 & 10 respectively.
DC’s #3 title in 2016 is “Watchmen”, coming in at over 36k in paperback, up from 34k the year before. (4700 copies of the hardcover also make the Top 750) It’s probably no surprise then that DC is trying to tie current superhero continuity to this classic book, and, in fact, the very last entry in the Top 750 is the fancy $20 hardcover of the “DC Rebirth Special” (selling a hair over 4k copies) for that very tie-in. Author Alan Moore is also responsible for DC’s #8 book, “V For Vendetta” (22k)
At #5 is first volume of Garth Ennis’ and the late Steve Dillon’s “Preacher” (29k), though we can’t tell from the chart at this distance of how much of that was from the TV show, and how much was from the glowing national press after Dillon’s unfortunate death. Combined, all six volumes of “Preacher” make the Top 750, selling about 82k copies total.
DC’s #6 best-selling book through bookstores is the first volume of “DC Super Hero Girls” (28k), and I’m not sure that this sentence could have been written prior to 2017. Plus the second volume shows it is no fluke, coming in at #11 for DC (almost 10k) with just a single month on-sale.
At #7 for DC, is the first volume of the “New 52” era of “Suicide Squad” (28k), probably driven by the film. Seven different “Suicide Squad” books make the Top 750, for almost 75k combined.
Here’s DC’s Long Tail. I can not specifically explain why DC’s title count is so rapidly dropping, but the bottom line numbers seem to me to be in the correct range of where they could be, so…? When you look at the long tail, DC is, by far, the largest publisher, with nearly $48m in annual sales through the BookScan reporters.
| Year | # of listed items | % Change | Total Pieces | % Change | Total Dollars | % Change | Av. Sale per title | Av $ per title |
| 2007 | 1644 | — | 1,181,218 | — | $22,033,212 | — | 719 | $13,402 |
| 2008 | 2057 | 25.12% | 1,719,330 | 45.56% | $33,609,704 | 52.54% | 836 | $16,339 |
| 2009 | 2264 | 10.06% | 1,902,181 | 10.64% | $37,816,864 | 12.52% | 840 | $16,704 |
| 2010 | 2442 | 7.86% | 1,320,262 | -30.59% | $25,982,910 | -31.29% | 541 | $10,640 |
| 2011 | 2423 | -0.07% | 1,323,630 | 0.26% | $27,130,811 | 4.42% | 546 | $11,197 |
| 2012 | 2452 | 1.20% | 1,206,198 | -8.87% | $26,729,997 | -1.48% | 492 | $10,901 |
| 2013 | 2551 | 4.04% | 1,369,850 | 13.57% | $29,881,153 | 11.79% | 537 | $11,714 |
| 2014 | 2746 | 7.64% | 1,638,901 | 19.64% | $35,388,570 | 18.43% | 597 | $12,887 |
| 2015* | 1690 | -38.46% | 1,997,577 | 21.89% | $43,031,546 | 21.60% | 1182 | $25,462 |
| 2016 | 1214 | -28.17% | 2,262,888 | 13.82% | $47,963,215 | 11.46% | 1864 | $39,508 |
DC has one book over 100k, nine more over 20k, and twenty-four more that come in over 10k.
Image Comics moves up a spot to become our #3 Western publisher via the BookScan reporters; Image has 72 titles placing within the Top 750 in 2016, that sell 909k copies and almost $23m.
This is what Image’s performance has looked like, in the Top 750, over the last decade:
| Year | # of placing titles | Unit sales | Dollar sales |
| 2003 | 1 | 2,328 | $30,148 |
| 2004 | 1 | 402 | $5,206 |
| 2005 | 3 | 8,699 | $100,236 |
| 2006 | 1 | 5,311 | $113,465 |
| 2007 | 4 | 28,349 | $344,026 |
| 2008 | 9 | 55,033 | $830,574 |
| 2009 | 11 | 78,874 | $1,210,094 |
| 2010 | 22 | 289,044 | $6,479,930 |
| 2011 | 27 | 367,265 | $8,670,917 |
| 2012 | 33 | 701,050 | $20,389,762 |
| 2013 | 38 | 651,390 | $19,371,269 |
| 2014 | 47 | 691,804 | $17,554,492 |
| 2015 | 71 | 878,262 | $22,587,672 |
| 2016 | 72 | 908,655 | $22,917,758 |
It is not Image’s best percentage growth ever, but they’re still ticking up, and a lot is on the strength of “The Walking Dead”. As noted above those Compendia are big money makers at $60 for forty-eight issues at a time. “TWD” books are 37 of Image’s 72 spots in the Top 750, even with several volumes falling out of the Top 750. Softcover volumes 13 & 14 sold too few copies to make the Top 750, as did hardcover volumes 5 through 8. With the thirty-seven books that make it in though, “TWD” sells nearly 505k copies for $17.5m – more than half of the volume, and three-quarters of the dollars that Image places in the Top 750 are “The Walking Dead”
Image’s #1 book is “TWD” Compendium v3 (71k, with almost another 6k of a Barnes & Noble exclusive edition farther down), as is #2 (v1 at 67k), and #3 (v2 at 51k), and regular softcovers v 25 (43k), v 26 (32k), and v 1(26k) come in at #s 5, 6, and 8, respectively.
Robert Kirkman and Charlie Adlard’s hold on the charts is broken by Brian K Vaughan and Fiona Staples’ “Saga”, which takes spot #4 (Volume 6, for 44k), #7 (Volume 1, for 29k), and #9 (Volume 5 with 25k) – while the other three volumes of the series are close behind at #12-14. The “Saga” hardcover makes the Top 750 with about 7500 copies, while Vaughan’s “Paper Girls” just misses Image’s Top 10 with a debut of almost 24k copies. Also in the Top 10 for Image is Marjoie Liu and Sana Takeda’s “Monstress”, which opens with 24k.
Nothing else is really breaking out in a big way or sustaining previous year breakout so much – Jeff Lemire and Dustin Nguyen’s “Descender” does just 12k this year, while the first volumes of “Rat Queens” or “Bitch Planet” barely top 10k.
Here’s what Image’s Long Tail looks like; continuing strong growth, though perhaps less than their nearest competitors (realistically, if you looked at dollars only, it is practically a three-way race for “largest Western publisher” in the Top 750)
| Year | # of listed items | Percent Change | Total Unit Sold | Percent Change | Total $ Sold | Percent Change | Av. Sale per title | Av $ per title |
| 2007 | 438 | —— | 116,015 | —— | $2,313,477 | —– | 265 | $5,281.91 |
| 2008 | 515 | 17.58% | 121,001 | 4.30% | $2,445,765 | 5.72% | 235 | $4,749.06 |
| 2009 | 571 | 10.87% | 156,466 | 29.31% | $3,207,033 | 31.13% | 274 | $5,616.52 |
| 2010 | 642 | 12.43% | 359,238 | 229.59% | $8,152,806 | 254.22% | 560 | $12,699.07 |
| 2011 | 749 | 16.66% | 466,637 | 29.90% | $11,041,187 | 35.43% | 623 | $14,741.24 |
| 2012 | 868 | 15.89% | 794,419 | 70.24% | $22,797,279 | 106.47% | 915 | $26,264.15 |
| 2013 | 994 | 14.52% | 776,507 | -2.25% | $22,085,860 | -3.12% | 781 | $22,219.18 |
| 2014 | 1006 | 1.21% | 830,735 | 6.98% | $20,309,973 | -8.04% | 826 | $20,188.84 |
| 2015* | 842 | -16.30% | 1,070,299 | 28.84% | $26,175,438 | 28.88% | 1271 | $31,087.22 |
| 2016 | 876 | 4.04% | 1,187,316 | 10.93% | $28,267,847 | 7.99* | 1355 | $32,269.23 |
Image has three titles over 50k, nine more over 20K, and another eleven over 10k.
Dropping down to #4 Western Publisher in the BookScan Top 750 is Simon & Schuster, who are also the first of the mainstream book publishing so-called “Big Five”. They take this position with just seven placing titles, which total 602k in units and $9.2m at retail.
Five of these books are from their Aladdin imprint, while one each are from Margaret K. Elderberry, and Touchstone. This is exactly and precisely the same state of affairs as it was in 2015, they just sold about a third as many books.
From Aladdin comes Rachel Renee Russell’s immensely successful “Dork Diaries”, with the best-selling (“Tales From A Not So Fabulous Pet Sitter”) selling 208k copies by itself. This volume sold 358k copies in 2015. As noted towards the top, if all of the “Dork Diaries” books were in the database given to me, this would almost certainly change the charts a lot.
Touchstone books has just one title: Allie Brosh’s “Hyperbole and a Half” which sells almost 59k copies, almost identical to last year.
The Margaret K. Elderberry imprint also has one book – Emily Carroll’s “Through The Woods”, which sells just over 8k copies, a small rise from the previous year.
Here is Simon & Schuster’s Long Tail, which includes the imprints that I’m aware of (Aladdin and Simon-named ones, as well as Atria, Atheneum, Free Press, Gallery, Margaret K. Elderberry, Pocket, Scribner, and Touchstone)
| Year | # of listed items | % Change | Total Pieces | % Change | Total Dollars | % Change | Av. Sale per title | Av $ per title |
| 2007 | 12 | — | 8,317 | — | $158,014 | — | 693 | $13,167.83 |
| 2008 | 26 | 116.67% | 14,917 | 79.36% | $211,798 | 34.04% | 574 | $8,146.08 |
| 2009 | 41 | 57.69% | 109,558 | 634.45% | $1,430,544 | 575.43% | 2,672 | $34,891.32 |
| 2010 | 46 | 12.20% | 214,828 | 96.09% | $2,660,094 | 85.95% | 4,670 | $57,828.13 |
| 2011 | 62 | 34.78% | 187,531 | -12.71% | $2,383,491 | -10.40% | 3,025 | $38,443.40 |
| 2012 | 63 | 1.61% | 165,831 | -11.57% | $2,844,453 | 19.34% | 2,632 | $45,150.05 |
| 2013 | 67 | 6.35% | 258,931 | 56.14% | $4,165,350 | 46.44% | 3,865 | $62,169.40 |
| 2014 | 71 | 5.97% | 383,878 | 48.25% | $6,520,821 | 26.55% | 5,407 | $91,842.54 |
| 2015* | 75 | 5.63% | 910,341 | 237.14% | $13,386,461 | 205.29% | 12,138 | $178,486.15 |
| 2016 | 75 | —— | 618,922 | -32.01% | $9,477,798 | -29.20% | 8,252 | $126,370.64 |
Simon & Schuster has one book over 200k, another over 100k, three more over 50k, and one over 10k.
The #5 Western publisher within the Top 750 in 2016 is Marvel Comics, which places 60 titles for about 556k copies and $10.6m sold.
Here is how Marvel looks in the Top 750, really the kind of trajectory that they want:
| Year | # of placing titles | Unit sales | Dollar sales |
| 2003 | 73 | 455,553 | $8,428,962 |
| 2004 | 50 | 227,985 | $3,756,764 |
| 2005 | 26 | 153,317 | $2,459,027 |
| 2006 | 33 | 294,852 | $5,702,307 |
| 2007 | 37 | 376,918 | $7,599,057 |
| 2008 | 38 | 303,639 | $6,446,359 |
| 2009 | 34 | 226,541 | $5,019,216 |
| 2010 | 33 | 206,273 | $4,979,323 |
| 2011 | 27 | 128,364 | $3,303,496 |
| 2012 | 32 | 141,145 | $3,872,683 |
| 2013 | 39 | 187,598 | $4,229,242 |
| 2014 | 53 | 342,706 | $8,341,787 |
| 2015 | 63 | 478,076 | $10,611,981 |
| 2016 | 60 | 555,715 | $12,088,278 |
 It is another big year of growth for Marvel, as they again have their best year in BookScan since we’ve been tracking.
Having said that, “Marvel” is practically synonymous with “comics” itself amongst “civilians” – and they have multiple films and television shows running, well-saturating the market with awareness of their characters and effectively working as free advertising for the comics, that selling fewer comics than Robert Kirkman alone did in the Top 750 seems a little underwhelming. Marvel’s publication and collection strategy is a little all over the map, with it really being unclear to the casual reader what book should be read in which order, and this chaos in the line, I believe, is the largest reason they’re not outselling DC significantly in the book market. Just as one example: this year’s Top 750 features two distinct books both called “Spider-Gwen volume 1”
Probably surprising no one, Marvel’s #1 best-seller continues to be “Civil War”, at just over 39k, in the wake of the “Captain America” film with the same sub-title. Last year, as it was in advance of the film, the book did 47k. Another 6216 copies of the hardcover also sells further down the Top 750.
The #2 book from Marvel surprises me a bit – “Deadpool Kills the Marvel Universe”, with a bit over 30k) – not because it is “Deadpool” (that’s the impact of the surprise hit film), but because the tone of this particular book is really not the same as the film. This might be the tenth book I’d hand someone new to “Deadpool”, not the first – but at least the title is clear and descriptive, and implies it being self-contained. “Deadpool” in general is clearly Marvel’s best-selling franchise now – eighteen of the sixty titles here feature the character – even a venerable well-loved character like Spider-Man only places in the Top 750 at all in a team-up book with Deadpool. Marvel’s #4 book is the first volume of “The Complete Collection by Daniel Way” at almost 26k.
At #3, I’m surprised again to see the first volume of “Black Panther: A Nation Under Our Feet”, which is certainly here because it is written by Ta-Nehisi Coates – but my surprise is that it “only” sells 26k copies. I would have thought it would have done much much better in the bookmarket where Coates is a best-selling author.
At #5 comes “Star Wars”, specifically volume 1 of “Darth Vader” (22k), while v2 (19k) is #6. The “main” “Star Wars” comic has v1 at #8 (14k), and v2 at #10 (13k). “Star Wars” volumes are fifteen of the sixty titles in the Top 750 for a total of 152k.
At #7 for Marvel is the first volume of “Ms. Marvel” in at 18k, down a bit from last year’s 27k, but now with five volumes in the Top 750. My favorite thing about this performance is that “Ms. Marvel” is not the star of a movie, nor has sales driven by anything other than being an awesome comic book.
Otherwise, it’s pretty much business-as-usual on the Marvel charts this year.
Here is Marvel’s Long Tail.
| Year | # of listed items | % Change | Total Pieces | % Change | Total Dollars | % Change | Av. Sale per title | Av $ per title |
| 2007 | 1230 | — | 1,034,023 | — | $19,947,737 | — | 841 | $16,218 |
| 2008 | 1559 | 26.75% | 1,032,394 | -0.001% | $20,128,825 | 0.01% | 662 | $12,911 |
| 2009 | 2067 | 32.58% | 954,335 | -7.56% | $19,608,696 | -2.58% | 462 | $9,487 |
| 2010 | 2551 | 23.42% | 870,597 | -8.77% | $19,485,662 | -0.06% | 352 | $7,638 |
| 2011 | 2852 | 11.80% | 852,187 | -2.11% | $20,225,728 | 3.80% | 299 | $7,092 |
| 2012 | 3083 | 8.10% | 726,542 | -14.74% | $18,848,013 | -6.81% | 236 | $6,114 |
| 2013 | 3203 | 3.89% | 730,826 | 0.59% | $17,820,299 | -5.45% | 228 | $5,564 |
| 2014 | 3352 | 4.65% | 918,595 | 25.69% | $24,369,961 | 36.75% | 274 | $7,270 |
| 2015* | 1882 | -43.85% | 1,114,414 | 21.32% | $28,021,290 | 14.98% | 592 | $14,889 |
| 2016 | 1841 | -2.18% | 1,277,046 | 14.59% | $31,402,330 | 12.07% | 694 | $17,057 |
Marvel has five books over 20k, and another ten books that are over 10k.
The #6 publisher continues with Andrews McMeel. Andrews is a publisher that sometimes frustrates me by how they’ve been represented by BookScan – as I noted, it used to be that “humor” books like “Far Side” and “Calvin & Hobbes” used to rule the BookScan charts. Until, one day, poof! All of those books disappeared entirely from the dataset I was given, throwing off a whole lot of my comparables. And, for the most part, comic strip reprints have stayed out of these charts for half a decade. But, they’ve started creeping back into the listings for the last two years. I’m actually fine with comic strips and comic books co-existing in the same places – at least they’re both comics – but the inconsistency just drives me nucking futz.
I found 21 titles from Andrews in the Top 750 in 2016, for 432k copies and $4.5 million in sales, but clearly that number would scale up significantly if it listed all of the strip collections they publish. I have no reason to think that “Calvin & Hobbes” isn’t selling well through today.
Lincoln Pierce and “Big Nate” continued to be the big hit for Andrews McMeel – twelve of the twenty-one listed titles are that. 340k total copies and almost $3.5m dollars. And again, it’s probably very safe to assume there are significant sales happening on these books that BookScan isn’t capturing. This year’s best-selling “Big Nate” book is the wonderfully titled “Thunka Thunka Thunka” with almost 77k copies sold.
The other big winner here in the charts is “Pheobe and Her Unicorn” which while not scaling the same heights (v1 sells 20k in paperback, and almost 5k in hardcover), still manages to place five volumes into the Top 750.
Andrews McMeel’s Long Tail chart is just about the most useless one of all because they publish a whole lot of comics (humor strips, like “Calvin & Hobbes”) that I no longer see in the data that gets leaked to me – almost certainly they’re doing several times better than this chart would suggest because of those books. Further, things appear and disappear in a way I’ve never been able to make sense of. Most of my comparatives are terrible and counterproductive here, and I really apologize for the weakness of my data in this specific instance.
Still, they’re one of the rare down publishers this year.
| Year | # of listed items | Percent Change | Total Unit Sold | Percent Change | Total $ Sold | Percent Change | Av. Sale per title | Av $ per title |
| 2007 | 22 | —— | 29,835 | —— | $461,238 | —– | 1,356 | $20,965.36 |
| 2008 | 20 | -9.09% | 25,115 | -15.82% | $388,965 | -15.67% | 1,256 | $19,448.25 |
| 2009 | 21 | 5.00% | 26,205 | 4.34% | $401,982 | 3.35% | 1,248 | $19,142.00 |
| 2010 | 19 | -9.52% | 47,181 | 80.05% | $544,852 | 35.54% | 2,483 | $28,676.42 |
| 2011 | 17 | -10.53% | 116,850 | 147.66% | $1,222,171 | 124.31% | 6,874 | $71,892.41 |
| 2012 | 31 | 82.53% | 225,546 | 93.02% | $2,737,935 | 124.02% | 7,276 | $88,320.48 |
| 2013 | 43 | 38.71% | 343,681 | 52.38% | $3,747,799 | 36.88% | 7,993 | $87,158.12 |
| 2014 | 59 | 37.21% | 373,713 | 8.74% | $4,387,252 | 17.06% | 6,334 | $74,360.21 |
| 2015* | 76 | 28.81% | 502,061 | 34.34% | $5,950,368 | 35.63% | 6,606 | $78,294.32 |
| 2016 | 85 | 11.84% | 472,145 | -5.96% | $5,147,673 | -13.49% | 5,555 | $60,560.86 |
Andrews McMeel has two books over 50k, two more over 20k, and eight others over 10k.
Way back (?) in 2013 there was a significant merger between Random House and Penguin Putnam, making the once so-called “Big Six” of mainstream book publishing now just the “Big Five”. The resulting publisher is known as Penguin Random House, and was formally born on July 1, 2013. This entity continues to be the #7 largest publisher of Western comics in 2016, via the BookScan reporters, with 22 titles selling 346k copies, for $5.6m in sales.
Like a lot of the “big five” book publishers, these companies have lots and lots of imprints built up over decades if not centuries of publishing books. Penguin Random House, as best as I can tell, has eight distinct imprints that appear in the Top 750 list for 2016 – Alfred A. Knopf, Ballantine, Crown, Dial, Pantheon, Random House, Ten Speed, and Tundra.
They’re also, in the long tail: (deep breath!) Ace, Bantam, Berkley, Broadway Books, Del Rey, Doubleday, Dutton, Emblem, Golden, Gotham Books, G.P. Putnam & Sons, Grossett & Dunlap, Hudson Street, InkLit, McClelland & Stewart, Montena, New American Library, Penguin, Philomel, Plume, Price Stern Sloan, Puffin, Putnam, Razorbill, Riverhead, Schocken, Schwartz & Wade, Three Rivers, Viking, Villard, Watson-Guptill and Yearling. (whew!) However, they are not (Brian writes down here so he remembers this research next year) the PRH-distributed-only Campfire, Frog In Well, Library of America, Overlook Press, Powerhouse, Quirk, Shambhala, Universe, or Verso
Looking at those imprints in alphabetical order:
Alfred A. Knopf Books For Younger Readers places two books into the Top 750, both from Jarrett J. Krosocza’s “Lunch Lady” series. Aimed squarely at, as the imprint’s name implies, younger readers, the best-seller is “Lunch Lady & The Cyborg Substitute” with sales just over 7.5k.
Ballantine places just one title in the Top 750: Bryan Lee O’Malley’s “Seconds”, which sells nearly 8k copies in its third year of release.
Crown Books for Younger Readers has a single volume: Jeffrey Brown’s awesome “Lucy & Andy Neanderthal” which pulls in nearly 11k copies sold.
Dial places a single title – the YA focused “Roller Girl” by Victoria Jamieson which racks up an impressively strong 78k sold – that’s significantly up on 44k from last year.
Pantheon is their “literary” comics wing, and has some of PRH’s best-sellers. There are seven Pantheon books within the Top 750, the best-selling being Marjane Satrapi’s “Persepolis” at 56k. art spiegelman’s “Maus” comes in second with almost 40k copies sold in what is its 30th consecutive year in print. As usual, that drops to both a significant as well as stupid degree with volume 2 which sells just 14k (it’s like walking out in the middle of a play!) But, at least the spread between “Persepolis”’ first and second volume is even worse: v2 sells not even 6k copies. Where did the other 90% of the readership go? (Answer: they were not assigned v2 in class?) The complete edition of “Persepolis” sells 27k, while the complete edition of “Maus” sells 16k
Random House Books For Younger Readers is home to “Babymouse” — “Queen of the World” is the best-seller at just under 10K, while Judd Winick’s “Hilo” comes in at 9.3k for the new volume 2, and just over 9k for v1.
Ten Speed Press brings us a single title: “The Comic Book Story of Beer”, which sells about 5200 copies.
And finally, Tundra makes the list with “Narwahl: Unicorn of the sea”, another juvie-aimed title which does over 9k in both hard and softcover formats this year. Impressive!
Here’s what the Long-Tail for the Penguin Random House looked like in 2016:
| Year | # of listed items | % Change | Total Pieces | % Change | Total Dollars | % Change | Av. Sale per title | Av $ per title |
| 2013 | 282 | ——- | 447,174 | ——- | $7,259,364 | ——- | 1,586 | $25,742.43 |
| 2014 | 252 | -10.64% | 428,634 | -4.15% | $7,415,712 | 2.15% | 1,701 | $29,427.43 |
| 2015* | 450 | 78.57% | 513,611 | 19.83% | $8,517,761 | 14.49% | 1,141 | $18,928.36 |
| 2016 | 293 | -34.88 | 435,877 | -15.13% | $7,150,087 | -16.06% | 1,488 | $24,403.03 |
However, I’m not willing to pull an “We’ve always been at war with Eastasia” moment, so let’s look at the individual pieces of the past. This is what Penguin Putnam (Ace, Berkley Books, Dial, Dutton, Gotham Books, Grossett & Dunlap, Hudson Street, InkLit, New American Library, Penguin, Philomel, Plume, Price Stern Sloan, Puffin, Putnam, Razorbill, Riverhead and Viking) used to look like alone)
| Year | # of listed items | % Change | Total Pieces | % Change | Total Dollars | % Change | Av. Sale per title | Av $ per title |
| 2007 | 18 | —— | 13,545 | —— | $178,260 | —— | 753 | $9,903.33 |
| 2008 | 28 | 55.56% | 28,606 | 111.19% | $310,856 | 74.38% | 1022 | $11,102.00 |
| 2009 | 39 | 39.29% | 40,288 | 40.84% | $444,928 | 43.13% | 1033 | $11,408.41 |
| 2010 | 45 | 15.38% | 50,628 | 25.67% | $623,650 | 40.17% | 1125 | $13,858.89 |
| 2011 | 53 | 17.78% | 123,749 | 144.43% | $1,576,161 | 152.73% | 2335 | $29,738.89 |
| 2012 | 60 | 13.21% | 121,769 | -1.60% | $1,499,660 | -4.85% | 2029 | $24,994.33 |
This is what Random House (Alfred A. Knopf, Ballantine, Bantam, Broadway, Crown, Del Rey, Doubleday, Pantheon, Random House, Schocken, and Three Rivers) looked like alone:
| Year | # of listed items | % Change | Total Pieces | % Change | Total Dollars | % Change | Av. Sale per title | Av $ per title |
| 2007 | 74 | — | 216,580 | — | $2,890,347 | — | 2,927 | $39,058.74 |
| 2008 | 77 | 5.47% | 383,105 | 76.89% | $5,698,922 | 97.17% | 4,975 | $74,011.97 |
| 2009 | 109 | 41.56% | 405,598 | 5.87% | $5,398,890 | -5.26% | 3,721 | $49,531,10 |
| 2010 | 132 | 21.10% | 389,410 | -3.99% | $5,831,814 | 8.02% | 2,950 | $44,180.41 |
| 2011 | 144 | 9.09% | 397,143 | 1.99% | $6,356,212 | 8.99% | 2,760 | $44,140.36 |
| 2012 | 185 | 28.47% | 375,254 | -5.51% | $7,124,794 | 12.09% | 2,028 | $38,512.40 |
Penguin Random House has two titles over 50k, two additional books over 20k, and another three books over 10k.
Moving up this year to #8 on the Western charts is Dark Horse Comics, as they place 21 titles for 208k and $3.6m.
Dark Horse’s #1 book of the year, like last year, is a “Plants Vs. Zombies” title. This year it is “Garden Warfare”, which sells almost 29k copies. Compare this to 2015’s “Lawnmageddon”, which sold 18k copies (and which sells 13k this year). There are five other volumes of “PvZ”, as well as a box set on the Top 750 BookScan this year. Together the eight entries sell 106k combined – more than half of Dark Horse’s placement – and $1.1m in sales.
Dark Horse’s other big success story in 2016 is Chuck Palahniuk’s “Fight Club 2”, which racks up just over 25k in sales, and a bit more than three-quarters-of-a-million in dollars, making it their highest-grossing book for the year.
Dark Horse also continues to do very well with comics based on “Avatar: The Last Airbender” which has nine volumes place for almost 57k, total.
One small surprise for me was Margaret Atwood’s “Angel Catbird”, the first volume of which only pulls in 5654 copies – I would have thought that a Big Name author like that would have had a bit more drive.
Here’s what Dark Horse’s Western performance looks like in the Long Tail:
| Year | # of listed items | Percent Change | Total Unit Sold | Percent Change | Total $ Sold | Percent Change | Av. Sale per title | Av $ per title |
| 2007 | 597 | —— | 413,022 | —— | $7,607,264 | —– | 692 | $14,744.90 |
| 2008 | 734 | 22.95% | 552,815 | 33.85% | $9,329,828 | 22.64% | 753 | $12,710.94 |
| 2009 | 798 | 8.72% | 455,924 | -17.53% | $7,757,240 | -16.86% | 571 | $9,720.85 |
| 2010 | 955 | 19.67% | 445,248 | -2.34% | $7,852,063 | 1.22% | 466 | $8,222.06 |
| 2011 | 1025 | 7.33% | 389,514 | -12.52% | $7,102,710 | -9.54% | 380 | $6,929.47 |
| 2012 | 1133 | 10.54% | 377,322 | -3.13% | $6,907,772 | -2.74% | 333 | $6,096.89 |
| 2013 | 1238 | 9.27% | 383,391 | 1.61% | $7,391,831 | 7.01% | 310 | $5,970.78 |
| 2014 | 1420 | 14.70% | 421,708 | 9.99% | $8,982,411 | 21.52% | 297 | $6,325.64 |
| 2015* | 947 | -33.31% | 376,231 | -10.78% | $8,120,937 | –9.59% | 397 | $8,575.44 |
| 2016 | 877 | -7.39% | 461,297 | 22.61% | $9,076,526 | 11.77% | 526 | $10,349.52 |
Dark Horse’s Manga offerings are up in that section. Dark Horse is one of the rare publishers that does a significant business in both Eastern and Western comics, and I’m sure they’d prefer all of their numbers to be represented together. In which case, their Long Tail actually looks like this:
| Year | # of listed items | Percent Change | Total Unit Sold | Percent Change | Total $ Sold | Percent Change | Av. Sale per title | Av $ per title |
| 2007 | 938 | —— | 662,965 | —— | $10,936,728 | —– | 707 | $11,659.62 |
| 2008 | 1075 | 14.61% | 801,796 | 20.94% | $12,506,698 | 14.36% | 746 | $11,634.14 |
| 2009 | 1253 | 16.56% | 682,421 | -14.89% | $10,672,933 | -14.66% | 545 | $8,517.90 |
| 2010 | 1428 | 13.97% | 639,742 | -6.25% | $10,485,140 | -1.76% | 448 | $7,342.54 |
| 2011 | 1522 | 6.58% | 578,843 | -9.52% | $9,704,940 | -7.44% | 380 | $6,376.44 |
| 2012 | 1626 | 6.83% | 489,695 | -15.40% | $8,538,810 | -12.02% | 301 | $5,251.42 |
| 2013 | 1759 | 8.18% | 486,929 | -0.56% | $9,070,394 | 6.23% | 277 | $5,156.56 |
| 2014 | 1979 | 12.51% | 522,602 | 7.33% | $10,599,661 | 16.86% | 264 | $5,356.07 |
| 2015* | 1250 | -36.84% | 511,675 | -2.09% | $10,359,104 | -2.27% | 409 | $8,287.28 |
| 2016 | 1102 | -11.84% | 635,595 | 24.22% | $11,367,881 | 9.74% | 577 | $10,315.68 |
Dark Horse has two titles over 20k, and five more over 10k.
Slipping back to the #9 largest publisher with Western comics in BookScan 2016 is another of the “big five”: HarperCollins. Harper places nine books into the Top 750 for a total of 195k copies sold, and $3.5 million. There’s a lot of imprints with the word “Harper” in the title in the Long Tail (Harper, Harper Paperbacks, Harper Teen, Harper Festival, Harper Teen, and so on), and Harper is also IT books, William Morrow, and Zondervan.
Harper’s biggest hit is “DanTDM: Trayaurus and the Enchanted Crystal” by DanTDM, who is apparently a YouTuber? This comic is apparently based on Minecraft? I have no idea, I’m almost fifty! Either way, it racks up a very impressive 99k copies sold, making it a real world significant hit.
Noelle Stevenson’s “Nimona”, also continues its success, with almost 36k sold in its second frame (up from 32k last year). Harper also publishes three “Big Nate” volumes (which, no your eyes are not tricking you, is published by two different publishing houses) – the best-selling one, “Triple Play” sells just over 16k. The perennial “Understanding Comics” moves under 13k copies.
Their other imprints don’t show in the Top 750.
| Year | # of listed items | Percent Change | Total Unit Sold | Percent Change | Total $ Sold | Percent Change | Av. Sale per title | Av $ per title |
| 2007 | 18 | —— | 36,940 | —— | $600,540 | —– | 2052 | $33,363.33 |
| 2008 | 36 | 100.00% | 48,264 | 30.66% | $863,808 | 43.84% | 1341 | $23,994.67 |
| 2009 | 42 | 16.67% | 81,774 | 69.43% | $1,308,891 | 15.53% | 1947 | $31,164.07 |
| 2010 | 41 | -2.38% | 64,429 | -21.21% | $719,328 | -45.04% | 1571 | $17,544.59 |
| 2011 | 50 | 21.95% | 75,394 | 17.02% | $1,083,609 | 50.64% | 1508 | $21,672.18 |
| 2012 | 80 | 60.00% | 159,573 | 111.65% | $2,113,744 | 95.07% | 1995 | $26,421.80 |
| 2013 | 68 | -15.00% | 197,595 | 23.83% | $2,667,933 | 26.22% | 2906 | $39,234.31 |
| 2014 | 115 | 69.12% | 158,193 | -19.94% | $2,398,836 | -10.09% | 1376 | $21,042.42 |
| 2015* | 109 | -5.22% | 188,181 | 18.96% | $2,646,378 | 10.32% | 1726 | $24,278.70 |
| 2016 | 108 | -0.09% | 261,183 | 38.79% | $4,473,589 | 69.05% | 2418 | $41,422.12 |
Harper has one book over 50k (and it’s really close to 100k!), another book over 20k, and three more over 10k
Taking a big step up to round out the 2016 Top 10 publishers of Western comics in the BookScan Top 750 at #10 is IDW Publishing who place four books for a total of 158k sold and $3.7m.
All four entries are from Representative John Lewis’s “March” trilogy (one of them is the boxed set of all three volumes), his memoir about the civil rights struggle of the 1960s. Don’t forget our 45th President called Rep. Lewis “All talk, talk, talk — no action or results.” Sad! Volume 1 sells 59k, and none of the three sells less than 34k. Heck, even the box set moves 27k copies. One imagines this book will remain a strong perennial seller for decades, much like a “Maus”
(Also: the date we received did not have v3 listed, and I had to go asking after it – I’m am assuming that this is because the BISAC for “memoir” was listed before the BISAC for “graphic novels”; boo! Let’s see if anyone is reading this, and chooses to fix it for next year!)
IDW moves their bookstore distribution over to Penguin Random House (and away from Diamond Books) in 2017, joining DC and Dark Horse. One imagines this will give their line of licensed comics a big boost in the next year. It might also shift some Direct Market business over towards PRH as it effectively makes IDW restock 3-5% cheaper.
Interestingly, IDW actually places significantly fewer books into the Top 750 this year than they did in 2015 (where it was nine), but they also only sold 94k and $1.3 million in sales then. This is probably better
This is IDW’s Long Tail:
| Year | # of listed items | Percent Change | Total Unit Sold | Percent Change | Total $ Sold | Percent Change | Av. Sale per title | Av $ per title |
| 2007 | 233 | —— | 102,118 | —— | $2,090,647 | —– | 438 | $8,972.73 |
| 2008 | 335 | 43.78% | 146,125 | 43.09% | $2,766,505 | 32.33% | 436 | $8,258.22 |
| 2009 | 477 | 42.39% | 215,907 | 47.76% | $4,346,836 | 57.12% | 453 | $9,112.86 |
| 2010 | 623 | 30.61% | 161,578 | -25.16% | $3,653,680 | -15.95% | 259 | $5,864.65 |
| 2011 | 785 | 26.00% | 206,136 | 27.58% | $4,884,606 | 33.69% | 263 | $6,222,43 |
| 2012 | 937 | 19.36% | 162,599 | -21.12% | $4,329,973 | -11.35% | 174 | $4,621.10 |
| 2013 | 1059 | 13.02% | 180,694 | 11.13% | $4,443,372 | 2.62% | 171 | $4,195.82 |
| 2014 | 1134 | 7.08% | 228,895 | 26.68% | $5,309,992 | 19.50% | 200 | $4,641.40 |
| 2015* | 959 | -15.43% | 310,512 | 35.66% | $6,478,023 | 22.00% | 324 | $6,754.98 |
| 2016 | 978 | 1.98% | 343,197 | 10.53% | $8,194,098 | 26.49% | 351 | $8,378.42 |
IDW has one book over 50k, and three more over 20k.
That’s the Top 10 Western publishers, but there are more past that that we should at least quickly touch on!
In the Book publishing world, they talk about “The Big Five” – that would be: Hachette, HarperCollins, Holtzbrinck/Macmillan, Penguin Random House, and Simon & Schuster. We’ve covered three of those above, but we should at least glance at the other two, I think. In alphabetical order
Hachette includes the imprints of Little, Brown, Grand Central, and Yen. Together they do 90k copies and $1.6m. Yen has a lot of manga up above in the previous section. If you added them together, it would be about 440k, and $7.4m
Little, Brown places two books into the Top 750, “The White Donkey: Terminal Lance” is their best-seller, which sells almost 22k copies. They also sell 4226 copies of the first 3-in-one edition of Herge’s “Tintin”, which is disturbingly low for one of the classic masters of the medium, if you ask me.
Grand Central places a single book: “Indeh: A Story of the Apache Wars”, by Ethan Hawke, which comes in at 9159 copies sold. As an aside, one of the ways I used to try to identify books that might be missing from the data that gets leaked to me was to double check against the New York Times weekly best-seller list – “Indeh” appeared for a single week on the NYT list, and was the lowest-selling item on BookScan that appeared on a NYT list, as far as I could tell. So, “what’s a ‘NYT best-seller’ mention mean?” appears to be “it didn’t sell less than 9k”. Sadly, this measurement is essentially disappearing for comics.
Yen, which mostly prints Manga, does have a “western” hit with Svetlana Chmaova’s “Awkward”, which sells 45k copies this year (up amazingly from about 16k last year) – Hachette’s biggest comics seller.
Oh, hey, in 2016 they bought Perseus, which means they’re also Running Press, which means they also get to count 9880 copies of “Username: Evie” by Joe Sugg
Here’s the Long Tail of just the Western books for Hachette. It’s going to jump a bit because we now add Perseus publishers Basic Books, Public Affairs, and Running Press:
| Year | # of listed items | Percent Change | Total Unit Sold | Percent Change | Total $ Sold | Percent Change | Av. Sale per title | Av $ per title |
| 2007 | 15 | —— | 39,181 | —— | $689,383 | —— | 2,612 | $45,958.87 |
| 2008 | 18 | 20.00% | 37,519 | -4.24% | $596,609 | -13.46% | 2,084 | $33,144.94 |
| 2009 | 18 | —— | 40,172 | 7.07% | $642,935 | 7.76% | 2,232 | $35,718.61 |
| 2010 | 19 | 5.56% | 160,992 | 300.76% | $3,097,996 | 381.85% | 8,473 | $163,052.42 |
| 2011 | 24 | 26.32% | 88,131 | -45.26 | $1,273,500 | -58.89% | 3,672 | $53,063.01 |
| 2012 | 28 | 16.67% | 110,897 | 25.83% | $1,565,744 | 22.95% | 3,961 | $55,919.43 |
| 2013 | 24 | -14.29% | 39,093 | -65.75% | $584,783 | -62.65% | 1,629 | $24,365.96 |
| 2014 | 32 | 33.33% | 38,853 | -0.61% | $593,667 | 1.52% | 1,214 | $18,552.10 |
| 2015* | 30 | -0.63% | 61,539 | 58.39% | $830,047 | 39.82% | 2,051 | $27,668.23 |
| 2016 | 56 | 86.67% | 81,648 | 32.68% | $1,654,511 | 99.33% | 1,458 | $29,544.84 |
And if you add the Manga from Yen, it looks like this:
| Year | # of listed items | Percent Change | Total Unit Sold | Percent Change | Total $ Sold | Percent Change | Av. Sale per title | Av $ per title |
| 2007 | 25 | —— | 52,077 | —— | $836,832 | —– | 2,083 | $33,473.28 |
| 2008 | 108 | 332.00% | 147,645 | 183.51% | $1,834,469 | 119.22% | 1,367 | $16,985.82 |
| 2009 | 229 | 112.04% | 371,134 | 151.37% | $4,340,048 | 132.78% | 1,621 | $18,952.17 |
| 2010 | 363 | 58.52% | 721,975 | 94.53% | $9,748,867 | 124.63% | 1,999 | $26,856.38 |
| 2011 | 484 | 33.33% | 852,256 | 18.05% | $11,227,466 | 15.17% | 1,761 | $23,197.24 |
| 2012 | 576 | 19.01% | 758,845 | -10.96% | $10,301,009 | -8.25% | 1,317 | $17,883.70 |
| 2013 | 678 | 17.71% | 731,473 | -3.61% | $10,300,204 | —– | 1,079 | $15,192.04 |
| 2014 | 808 | 19.17% | 720,988 | -1.43% | $10,579,169 | 2.71% | 892 | $13,093.03 |
| 2015* | 742 | -8.17% | 994,407 | 37.92% | $14,304,955 | 35.22% | 1,340 | $19,278.92 |
| 2016 | 849 | 14.42% | 1,153,656 | 16.01% | $17,174,718 | 20.06% | 1,359 | $20,229.35 |
Hachette has two titles over 20k, on the Western charts.
Holtzbrinck, which owns Macmillan, is also one of those publishers with lots and lots (and lots) of imprints: FirstSecond, and Square Fishare the only two to make the Top 750, but there are others down into the Long Tail as well – I have also identified Farrar Straus Giroux, Henry Holt, Hill + Wang, Metropolitan, Picador, Roaring Brook, Rodale Press, St. Martins Griffin, Times books, and Tor. Holtzbrinck also distributes several other publishers, including Bloomsbury, Drawn & Quarterly, Papercutz, and Seven Seas. Holtzbrinck-owned companies placed fourteen titles in the Top 750, for about 130k and just over $1.7m combined.
The best-seller here from FirstSecond is almost 12k copies of “Zita the Spacegirl”. There are also two other “Zita” volumes by Ben Hatke listed, and together all three sell almost 24k copies. Last year’s hit, Scott McCloud’s “The Sculptor” disappears entirely from the Top 750, selling just 3535 copies (down from 14.3k). FirstSecond also continues to do very well with Mariko Tamaki’s “The One Summer”, which sells 10.2k copies.
Square Fish’s top title continues to be Gene Yang’s “American Born Chinese” (almost 35k, up from 29k in the previous year), followed by Hope Larson’s Adaptation of “A Wrinkle In Time”, which sells a bit over 15k (up from 12k the year before)
Here’s Holtzbrinck’s Long Tail (again, I might have missed an imprint somewhere – trying to tease them all out is a difficult task from their Byzantine org chart).
| Year | # of listed items | Percent Change | Total Unit Sold | Percent Change | Total $ Sold | Percent Change | Av. Sale per title | Av $ per title |
| 2007 | 39 | —— | 31,452 | —— | $559,681 | —– | 806 | $14,350.79 |
| 2008 | 66 | 69.23% | 63,473 | 101.81% | $1,132,767 | 102.40% | 962 | $17,163.14 |
| 2009 | 88 | 33.34% | 84,090 | 32.48% | $1,438,044 | 26.95% | 956 | $16,341.41 |
| 2010 | 108 | 22.73% | 68,599 | -18.42% | $1,085,311 | -24.53% | 635 | $10,049.18 |
| 2011 | 139 | 28.70% | 114,243 | 66.54% | $1,794,084 | 65.31% | 822 | $12,907.08 |
| 2012 | 165 | 18.71% | 126,745 | 10.94% | $2,077,143 | 15.78% | 768 | $12,588.75 |
| 2013 | 187 | 13.33% | 142,375 | 12.33% | $2,395,569 | 15.33% | 761 | $12,810.53 |
| 2014 | 222 | 18.72% | 190,682 | 33.93% | $3,096,858 | 23.27% | 859 | $13,949.81 |
| 2015* | 104 | -53.15% | 99,223 | -47.96% | $1,804,001 | -41.75% | 954 | $17,346.16 |
| 2016 | 272 | 161.54% | 272,668 | 174.80% | $4,240,075 | 135.04% | 1,002 | $15,588.51 |
Holtzbrinck has one book over 20k, and three more books over 10k.
While not one of the “Big Five”, there are other publishers that I would consider both “significant” as well as bookmarket-first who did well in the Top 750. In straight alphabetical: Henry N. Abrams (10 titles), Houghton Mifflin Harcourt (2), and Hyperion/Disney Press (6) Joe Books (7), and Papercutz (1)
Starting with Henry N. Abrams, which publishes both as Abrams Comicarts, Henry N. Abrams, as well as Amulet Books. They place ten books into the Top 750 for 145k in sales and $1.7m (which actually makes them Western publisher #11)
As an Abrams branded impriny, their best-selling book is “El Deafo” which racks up a very impressive 67k sold (down from 73k the previous year)
As Amulet, they score biggest with “Poptropica V1: Mystery of the Map” and the sixth volume of “Nathan Hale’s Hazardous Tales: Alamo All-Stars”, both of which do about 16k. (three other Hale books place in the Top 750 as well)
Here is your long-tail:
| Year | # of listed items | Percent Change | Total Unit Sold | Percent Change | Total $ Sold | Percent Change | Av. Sale per title | Av $ per title |
| 2008 | 3 | —— | 10,031 | —— | $148,675 | —— | 3,344 | $49,558.33 |
| 2009 | 25 | 733.33% | 24,116 | 140.41% | $640,635 | 330.90% | 965 | $25,625.40 |
| 2010 | 41 | 64.00% | 48,240 | 100.03% | $1,109,444 | 73.18% | 1,177 | $27,059.61 |
| 2011 | 49 | 19.51% | 31,846 | -33.98% | $731,054 | -34.11% | 650 | $14,919.47 |
| 2012 | 62 | 26.53% | 37,522 | 17.82% | $756,650 | 3.50% | 605 | $12,204.03 |
| 2013 | 70 | 12.90% | 72,538 | 93.32% | $3,278,063 | 333.23% | 1,036 | $46,829.47 |
| 2014 | 88 | 25.71% | 74,083 | 2.13% | $2,324,820 | -29.10% | 842 | $26,418.41 |
| 2015* | 92 | 4.55% | 145,633 | 96.58% | $1,898,267 | -18.35% | 1,583 | $20,633.34 |
| 2016 | 112 | 21.74% | 177,127 | 21.63% | $2,326,956 | 22.58% | 1,581 | $20,776,39 |
Henry N. Abrams has one book over 50k, and two more over 10k.
Houghton Mifflin Harcourt publishes comics both as HMH and Mariner. They place two titles into the Top 750 that total 65k and $687k in sales.
The best-seller is Alison Bechdel’s “Fun Home” which which does 38k (down from 52k). They also place 7598 copies of Bechdel’s “Are You My Mother?” into the Top 750.
The Long Tail:
| Year | # of listed items | Percent Change | Total Unit Sold | Percent Change | Total $ Sold | Percent Change | Av. Sale per title | Av $ per title |
| 2007 | 4 | —— | 20,474 | —— | $434,495 | —— | 5119 | $108,623.75 |
| 2008 | 6 | 50.00% | 14,183 | -30.73% | $307,019 | -29.34% | 2363 | $51,169.83 |
| 2009 | 14 | 133.33% | 24,568 | 73.22% | $436,328 | 42.12% | 1755 | $31,166.29 |
| 2010 | 17 | 21.43% | 29,163 | 18.70% | $532,539 | 22.05% | 1715 | $31,325.82 |
| 2011 | 18 | 5.88% | 24,239 | -16.88% | $450,536 | -15.40% | 1347 | $25,029.78 |
| 2012 | 21 | 16.67% | 23,562 | -2.79% | $402,575 | -10.65% | 1122 | $1,9170.24 |
| 2013 | 29 | 38.10% | 44,558 | 89.11% | $687,920 | 70.88% | 1536 | $23,721.38 |
| 2014 | 27 | -6.90% | 32,751 | -26.50% | $552,884 | -19.63% | 1213 | $20,477.19 |
| 2015* | 33 | 22.22% | 78,357 | 239.25% | $1,214,786 | 219.72% | 2374 | $36,811.70 |
| 2016 | 38 | 15.15% | 60,359 | -22.97% | $943,188 | 22.36% | 1588 | $24,820.74 |
Houghton Mifflin Harcourt has just the one book over 20k.
Hyperion/Disney Press is, like Marvel, also owned by Disney. Technically, that probably means I should fold them together, but I resist, how I resist (largely because they are distributed entirely separately). However, if we did that, the combined entity would just barely move one place forward, to #4. Hyperion has six placing titles, doing 56k, and $849k. The best-selling title is “Lightning Thief”, a “Percy Jackson” book, which sells a little over 16k, but the kids-oriented adaptation of “Star Wars: The Original Trilogy” is barely 200 copies behind.
| Year | # of listed items | Percent Change | Total Unit Sold | Percent Change | Total $ Sold | Percent Change | Av. Sale per title | Av $ per title |
| 2007 | 10 | —– | 39,121 | —– | $336,771 | —– | 3912 | $33,677.10 |
| 2008 | 19 | 90.00% | 41,005 | 4.82% | $409,051 | 21.46% | 2158 | $21,529.00 |
| 2009 | 24 | 26.32% | 23,301 | -43.18% | $234,078 | -42.78% | 971 | $9,753.25 |
| 2010 | 26 | 8.33% | 30,860 | 32.44% | $314,067 | 34.17% | 1187 | $12,079.50 |
| 2011 | 29 | 11.54% | 46,553 | 50.85% | $392,652 | 25.02% | 1605 | $13,539.72 |
| 2012 | 31 | 6.90% | 33,105 | -28.89% | $376,735 | -4.05% | 1068 | $12,152.74 |
| 2013 | 33 | 6.45% | 102,537 | 209.73% | $1,298,672 | 244.72% | 3107 | $39,353.70 |
| 2014 | 38 | 15.15% | 77,045 | -24.86% | $1,015,188 | -21.83% | 2028 | $26,715.49 |
| 2015* | 57 | 50.00% | 63,290 | -17.85% | $831,477 | -18.10% | 1110 | $14,587.32 |
| 2016 | 36 | -36.84% | 61,730 | -2.46% | $926,504 | 11.43% | 1715 | $25,736.22 |
Hyperion has two books over 10k.
Joe Books mostly just do screen-cap fumetti (Or as they call them “cinestory”). But their screen-caps of “Disney Descendants: Wicked World” do really well, with v1 doing about 47k, and v2 doing 22k. Other adaptations doing great include “Gravity Falls” (13k), “Zootopia” (11k), and “Trolls” (10k). All together, Joe Books placed seven titles in the Top 750 for 118k and $1.3m.
They’re a newer company, so the history of their long tail is fairly short:
| Year | # of listed items | Percent Change | Total Unit Sold | Percent Change | Total $ Sold | Percent Change | Av. Sale per title | Av $ per title |
| 2014 | 1 | — | 22,740 | — | $340,873 | — | 22,740 | $340,873.00 |
| 2015* | 13 | 1200.00% | 66,375 | 291.88% | $1,047,511 | 307.30% | 5,106 | $80,577,77 |
| 2016 | 43 | 2307.69% | 139,487 | 110.15% | $1,661,338 | 58.60% | 3,244 | $38,635.77 |
Joe Books has two titles over 20k, and three more over 10k.
Papercutz, which has just one title place – also a comic connected to Dreamwork’s “Trolls” property, for just 6615 copies and $53k. Since losing the “Lego Ninjago” license, they’ve been looking hard for another hit.
Long Tail:
| Year | # of listed items | Percent Change | Total Unit Sold | Percent Change | Total $ Sold | Percent Change | Av. Sale per title | Av $ per title |
| 2007 | 65 | —— | 20,121 | —— | $179,373 | —– | 310 | $2,759.58 |
| 2008 | 103 | 58.46% | 39,949 | 98.54% | $368,008 | 105.16% | 388 | $3,572.89 |
| 2009 | 141 | 36.89% | 60,911 | 52.47% | $594,199 | 61.46% | 432 | $4,214.18 |
| 2010 | 190 | 34.75% | 76,986 | 26.39% | $772,290 | 29.97% | 405 | $4,064.68 |
| 2011 | 210 | 10.53% | 76,139 | -1.10% | $657,997 | -14.80% | 363 | $3,133.32 |
| 2012 | 258 | 22.86% | 172,744 | 126.88% | $1,343,044 | 104.11% | 670 | $5,205.60 |
| 2013 | 298 | 15.50% | 220,048 | 27.38% | $1,670,814 | 24.41% | 738 | $5,606.76 |
| 2014 | 354 | 18.79% | 144,206 | -34.47% | $1,173,414 | -29.77% | 407 | $3,314.73 |
| 2015* | 187 | -47.18% | 80,223 | -44.37% | $707,383 | -39.72% | 429 | $3,782.80 |
| 2016 | 419 | 124.06% | 53,848 | -32.88% | $538,883 | -23.82% | 129 | $1,286.12 |
Papercutz has no books with sales over 10k this year.
Outside of those bookstore-native publishers, we’ve got several Direct Market-native publishers who placed more than three titles into the Top 750. Those would be: Oni (6 titles placing), Boom (4), Drawn & Quarterly (2), and Archie (1)
For many years Oni Press has been absolutely ruled by Bryan Lee O’Malley’s “Scott Pilgrim”, but this changes in 2016, as the first volume of “Rick and Morty” zooms up to become their best-selling book with a hair over 13k sold. This is followed by the first book of “Invader Zim” (8422), and the second “Rick And Morty” (6973). These are followed by the first book of “Scott Pilgrim” in paperback (6434) and box set (5920) and hardcover (5604), but its not the juggernaut it once was.
Here’s Oni’s Long Tail, which is looking much healthier these days:
| Year | # of listed items | Percent Change | Total Unit Sold | Percent Change | Total $ Sold | Percent Change | Av. Sale per title | Av $ per title |
| 2007 | 125 | —— | 11,294 | —— | $141,829 | —– | 90 | $1,134.63 |
| 2008 | 138 | 10.40% | 21,843 | 93.40% | $320,799 | 126.19% | 158 | $2,324.63 |
| 2009 | 149 | 7.97% | 51,584 | 136.13% | $713,121 | 122.30% | 346 | $4,786.05 |
| 2010 | 156 | 4.70% | 446,791 | 866.14% | $5,882,247 | 824.86% | 2864 | $37,706.71 |
| 2011 | 177 | 13.46% | 162,275 | -63.68% | $2,786,438 | -52.63% | 917 | $15,742.59 |
| 2012 | 171 | -3.39% | 80,560 | -50.36% | $1,594,016 | -42.79% | 471 | $9,321.73 |
| 2013 | 195 | 14.04% | 68,140 | -15.42% | $1,401,748 | -12.06% | 349 | $7,188.45 |
| 2014 | 213 | 9.23% | 61,584 | -9.62% | $1,303,069 | -7.04% | 289 | $6,117.70 |
| 2015* | 165 | -22.54% | 65,254 | 5.96% | $1,478,997 | 11.35% | 395 | $8,963.62 |
| 2016 | 191 | 15.76% | 90,222 | 38.26% | $1,992,643 | 34.73% | 472 | $10,432.69 |
Oni has one book over 10k.
Boom! sells four titles into the Top 750, for almost 33k and $474k in sales. Every book they place this year into the Top 750 is a YA or Kids title. The first volume of “Lumberjanes” is their hit with almost 19k copies sold.
| Year | # of listed items | Percent Change | Total Unit Sold | Percent Change | Total $ Sold | Percent Change | Av. Sale per title | Av $ per title |
| 2007 | 21 | —– | 10,462 | —– | $246,984 | —— | 498 | $11,761.14 |
| 2008 | 44 | 109.52% | 10,943 | 4.60% | $394,361 | 59.67% | 249 | $8,962.75 |
| 2009 | 93 | 111.36% | 25,378 | 131.91% | $485,485 | 23.11% | 273 | $5,220.27 |
| 2010 | 202 | 117.20% | 64,770 | 155.22% | $1,140,019 | 134.82% | 321 | $5,643.66 |
| 2011 | 253 | 25.25% | 75,472 | 16.52% | $1,435,514 | 25.92% | 298 | $5,673.97 |
| 2012 | 307 | 21.34% | 59,758 | -20.82% | $1,160,894 | -19.13% | 195 | $3,781.41 |
| 2013 | 347 | 13.03% | 86,637 | 44.98% | $1,650,374 | 42.16% | 250 | $4,756.12 |
| 2014 | 388 | 11.82% | 108,504 | 25.24% | $1,894,658 | 14.80% | 280 | $4,883.14 |
| 2015* | 295 | -23.97% | 126,029 | 16.15% | $2,159,071 | 13.96% | 427 | $7,318.88 |
| 2016 | 309 | 4.75 | 134,386 | 6.63% | $2,313,502 | 7.15% | 435 | $7,487.06 |
Boom! just has the one book over 10k.
Drawn & Quarterly places two books into the Top 750, for just over 11k, and almost $250k. Their best-selling title is Adrian Tomine’s “Killing and Dying” which sells 7239 copies.
| Year | # of listed items | Percent Change | Total Unit Sold | Percent Change | Total $ Sold | Percent Change | Av. Sale per title | Av $ per title |
| 2007 | 62 | — | 24,689 | — | $500,764 | — | 398 | $8,076.84 |
| 2008 | 82 | 32.26% | 42,038 | 70.27% | $912,774 | 82.28% | 513 | $11,131.39 |
| 2009 | 107 | 30.49% | 42,957 | 2.19% | $920,014 | 0.79% | 401 | $8,598.26 |
| 2010 | 126 | 17.76% | 44,737 | 4.14% | $1,009,387 | 9.71% | 355 | $8,011.01 |
| 2011 | 145 | 15.08% | 62,286 | 39.23% | $1,399,793 | 38.68% | 430 | $9,653.74 |
| 2012 | 155 | 6.90% | 43,098 | -30.81% | $926,233 | -33.83% | 278 | $5,975.70 |
| 2013 | 189 | 21.94% | 41,887 | -2.81% | $893,905 | 3.49% | 222 | $4,729.66 |
| 2014 | 205 | 8.47% | 46,030 | 9.90% | $1,032,032 | 15.45% | 225 | $5,034.30 |
| 2015* | 219 | 6.83% | 73,471 | 59.62% | $1,680,878 | 62.87% | 335 | $7,675.24 |
| 2016 | 233 | 6.39% | 57,326 | -21.97% | $1,266,170 | -24.67% | 246 | $5,434.21 |
Drawn & Quarterly has no books over 10k.
Archie Comics places a single book in the Top 750, selling 4203 copies and $38k – it’s a volume of “Sonic the Hedgehog”. We have an existing chart is really the only reason we list them separately at this point. Though, when I’m looking at this now, at day nine of writing the column, I just noticed that the first volume of the Mark Waid & Fiona Staples “Archie” isn’t on the chart at all – it’s weird, I can’t really think of what other kind of a BISAC code it could have had to cause that, but it’s too late for me to do anything about it at this late date; I’ve put it on the list of things to look at closely for 2017 (when things are likely to explode with the “Riverdale” TV show?) The second volume of the Waid “Archie” only sells 946 copies, however, while “Jughead” v1 only brings in 1212 copies, so it’s possible it wasn’t significant? I told you that BookScan can be capricious….
Here’s Archie’s Long Tail:
| Year | # of listed items | Percent Change | Total Unit Sold | Percent Change | Total $ Sold | Percent Change | Av. Sale per title | Av $ per title |
| 2007 | 18 | —— | 12,443 | —— | $103,998 | —– | 691 | $5,777.67 |
| 2008 | 26 | 44.44% | 25,046 | 101.29% | $220,207 | 111.74% | 963 | $8,469.50 |
| 2009 | 33 | 26.92% | 26,998 | 7.79% | $246,557 | 11.97% | 818 | $7,471.42 |
| 2010 | 43 | 30.30% | 24,828 | -8.04% | $227,014 | -7.93% | 577 | $5,279.40 |
| 2011 | 62 | 44.19% | 51,551 | 107.63% | $528,353 | 132.74% | 831 | $8,521.82 |
| 2012 | 85 | 37.10% | 66,988 | 29.95% | $797,165 | 50.88% | 788 | $9,378.41 |
| 2013 | 110 | 29.41% | 79,978 | 19.39% | $974,889 | 22.29% | 727 | $8,862.63 |
| 2014 | 148 | 34.55% | 92,953 | 16.22% | $1,170,486 | 20.06% | 628 | $7,908.69 |
| 2015* | 165 | 11.49% | 75,222 | -19.08% | $892,756 | -23.73% | 456 | $5,410.64 |
| 2016 | 163 | -1.21% | 56,241 | -25.23% | $730,252 | -18.20% | 345 | $4,480.07 |
Archie has no books over 10k (we think?)
No publisher that has not been mentioned placed more than two titles within the Top 750, which leaves me with twelve books from ten different publishers.
The only thing in this cohort that sells more than 20k copies is “Quest For The Golden Apple” by Sky Pony Press, “Minecraft” related book with fumetti-style screencaps from in-game. This sells almost 36k copies, making it a legitimate hit. Also from “Minecraft” fumetti they publish “Revenge of the Zombie Monks” which does a more modest (but still pretty good) 12k.
There are three other books from smaller publishers that sell over 10k copies – 15k copies of “Clinton Cash: The Graphic Novel” from Regnery, 14k copies of Gareth Hinds’ adaptation of “The Odyssey” from Candlewick, and 13k copies of Daniel Clowes’ “Patience” from Fantagraphics (surprisingly they’ve never placed enough books to justify building a long-tail for them). Fanta also comes in towards the bottom of the chart with 4092 copies of Clowes’ “Ghost World”
The remaining seven titles came in under 10k, and include 9504 of Jeff Smith’s complete “Bone” (self-published) and 9330 copies of Ted Rall’s biography comic of “Bernie” (Sanders, that is); Amazon’s comics imprint, Jet City, has a hard time selling a George RR Martin comic, only moving a bit over 5k of “Hedge Knight”
One final little bit of number crunching before I go for the year. If we look at the entirety of the 21k-long “Long Tail” BookScan list, how do the publishers stack up in 2016? We’ll consider it in dollars, this time, including both “east” and “west” comics, and round everything to the nearest hundred-thousand just for ease of presentation
| #1 DC | $48.0 Million |
| #2 Viz | $38.90 |
| #3 Marvel Comics | $31.40 |
| #4 Image Comics | $28.30 |
| #5 Scholastic | $23.90 |
| #6 Hachette | $17.20 |
| #7 Kodansha | $12.60 |
| #8 Dark Horse | $11.40 |
| #9 Simon & Schuster | $9.50 |
| #10 IDW Publishing | $8.20 |
And that’s pretty much what BookScan in 2016 looks like to these eyes.
How does it look to you?
**************************
Brian Hibbs has owned and operated Comix Experience in San Francisco since 1989, was a founding member of the Board of Directors of ComicsPRO, has sat on the Board of the Comic Book Legal Defense Fund, and has been an Eisner Award judge. Feel free to e-mail him with any comments. You can purchase two collections of the first Tilting at Windmills (originally serialized in Comics Retailer magazine) published by IDW Publishing, as well as find an archive of pre-CBR installments right here. Brian is also available to consult for your publishing or retailing program.


Thanks again for doing this Brian, I always enjoy these reports.
You normally provide a spreadsheet of the bookscan report for us to look at, but I’m not seeing one in this column.
Jamie – I fixed it.
The file is here. https://www.comicsbeat.com/wp-content/uploads/2017/03/Bookscan-16-Top-750_sheet.htm
Thanks Heidi!
Having glanced a preview selection for the latest “Dork Diaries,” I would definitely not classify those books as “comics.” They read more like traditional illustrated children’s/young readers books. Just having line art does not make a comic. Since comic books were born from comic strips, anything called a comic book today ought to have primarily sequential, paneled artwork.
As another observation, if you do keep the “Dork Diaries”, Rachel Renee Russell’s name appears twice in your highest grossing authors list. One at 1.3 million dollars is her name in a different order. Excellent analysis!
In regards to the recent Twitter/Iron Fist article; did you really just tell everyone off and then immediately close the comments? Bad form MacDonald, bad form.
A lot of comics fans are constantly whining (at least pre-Rebirth) about the so-called failures of DiDio and Lee, but we never know the big picture just looking at the monthly comics sales. Even though there are some perennial best sellers among DC’s books, the publishing arm of DCE is obviously doing something right, if they’re making this kind of impact on graphic novel sales.
@Douglas Waltz: Completely agree, man. Lectures someone about their privilege, then pulls her own. Shady and unfortunate.
I’m so happy to see Rania Telgemeir’s reign as the Queen of Comics continue. She’s sooooo talented!
Also, that Alan Moore guy seems to sell a lot of books for DC! No wonder they’re so obsessed with him…
My site, my rules. Also coming into the comments of major piece of comics research to whine? Classic sea lioning and v v bad form. Take it to twitter.
Nick: The thing about DORK DIARIES is there seem to be multiple-pages of “straight up comics” interspersed among the prose; that’s where my disconnect is.
Heidi: I’ve never heard of the term “sea lioning” before, so I learn something new each and every day! Though, knowing a few sea lions (they hang out all day at Pier 39 and the Cliff House), that doesn’t strike me as something those awesome mammals would do!
-B
Interesting that the number of books DC has in print seems to have fallen so much in the last two years. They really seem to have tightened their catalog in the last few years (maybe since Bob Wayne left? Or since the decision to move west?), with the occasional liquidation through Diamond being evidence (though not as common as Marvel’s liquidations). Plus most of the long-running Vertigo titles have consolidated their backlist into fewer, thicker books (PREACHER down to six books, LUCIFER down to five, Y THE LAST MAN down to five).
I’d be curious, if it’s not too much trouble to pull out, of the “6000 items that disappeared between BookScan 2015 and 2016”, what were the best-selling in 2015 to disappear, and are there any especially noteworthy ones that stand out (as in “why would they let that drop out of print?”).
Part of your “comic strip” problem is that some titles use the “Humor” BISACs…
HUM001000 HUMOR / Form / Comic Strips & Cartoons
This might be why the New York Times didn’t list many comic strip collections on their GN BS lists… they were filtered out.
Also, if you see CreateSpace titles with a CGN BISAC (they are the microbes on the flea on the Long Tail), most likely it is not a graphic novel.
Also… BISACs were radically altered this year for GNs… more JUV and YA codes.
COMICS & GRAPHIC NOVELS / Young Adult Fiction see headings under YOUNG ADULT FICTION / Comics & Graphic Novels
COMICS & GRAPHIC NOVELS / Juvenile Fiction see headings under JUVENILE FICTION / Comics & Graphic Novels
(Also “Non-Fiction”)
JUV008xxx JUV033070 JNF062xxx JNF049190 YAF010xxx YAF051050 YAN012xxx
Don’t seem like it is “oop” per se, but rather either 1) some sort of BISAC recoding or 2) some error on the part of my leaker. Or 3) something I have no idea how to parse!
The biggest book was SWORD ART ONLINE for just under (sold in *2015*) 14k copies, another volume of that at 8242, and a third at just over 5k, then it starts getting mostly into stuff that wouldn’t have made the 750 cutoff anyway (but could have impacted the long tail)
JJM did the calc for me, and I quote “I ran a formula against ISBN and found 6,013 items in the 2015 raw file that are not in 2016 (and 4,914 new items in 2016 that are not in 2015).The file is attached.
You¹ve mentioned the big titles missing; SWORD ART ONLINE is the biggest title not recurring.
All missing 2015 SKUs were worth 645k copies in total that year and $13.3 million.”
BUT, some of those were big books which I caught and had pulled (like MAUS, PERSEPOLIS, etc.).– these show in the final data. Remove those and it plummets to 361,622 and $7.2m “missing”
There’s a limit on how many ISBNs I can go back to my leaker for and ask them to go and manually look up, and I’m really less willing to do it on books that would seem to natively be under 5k.
-B
Thanks for the data crunching!
Some more scorecard notes:
PRHPS distributes:
Archie
Dark Horse
DC
IDW (starting in April)
Kodansha Comics
Kodansha USA (July… WHA?) Oh… that’s the “everything that’s not manga” English catalog.
Legendary
PRH Canada (Yes, there is a difference.)
Steerforth Press (Campfire)
Titan
Verso
http://www.penguinrandomhouse.biz/publisherservices/clients/index.html#
Technically, American Born Chinese is a First Second book.
Some show up as Roaring Brook, which oversaw FS when it launched.
From the Macmillan website:
Square Fish is a children’s book imprint representing the best of Farrar, Straus and Giroux, Henry Holt, and Roaring Brook backlists, but reformatted, repackaged, and reissued with a mass market children’s and teen audience in mind.
AND another BISAC code:
LIT017000 LITERARY CRITICISM / Comics & Graphic Novels
(Long tail… mostly academic treatises.)
Ah, sorry, that’s what I get for trying to do math in my head. I thought those 6000 “missing” books sold an average of 1000 copies in 2015, so there would be something significant in there, when actually it’s closer to 100 copies (60 copies when you pull in the big absences manually), so very unlikely to be anything significant.
I Whine, therefore I Fan.
p.s., looking forward to digging into another interesting installment of T.A.W.
My site, my rules. Also coming into the comments of major piece of comics research to whine? Take it to twitter.
Baby Names
Hi Brian,
Thanks for the research as always. I’m a big fan of this. .Couple of questions
1) How do the dollars and units sold for the top GNs in the direct market look vs the bookscan numbers?
2) Did Fantagraphics ever make the top 750 with their Peanuts collections?
Thanks again,
Brad
Maybe I missed something…but why are this numbers so much higer than the one Comichron have?
http://www.comichron.com/monthlycomicssales/2016.html
The first 3-in-1 edition of “Tintin” is “disturbingly low” because of those three one is juvenilia with very crude art and another is best known for being jaw-droppingly racist. Might be worth looking for some of the more popular later volumes to see if they were filed under a different BISAC?
Also pretty bad when you can’t tell the difference between a valid opinion and whining. And I just picked the first article with your name on it. No real planning on my part. I imagine you’ll just turn these off now? Have a blast with your site and your rules.
Torsten: Thanks for the new BISAC codes — I’ll have to look at YAF and YAN for next year; I’ve made a note to ask my source!
BradleyC: “1) How do the dollars and units sold for the top GNs in the direct market look vs the bookscan numbers?”
There’s already a lot of sources for DM numbers, I think John Jackson MIller’s ComicsChron is the best. Ironically, the message below you had the ’16 link — http://www.comichron.com/monthlycomicssales/2016.html
“2) Did Fantagraphics ever make the top 750 with their Peanuts collections?”
Also ironically, I was JUST emailing someone at FBI on this, and it looks like they are coded primarily as “Humor”, so are on the charts where (mostly) the strips go.
Superfan234: “Maybe I missed something…but why are this numbers so much higer than the one Comichron have?”
You might want to read the article again — JJM is tracking DM orders there, while this is sales through bookstores. Not the same thing at all.
LondonKdS: “The first 3-in-1 edition of “Tintin” is “disturbingly low” because of those three one is juvenilia with very crude art and another is best known for being jaw-droppingly racist. Might be worth looking for some of the more popular later volumes to see if they were filed under a different BISAC?”
The 3-in-one’s follow the SAME rules as pretty much ANY numbered series: the first volume invariably sells best, and everything drops from there. v1 sold 4226, v2 sold 2549, v3 sold 2403, all the way down to v6 which only manages a paltry 1491.
The softcovers go a little different because they’re not sequentially numbered. The best-seller appears to be (I don’t have the time to look up all 18 books, and figure out sequence) “Secret of the Unicorn” with just 2421 sold
-B
Yeah, i just realized.: This means the LCS market and the Bookscans are charts make an analizis on a separate market isn’t it?
>”BookScan says “Barnes & Noble, Amazon, Costco, General Independents, Hastings, Target, BJ’s, K-Mart, Hudson Group, Meijers, Follett Books, Books-A-Million, CEO Read, Powells, Toys R Us, Shoprite, SuperValu, Sam’s Club and Walmart are among our many data providers.” Walmart was only added to BookScan in 2013
>What sales do BookScan not track? Among others, this would include libraries, schools, specialty stores (like comic book stores!) and book clubs and fairs. BookScan does not track most sales at independent bookstores. For many books those are very very important sales channels, and thus, BookScan under-reports by some potentially significant degree, and don’t, in any way, represent all physical book sales or even all “book stores” selling comic book material.
Is incredible how big are the trades numbers outside the LCS, I never thought Gotham Academy could sell so much outside the regular market
“The first 3-in-1 edition of “Tintin” is “disturbingly low” because of those three one is juvenilia with very crude art and another is best known for being jaw-droppingly racist. Might be worth looking for some of the more popular later volumes to see if they were filed under a different BISAC?”
The US edition has neither of those stories, it goes from Tintin in America on:
https://www.amazon.com/Adventures-Tintin-America-Cigars-Pharaoh/dp/0316359408/
“Is incredible how big are the trades numbers outside the LCS,”
I dunno — there probably something like 5x as many book stores compared to comics stores.
-B
ABA membership: 1712 members with stores in 2227 locations [Wikipedia]
640 B&Ns
250 Books-A-Million
1800 Target locations
In 2013, PW calculated 12,703.
http://www.publishersweekly.com/pw/by-topic/industry-news/bookselling/article/57631-where-the-stores-are.html
Of course, the elephant in the room: most comics shops are specialty bookstores, but the owners don’t realize this.
The majority of comics shops in the US would never consider stocking the majority of titles that made the top 20. Maybe 3 out of the whole bunch? That’s a weird disconnect and money left on the table as we read about shops struggling to make rent.
Also, Brian. This is my favorite column.
Then, Douglas, please be polite to our host!
Joe: I disagree. Most every store I know carries a large majority of these titles.
-B
Oh, sorry. I didn’t realise that the US edition was less completist.
Brian – I give what I get, sorry.
Brian,
Thanks, thanks, thanks for doing this. It is eye opening work. However, this fan of the work of gifted creators like Brian Selznick, is still mystified by trying to figure out how well, or not, ‘The Marvels” did last year. Not knowing the sales of complex works that use different techniques for storytelling leaves one at a bit of a loss. Was also sorry that the incredible work of McKean in Black Dog, and Ugort The Ukrainian and Russian Notebooks did not do as well as one hoped. Though happy that S & S published them. BTW, does the Arrival continue to sell well?
You rock,
thanks,
Jessica
Brian, you’re a god of patience, thanks for the numbers-orgy. It is kind of heart- breaking to see excellent comics like Patience and Killing and Dying doing relatively poorly. I guess literary quality can’t compete with historical “relevance”. All good, all comics but still: makes me sad. Was expecting much bigger numbers from those flagship auteurs.
Jessica:
“THe Arrival” is on the Top 750 chart — 8995 sold.
Stunningly “Black Dog” only moved 436 through BookScan, BUT, that’s just 2 months on-sale, *and* I’m pretty sure it went OOP the week it when on-sale…. at least, we’ve not been able to successfully reorder copies through the DM..
Igort’s book didn’t do so well, either — BookScan shows just 1164 copies sold. This is why I keep trying to explain to people that OGNs are not inherently the best way to sell comics (which touches on Walt’s note, too). Being “off the market” for months (years) at a time, then coming along with a big chunk of pages doesn’t make the market respond to you especially well — JUST as true in the bookstore channel as it is in the DM….
-B
The mention of Tintin (and its disappointing numbers) make me wonder about other European classics in the U.S., like the Smurfs (published by Papercutz) and Asterix (published by Orion). Can it really be that none of these books sold 4000 copies? Or were they categorized by BISAC so they didn’t make this list?
No volume of SMURFS or ASTERIX sold north of 4k copies, no, through the stores that report to BookScan.
-B
I think the double Spider-Gwen Vol 1 listing is an error. Marvel collected the first Spider-Gwen series as Vol 0: Most Wanted?, and the first few issues of the second series as Vol 1: Greater Power.
Not that it affects your broader surmise about Marvel at all.
Databases care a little less about what the released title is as much as they do about about what the original point of data entry is..
-B
I would love to see School Book Fair totals … I recently helped at one , and at first I was kind of stunned on how many comicbook trades we were setting up the night before…I commented to the person in charge , and she said just watch , how they sell . Well after the 1st day the 6 books that sold out of their 25 copies were : Cyborg Vol 1 and 2 , the 2 DC Superhero Girls books , 2 of the Gotham Academy volumes . The comic related trades led the way , and by far and away were the best sellling books for the 3 day event
Comments are closed.