Gentleman, start your crunchers!
It’s a big change at Publishers Weekly this week, as they initiate a new way of running the bestsellers lists. As Sr. Editor Digital Media Jonathan Segura explains:
In addition to ranking the country’s bestselling books, our lists now also contain weekly and year-to-date unit sales figures from BookScan, which measures nearly 80% of the U.S. book market with 13,000 outlets reporting point-of-sale numbers. We’ll also be doing more lists—17 each week in the magazine, with extended coverage on our Web site. And as Nielsen develops e-book reporting relationships, we will provide similar information on digital sales.
On the following pages, you’ll find the bestseller categories you’ve always seen here (hardcover fiction and nonfiction, trade paper, mass market), and we’re now doing our children’s fiction and picture book bestseller lists every week (rather than monthly), plus 10 genre lists covering audiobooks (fiction and nonfiction combined), biography/autobiography, cookbooks, fantasy, graphic novels, history, mystery/detective, romance, science fiction, and suspense/thrillers. Over on our Web site, we’re running extended versions of most of these lists, including an overall list that tracks the top 100 bestselling books in the country. You can find all of that at publishersweekly.com/bestsellers.
While PW’s website is behind a paywall, this week’s top 25 graphic novel bestsellers WITH BOOKSCAN NUMBERS can be viewed here. All the lists are here.
As regular Beat readers know, BookScan numbers are generated via POS at approximately 80% of book-selling outlets. They do measure Amazon but not libraries or book fairs or several other outlets that sell lots and lots of books. BookScan is administered by A.C. Nielsen, the same company which does TV ratings and SoundScan, the record industry’s sales charts of record. Previously the only GN BookScan numbers that were available were Brian Hibbs’ leaked year-end numbers. This new pact between PW and Nielsen represents an exciting new way to look at the numbers:
As a taster, here’s the top 10.
Nielsen BookScan, week 21 of 2012, data through 05/27/2012
| Rank | Last Week | Weeks on List | Bibliographical Information | Pub Date | Units | 2012 YTD |
| 1 | 1 |
2 [history]
|
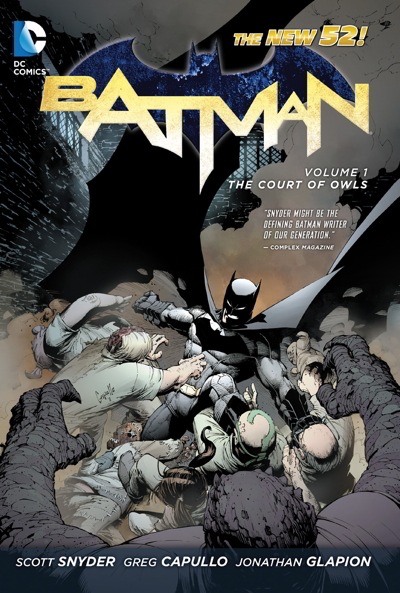
Batman Vol. 1: The Court of Owls (the New 52)
Scott Snyder / Author, Greg Capullo / Illustrator
DC Comics, (176)
978-1-4012-3541-3 review » » » |
May, 2012 | 1,369 | 4,379 |
| 2 | 2 | 4 |
Sailor Moon, Volume 5
Naoko Takeuchi / Author
Kodansha Comics, $10.99 (240)
978-1-61262-001-5
|
May, 2012 | 1,031 | 7,200 |
| 3 | 3 | 4 |
Naruto, Vol. 56 (Original)
Masashi Kishimoto / Author, Masashi Kishimoto / Illustrator
Viz Media, $9.99 (200)
978-1-4215-4207-2
|
May, 2012 | 1,014 | 6,348 |
| 4 | 6 | 3 |
DC Comics: The Ultimate Character Guide
Brandon T Snider / Author
DK Publishing (Dorling Kindersley), $16.99 (207)
978-0-7566-8261-3
|
Jul, 2011 | 979 | 4,978 |
| 5 | 4 | 3 |
Justice League Vol. 1: Origin (the New 52)
Geoff Johns / Author, Jim Lee / Illustrator
DC Comics, (192)
978-1-4012-3461-4 review » » » |
May, 2012 | 940 | 3,855 |
| 6 | – | 1 |
Green Lantern, Volume 1: Sinestro
Geoff Johns / Author, Doug Mahnke / Illustrator
DC Comics, $22.99 (160)
978-1-4012-3454-6
|
May, 2012 | 933 | 962 |
| 7 | – | 1 |
Catwoman, Volume 1: The Game
Judd Winick / Author, Guillem March / Illustrator
DC Comics, $14.99 (144)
978-1-4012-3464-5
|
May, 2012 | 709 | 724 |
| 8 | 8 | 18 |
Avatar: The Last Airbender – The Promise Part 1
Gene Yang / Author, Michael Dante DiMartino / Author, Brian Konietzko / Author, Bryan Dante Gurihiru / Author, Gurihiru / Illustrator, Bryan Gurihiru / Illustrator, Gene Luen Yang / Illustrator
Dark Horse Comics, $10.99 (80)
978-1-59582-811-8
|
Feb, 2012 | 690 | 15,075 |
| 9 | 5 | 2 |
Infinity Gauntlet
Jim Starlin / Author, George Perez / Illustrator, Ron Lim / Illustrator
Marvel Comics, $24.99
978-0-7851-5659-8
|
Sep, 2011 | 677 | 2,257 |
| 10 | – | 1 |
Uncanny X-Force: Otherworld
Rick Remender / Text by (Art/Photo Books), Greg Tocchini / Illustrator
Marvel Comics, $24.99 (136)
978-0-7851-6181-3
|
Jun, 2012 | 548 | 552 |
As you can see, it’s a great week for Viz and DC, with many of the New 52 collections taking spots on the list, and BATMAN VOL. 1 leading the list.
Now, I’ll be able to access these numbers in the future, but instead of writing about them here at The Beat, I’ll be analyzing them over at PW proper. However I wanted to give you a little taste of what’s in store.
And before anyone faints, please note…yes, we know THESE NUMBERS ARE LOW. These ARE the actual, real BookScan numbers, but as we noted above, many outlets are not included in these numbers. So some books may be selling double or triple these numbers.
As with Diamond’s numbers, these are a metric. A useful one, but a limited one.


Has “The Beat” ever seen evidence that 80% of book sellers participate in book scan? I’ve never met a retailer that did. I’ve worked in at least 10 “superstores” none of which did just curious if you’ve seen numbers or if that is just what Nielson says? (Because I’ve been a “Nielson family” and their TV numbers are just made up horse poo.)
I don’t think I’ve seen Bookscan claim 80% before — it’s generally been closer to two-thirds. No Wal-Mart, etc.
This does appear to cover the same period that was released to authors last Thursday by Amazon, BTW.
It looks like Brian’s end-of-year file will still be superior to trying to cook something from these individual weeks — the data capture will only be for books that made the Top 25, and if something isn’t on the list at the end of the year, its figures won’t be complete. But it’s nice to see the tables.
Sailor Moon is still popular? last time i saw/read this was in MS and had a crush on Sailor Mercury XD…I was a pathetic little nerd.
JJM- I’ve been out of book stores for 5 years but when I was in, I would hear 40% was a stretch. I know that a lot of Borders stores did not report. But, since they are all closed, if B&N and BAM did report then I guess that would bump it closer to 80% of what is left of book stores.
And, one more thing I’ll say is that sales at the register do not equal dollars. It’s not books sold that matter. It’s books not returned. You pay for what you don’t return so you really hope those books sold. As opposed to having been stolen or becoming a shop worn clearance item.
Nielsen’s own press releases claim 75% coverage. For example, from http://www.nielsen.com/us/en/insights/press-room/2011/wall-street-journal-to-debut-ebook-bestseller-lists-provided-by-nielsen.html
“Nielsen BookScan, which monitors the English-language book industry worldwide, gathers point-of-sale book data from about 12,000 locations across the U.S., representing about 75% of the nation’s book sales.”
“I’ve been out of book stores for 5 years but when I was in, I would hear 40% was a stretch. I know that a lot of Borders stores did not report.”
I would assume that reporting was done on the corporate level, not on the individual store level, no?
-B
“And before anyone faints, please note…yes, we know THESE NUMBERS ARE LOW. These ARE the actual, real BookScan numbers, but as we noted above, many outlets are not included in these numbers. So some books may be selling double or triple these numbers.”
I’m curious, what are you comparing these numbers to that makes you describe them as low? This represents the number of copies sold last week through most outlets in the U.S., minus comics shops (a significant omission) and WalMart (not usually a significant omission, though it is in the case of Sailor Moon, which I’m involved with, and which is stocked at WalMart). There are books on the list selling 4-5000 copies per month, numbers that any publisher would be delighted about.
Perhaps you’re comparing it to the Diamond graphic novel numbers? If so, it’s an apples-to-oranges comparison. The Diamond number represents the number of copies sold to shops, not to customers, while the Bookscan numbers represent copies sold to customers.
Since most graphic novels aren’t in book clubs and WalMart (I haven’t been in a Walmart for ~6 months… have more popped up recently?), the big market missing here is libraries.
I think you’re overestimating the accuracy of these numbers for graphic novels. My rule of thumb for graphic novels is to multiply bookscan numbers by about 4 – and that’ll give you a general sense of the actual sales of the book. It varies by publisher, obviously: some publishers do more of their business in the trade (bookstores) and others do more in the direct market / specialty world (comic book stores and etc) and still others focus on the library market. But yeah, if bookscan tells me a book has sold 2,500? I assume it’s more like 10,000.
Yikes! So many voices!
I got the 80% figure from Jonathan Segura who wrote the preamble to the numbers.
Dallas: I base that on things like Callista’s comment! Even today at BEA I heard people talking about how BookScan is consistently low.
So, like I said: take with a grain of salt, but the TRENDS are accurate.
Also, so many comments about the NY Times GN best sellers lists today! Oh my.
Wait, the best selling Marvel graphic novel is the Infinity Gauntlet?! I can only assume this is from people trying to learn who this Thanos guy is.
It’s uncanny. No matter the disclaimers or qualifications, 90% of comments on any article on sales numers will be to dispute them.
Me, I’m happy to see Avatar: The Last Airbender–The Promise doing well. Excellent book both as a continuation of the series and as a comic.
Niels – you’re not wrong. :) But that’s sort of the nature of the beast. Sales numbers are hard even for publishers to accurately track sometimes, and talking publicly about them is a fraught venture at best.
I agree with you about that Avatar book on all counts, btw. :)
Also, I should have said first: I personally (and I am not speaking for my company here) think this is a step in the right direction. As inaccurate as those numbers are, they’re better than no numbers at all.