
It looks like about 69% of comics-and-trade dollars this year are coming from comics; put another way, this year Diamond has grossed from comics 2.25 times what it’s grossed from trade paperbacks. Back when Diamond stopped running its sector market shares, in 2002, comics dollars outpaced trade dollars 3.5 to 1. A lot’s changed, but no parity yet.
From this calculation, we can estimate what was bubbling under. The roughly $35 million in Direct Market orders in October breaks down to about $24 million for comic books, and $11 million for trade paperbacks. That means that the “long tail” in comics amounts to between $3-4 million this month; applying the average weighted cover price, that’s close to a million more comic books falling outside the Top 300. That’s higher than even I would have expected, but remember that the table includes reorders, now, and so basically all of September’s and August’s Top 300 chart items are still there, selling copies, out of sight on the current month’s table. Historically, a rate of 8% is an often-cited figure for typical reorders; that, plus new comics not reaching the Top 300, could easily make up the unseen balance.
Unit sales are less useful with trades, but Diamond appears to have sold 12.4 times as many comic books in October as it sold trade paperbacks; this would be consistent with the revenue breakdowns, reflecting the fact that the average trade paperback costs four to five times what the average comic book does. It also suggests that Diamond moved about half a million trade paperbacks this month, nearly half the volume of which were outside the Top 300.
Much more of this sort of analysis in the link, and a topic sure to be explored even further down the road.
Miller also has his direct sales estimates for October up here. We’ll comb over it for signs of health and diversity over the next few days.

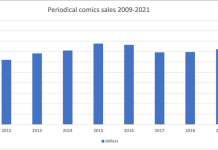

It looks like about 69% of comics-and-trade dollars this year are coming from comics; put another way, this year Diamond has grossed from comics 2.25 times what it’s grossed from trade paperbacks.
And there, in a nutshell, is the reason why publishers still put out the monthlies, despite various Internet pundits proclaiming their death every day since 2002 or so. Obviously their share of the market is declining, but they’re far from dead yet.
New Vertigo graphic novels appearing in the Top 300 GN list, via ICv2:
October:
#11 Northlanders v.4
#23 Hellblazer India
September:
#9 American Vampire v.1 (HC)
August:
#2 Cinderella: From Fabletown With Love
#3 Unwritten v.2
#20 Fogtown (HC)
#28 Dark Rain (HC)
July:
#23 House of Mystery v.4
(The July list was dominated by Scott Pilgrim and Blackest Night.)
June:
#8 DMZ v.8
#9 Jack of Fables v.7
#17 Neil Young’s Greendale (HC)
#26 Hellblazer Hooked
Aside from Americn Vampire, the other hardcovers were original content.
Of course, we’re talking about Diamond COMICS, not Diamond BOOKS. ICv2 reports that as an industry, books outsell comics.
http://www.icv2.com/articles/news/17291.html
“While periodical comics still dominate sales in the direct market, when all channels are included, sales of graphic novels represented 54% of the $680 million combined total.”
Graphic novels have outsold periodical comics since 2005, according to ICv2’s data.
Oh, and I don’t need to remind my fellow comicologists that much of what Vertigo publishes is aimed at the bookshelf market.
Periodical paper comics ARE doomed. People will read the monthly issues in a digital format, or wait for the trade (or order a print-on-demand edition).
Whoops… put two comments together… oh well, one proves the other.
We’ll want to see a few more months of these numbers to see whether the breakdown observed this month is typical. And, yes, the trade picture is very different in the rest of the market, where the periodical and finding-out-what-happens-first is not a big deal.
The breakdown numbers alone don’t prescribe anything for the future of the market — although, obviously, since the vast majority of what the bookstores sell is content funded through serial installments, any different model would require some way of subsidizing production. This is why I tend to prefer the “collected edition” term to “graphic novel”, as it reminds us that, in comics, we’re mostly still in the era where novels are appearing serialized in magazines.
The other point of all of this is that the comics total is a little larger through Diamond than we thought it was. ICV2’s 2009 figure appears to estimate industry-wide periodical sales of $312 million: If the 70/30 breakdown obtains at Diamond, then it’s closer to $300 million in comics there, plus another $30-40 mil from newsstand and subscriptions. That’d make it almost exactly half-and-half overall.
But, yeah, when manga were doing better, the ratio was more in books’ favor.
Much thanks for bringing some reality and actual numbers to the discourse on format.
In a sane world, these insights would put a stop to the constant barrage of, “Floppies are dead, do you hear me DEAD!” posts and ‘manifestos’…but since this is the comics blogosphere, I won’t be holding my breath.
@Torsten – 46% means doomed?
not one comic sold over 100,000 issues. WOW