by David Carter
Please refer to the July 2015 column for a preamble and explanation as to why sales standards for Image books are likely to be different than those for DC or Marvel.
Image shipped 52 comics in April, compared to 59 in March, 49 in February, 45 in January, 47 in December, 48 in November, 55 in October and 52 in September. They shipped 51 in April 2016.
So, it looks like theme variants are a thing now at Image? This month’s theme is April Fools. For those titles participating in the theme variants, the addition or subtraction of one tends to have more of an affect on sales than the normal month-to-month variance (much like with DC’s theme variant phase a couple of years ago).
Warning: The commentary below may contain reasoned analysis, speculation (unfounded and otherwise), opinion, and/or snark. Those looking for a more straightforward analysis are directed to John Jackson Miller’s excellent Comichron analysis, posted in May over at Comichron!
Please consider the fine print at the end of the column. Thanks to Milton Griepp and ICv2.com for the permission to use their figures. An overview of ICv2.com’s estimates can be found here.
(Note that the percentage comparisons are done with total orders including reorder activity, as opposed to initial orders.)
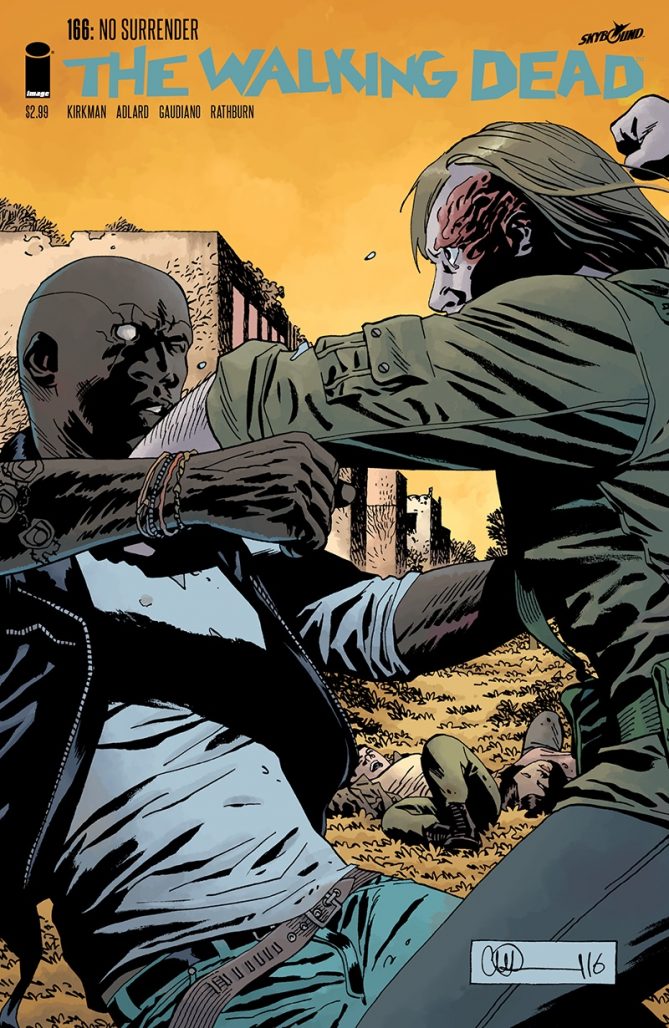
10 - THE WALKING DEAD ($2.99)
04/2007: The Walking Dead #36  --  21,291
04/2012: The Walking Dead #96  --  36,931
04/2013: The Walking Dead #109 --  90,362
04/2014: The Walking Dead #125 --  66,761  [66,782]
04/2014: The Walking Dead #126 --  67,853  [68,647]
04/2015: The Walking Dead #140 --  66,553
-----------------------------------------
04/2016: The Walking Dead #153 --  67,358 (+  0.1%)
05/2016: The Walking Dead #154 --  68,922 (+  2.3%)
06/2016: The Walking Dead #155 --  71,755 (+  4.1%)
07/2016: The Walking Dead #156 --  76,355 (+  6.4%)
08/2016: The Walking Dead #157 --  97,689 (+ 37.0%) [104,596]
09/2016: The Walking Dead #158 --  94,316 (-  9.8%)
10/2016: The Walking Dead #159 --  91,291 (-  3.2%)
11/2016: The Walking Dead #160 --  88,367 (-  3.2%)
12/2016: The Walking Dead #161 --  85,459 (-  3.3%)
01/2017: The Walking Dead #162 --  85,395 (-  0.1%)
02/2017: The Walking Dead #163 -- 750,000 (+778.3%) **
02/2017: The Walking Dead #164 --  83,999 (- 88.8%)
03/2017: The Walking Dead #165 --  70,422 (- 16.2%)
04/2017: The Walking Dead #166 --  68,205 (-  3.1%)
-----------------
6 months: - 25.3%
1 year  : +  1.3%
2 years : +  2.5%
5 years : + 84.7%
10 years: +220.3%
Back to standard attrition after months of variant covers and other shenanigans.
—
67 - SEVEN TO ETERNITY ($3.99)
09/2016: Seven to Eternity #1  -- 32,790           [39,394]
10/2016: Seven to Eternity #2  -- 27,968 (- 29.0%)
11/2016: Seven to Eternity #3  -- 26,669 (-  4.6%)
12/2016: Seven to Eternity #4  -- 25,729 (-  3.5%)
01/2017: --
02/2017: --
03/2017: --
04/2017: Seven to Eternity #5  -- 32,667 (+ 27.0%)
-----------------
6 months: + 16.8%
Returns from hiatus with a pretty sizable increase. This is the sort of sales behavior that you hope for when you release a bargain-priced first trade collection. (Multiple covers help as well.)
—
80 - PAPER GIRLS ($2.99)
04/2016: --
05/2016: --
06/2016: Paper Girls #6  -- 36,385 (-  2.2%)
07/2016: Paper Girls #7  -- 35,392 (-  2.7%)
08/2016: Paper Girls #8  -- 33,731 (-  4.7%)
09/2016: Paper Girls #9  -- 32,320 (-  4.2%)
10/2016: Paper Girls #10 -- 32,119 (-  0.6%)
11/2016: --
12/2016: --
01/2017: --
02/2017: Paper Girls #11 -- 30,562 (-  4.8%)
03/2017: Paper Girls #12 -- 29,047 (-  5.0%)
04/2017: Paper Girls #13 -- 27,993 (-  3.6%)
-----------------
6 months: - 12.8%
1 year  :    n.a.
The joys of standard attrition.
—
102 - REDNECK ($3.99)
04/2017: Redneck #1  -- 22,317
108 - ROSE ($3.99)
04/2017: Rose #1  -- 20,499
A couple of debuts fairly close to each other. Both had not only variants, but Gold Foil variants. So yes, it is the 90s all over again. Both also had second printings in May.
—
109 - I HATE FAIRYLAND ($3.99)
04/2016: --
05/2016: --
06/2016: I Hate Fairyland #6  -- 26,095 (+  5.3%)
07/2016: I Hate Fairyland #7  -- 23,742 (-  9.0%)
08/2016: I Hate Fairyland #8  -- 22,562 (-  5.0%)
09/2016: I Hate Fairyland #9  -- 21,265 (-  5.7%)
10/2016: I Hate Fairyland #10 -- 20,534 (-  3.4%)
11/2016: --
12/2016: --
01/2017: --
02/2017: --
03/2017: I Hate Fairyland #11 -- 18,606 (-  9.4%)
04/2017: I Hate Fairyland #12 -- 19,664 (+  5.7%)
-----------------
6 months: -  4.2%
1 year  :    n.a.
The rise is likely due to the April Fool variant (in addition to its regular variant).
—
110 - KILL OR BE KILLED ($3.99)
08/2016: Kill or Be Killed #1  -- 30,050
09/2016: Kill or Be Killed #2  -- 23,812 (- 20.8%)
10/2016: Kill or Be Killed #3  -- 23,883 (+  0.3%)
11/2016: Kill or Be Killed #4  -- 22,889 (-  4.2%)
12/2016: --
01/2017: Kill or Be Killed #5  -- 21,261 (-  7.1%)
02/2017: Kill or Be Killed #6  -- 26,312 (+ 23.8%)
03/2017: Kill or Be Killed #7  -- 22,957 (- 12.8%)
04/2017: Kill or Be Killed #8  -- 19,616 (- 14.6%)
-----------------
6 months: - 17.9%
A kind of biggish drop. Not that 19K at eight issues in is bad or anything, but at this point a drop should be closer to standard attrition levels (neither issue seven nor eight had variants).
—
111 - BLACK CLOUD ($3.99)
04/2017: Black Cloud #1  -- 19,583
114 - PLASTIC ($3.99)
04/2017: Plastic #1  -- 18,980
Two more debuts. Plastic had both a regular variant and an April Fools variant, while Black Cloud apparently had neither. Both had second printings in May.
—
169, 243 - SEX CRIMINALS ($3.99/$4.69)
04/2014: --
04/2015: --
--------------------------
04/2016: Sex Criminals #15 -- 25,937 (-  1.9%)
05/2016: --
06/2016: --
07/2016: --
08/2016: --
09/2016: --
10/2016: --
11/2016: --
12/2016: --
01/2017: --
02/2017: Sex Criminals #16 -- 22,494 (- 13.3%)
03/2017: Sex Criminals #17 -- 19,020 (- 15.4%)
04/2017: Sex Criminals #18 -- 17,716 (-  6.9%)
-----------------
6 months:    n.a.
1 year  : - 31.7%
2 years :    n.a.
Combined sales for the regular and XXX variants.
—
122 - MONSTRESS ($3.99)
04/2016: Monstress #5  -- 21,820 (-  2.6%)
05/2016: Monstress #6  -- 20,850 (-  4.4%)
06/2016: --
07/2016: --
08/2016: --
09/2016: --
10/2016: Monstress #7  -- 20,799 (-  0.2%)
11/2016: Monstress #8  -- 18,830 (-  9.5%)
12/2016: Monstress #9  -- 17,515 (-  7.0%)
01/2017: --
02/2017: Monstress #10 -- 19,345 (+ 10.4%)
03/2017: --
04/2017: Monstress #11 -- 16,757 (- 13.4%)
-----------------
6 months: - 19.4%
1 year  : - 23.2%
Back to normal without the variant.
—
126 - GOD COUNTRY ($3.99)
01/2017: God Country #1 of 6 -- 14,322           [19,357]
02/2017: God Country #2 of 6 -- 17,701 (-  8.6%)
03/2017: God Country #3 of 6 -- 15,321 (- 13.4%)
04/2017: God Country #4 of 6 -- 16,174 (+  5.8%)
There have been multiple printings of each issue, so I think this is growth based on actual demand.
—
131 - THE BLACK MONDAY MURDERS ($4.99)
08/2016: Black Monday Murders #1  -- 26,696
09/2016: Black Monday Murders #2  -- 19,749 (- 26.0%)
10/2016: Black Monday Murders #3  -- 18,371 (-  7.0%)
11/2016: Black Monday Murders #4  -- 17,718 (-  3.6%)
12/2016: --
01/2017: --
02/2017: --
03/2017: --
04/2017: Black Monday Murders #5  -- 15,655 (- 11.6%)
-----------------
6 months: - 14.8%
The dangers of a long hiatus…
—
132 - SPAWN ($2.99)
04/2007: --
04/2012: Spawn #218      -- 12,680
04/2013: Spawn #230      -- 15,994
04/2014: Spawn #242      -- 11,827
04/2015: Spawn #251      -- 17,443
----------------------------------
04/2016: Spawn #262      -- 18,775 (+ 10.8%)
05/2016: Spawn #263      -- 16,109 (- 14.2%)
06/2016: --
07/2016: Spawn #264      -- 17,157 (+  6.5%)
08/2016: Spawn #265      -- 15,927 (-  7.2%)
09/2016: --
10/2016: Spawn #266      -- 22,304 (+ 40.0%)
11/2016: Spawn #267      -- 16,976 (- 23.9%)
12/2016: Spawn #268      -- 16,652 (-  1.9%)
01/2017: Spawn #269      -- 16,257 (-  2.4%)
02/2017: Spawn #270      -- 15,778 (-  2.9%)
03/2017: Spawn #271      -- 15,517 (-  1.7%)
04/2017: Spawn #272      -- 15,400 (-  0.8%)
-----------------
6 months: - 31.0%
1 year  : - 18.0%
2 years : - 12.3%
5 years : + 21.5%
10 years:    n.a.
—
143 - RAT QUEENS ($3.99)
04/2014: --
04/2015: Rat Queens #10 -- 14,228
---------------------------------
04/2016: --
05/2016: Rat Queens #16 -- 12,092 (+  0.8%)
06/2016: --
07/2016: --
08/2016: --
09/2016: --
10/2016: --
11/2016: --
12/2016: --
01/2017: --
02/2017: --
03/2017: Rat Queens #1  -- 22,461 (+ 85.7%)
04/2017: Rat Queens #2  -- 14,057 (- 37.4%)
-----------------
6 months:    n.a.
1 year  :    n.a.
2 years : -  1.2%
—
144 - OLD GUARD ($3.99)
02/2017: Old Guard #1  -- 23,867
03/2017: Old Guard #2  -- 17,991 (- 24.6%)
04/2017: Old Guard #3  -- 13,978 (- 22.3%)
—
145 - BITCH PLANET ($3.99)
04/2015: Bitch Planet #4  -- 21,569
-----------------------------------
04/2016: --
05/2016: --
06/2016: Bitch Planet #8  -- 18,158 (+  2.5%)
07/2016: --
08/2016: --
09/2016: --
10/2016: --
11/2016: Bitch Planet #9  -- 15,340 (- 15.7%)
12/2016: --
01/2017: --
02/2017: --
03/2017: --
04/2017: Bitch Planet #10 -- 13,922 (-  9.0%)
-----------------
6 months:    n.a.
1 year  :    n.a.
2 years : - 28.9%
Pretty much the exemplar of the adverse effects of an irregular shipping schedule on issue sales. 14K is still a good number for an Image series, and the collected editions are doing quite well, so no worries. But with a more regular schedule, Bitch Planet might have been a Saga-level success.
This is the end of the second story arc; next up is an anthology series, during which maybe the regular creative team will get a few issues in the bag for a more regular schedule?
—
148 - DESCENDER ($3.99)
04/2015: Descender #2  -- 43,946  [41,853]
--------------------------------
04/2016: --
05/2016: --
06/2016: Descender #12 -- 19,782 (+  5.0%)
07/2016: Descender #13 -- 17,783 (- 10.1%)
08/2016: Descender #14 -- 17,296 (-  2.7%)
09/2016: Descender #15 -- 16,386 (-  5.3%)
10/2016: Descender #16 -- 15,963 (-  2.6%)
11/2016: --
12/2016: Descender #17 -- 15,296 (-  4.2%)
01/2017: Descender #18 -- 14,526 (-  5.0%)
02/2017: Descender #19 -- 15,753 (+  8.4%)
03/2017: Descender #20 -- 13,974 (- 11.3%)
04/2017: Descender #21 -- 13,743 (-  1.7%)
-----------------
6 months: - 13.9%
1 year  :    n.a.
2 years : - 67.2%
—
150 - ROYAL CITY ($3.99)
03/2017: Royal City #1  -- 24,597
04/2017: Royal City #2  -- 13,721 (- 44.2%)
The lack of variant covers leads to a percentage drop a bit larger than normal for the second issue.
—
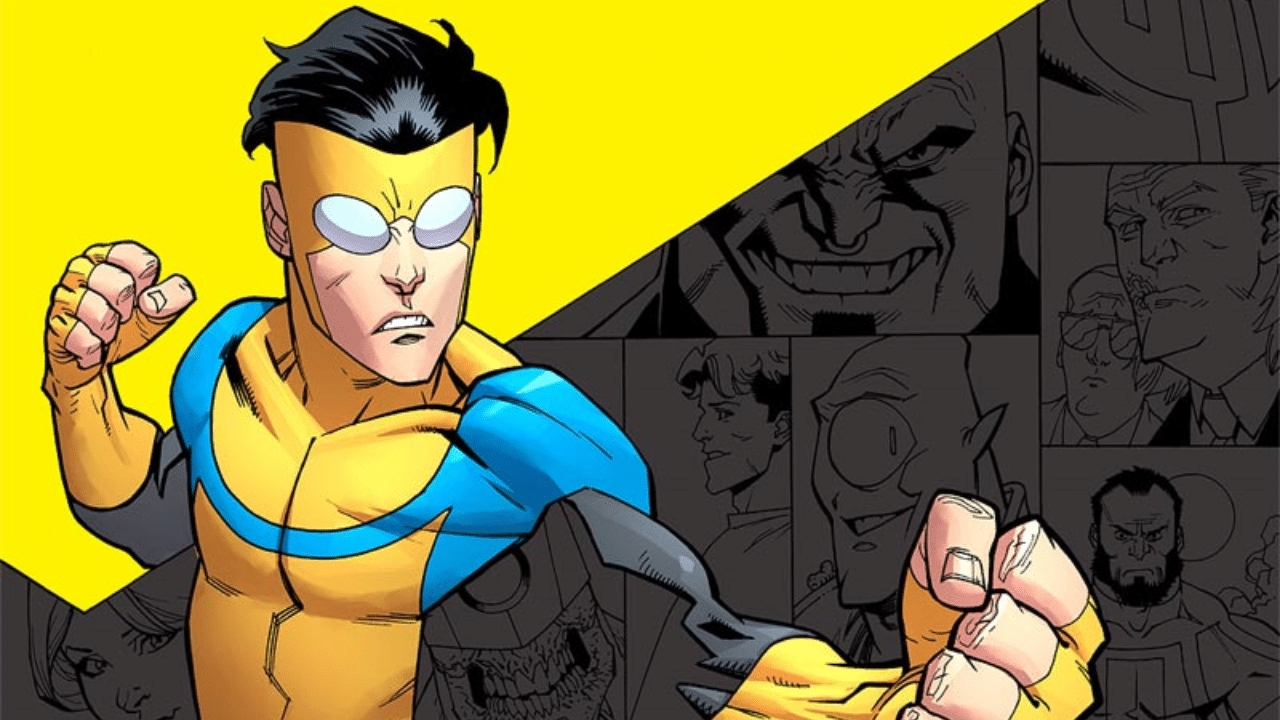
152 - INVINCIBLE ($2.99)
04/2007: Invincible #40  -- 13,230
04/2012: Invincible #90  -- 14,393
04/2013: Invincible #102 -- 15,249
04/2014: Invincible #110 -- 12,557
04/2015: Invincible #119 -- 13,492
----------------------------------
04/2016: Invincible #127 -- 12,038 (-  3.2%)
05/2016: Invincible #128 -- 11,982 (-  0.5%)
06/2016: Invincible #129 -- 12,510 (+  4.4%)
07/2016: --
08/2016: Invincible #130 -- 11,921 (-  4.7%)
09/2016: --
10/2016: --
11/2016: Invincible #131 -- 11,579 (-  2.9%)
12/2016: --
01/2017: --
02/2017: Invincible #132 -- 11,505 (-  0.6%)
02/2017: Invincible #133 -- ??????
03/2017: Invincible #134 -- 11,605
04/2017: Invincible #135 -- 13,658 (+ 17.7%)
-----------------
6 months:    n.a.
1 year  : + 13.5%
2 years : +  1.2%
5 years : -  5.1%
10 years: +  3.2%
Adds an April Fools variant, gets a sales boost.
—
156 - THE WICKED + THE DIVINE ($3.99)
04/2015: --
--------------------------------------
04/2016: Wicked + Divine #18 -- 17,722 (-  4.1%)
05/2016: Wicked + Divine #19 -- 16,929 (-  4.4%)
06/2016: Wicked + Divine #20 -- 17,831 (+  5.3%)
07/2016: Wicked + Divine #21 -- 16,283 (-  8.7%)
08/2016: Wicked + Divine #22 -- 15,969 (-  1.9%)
09/2016: W + D 1831 one-shot -- 16,408 (+  2.7%)
10/2016: --
11/2016: Wicked + Divine #23 -- 15,238 (-  7.1%)
12/2016: Wicked + Divine #24 -- 14,666 (-  3.8%)
01/2017: Wicked + Divine #25 -- 14,164 (-  3.4%)
02/2017: Wicked + Divine #26 -- 15,651 (+ 10.5%)
03/2017: Wicked + Divine #27 -- 14,589 (-  6.8%)
04/2017: Wicked + Divine #28 -- 13,045 (- 10.6%)
-----------------
6 months:    n.a.
1 year  : - 26.4%
2 years :    n.a.
No theme variant (just the regular variant) = a larger than normal drop this time out.
—
165 - CURSE WORDS ($3.99)
01/2017: Curse Words #1  -- 18,162
02/2017: Curse Words #2  -- 15,248 (- 16.0%)
03/2017: Curse Words #3  -- 12,116 (- 20.5%)
04/2017: Curse Words #4  -- 12,219 (+  0.9%)
The April Fools theme cover variant offsets a potential drop.
—
168 - EXTREMITY ($3.99)
03/2017: Extremity #1  -- 17,917
04/2017: Extremity #2  -- 11,973 (- 33.2%)
In line with second issue expectations.
—
171 - BLACK SCIENCE ($3.99)
04/2014: Black Science #5  -- 25,492
04/2014: Black Science #6  -- 24,892
04/2015: Black Science #13 -- 17,876
------------------------------------
04/2016: --
05/2016: --
06/2016: --
07/2016: Black Science #22 -- 12,829 (-  2.0%)
08/2016: Black Science #23 -- 12,466 (-  2.8%)
09/2016: Black Science #24 -- 11,810 (-  5.3%)
10/2016: Black Science #25 -- 11,425 (-  3.3%)
11/2016: --
12/2016: Black Science #26 -- 11,041 (-  3.4%)
01/2017: Black Science #27 -- 10,631 (-  3.7%)
02/2017: Black Science #28 -- 10,478 (-  1.4%)
03/2017: --
04/2017: Black Science #29 -- 11,542 (+ 10.2%)
-----------------
6 months: +  1.0%
1 year  : - 35.4%
2 years :    n.a.
Adds an April Fools variant, gets a sales boost.
—
176 - LOW ($3.99)
04/2015: --
--------------------------
04/2016: Low #13 -- 13,956 (-  3.7%)
05/2016: --
06/2016: Low #14 -- 13,903 (-  0.4%)
07/2016: --
08/2016: Low #15 -- 12,955 (-  6.8%)
09/2016: --
10/2016: --
11/2016: --
12/2016: --
01/2017: --
02/2017: --
03/2017: Low #16 -- 13,478 (+  4.0%)
04/2017: Low #17 -- 10,915 (- 19.0%)
-----------------
6 months:    n.a.
1 year  : - 21.8%
2 years :    n.a.
You guessed it: no theme variant this month.
—
179 - ROCK CANDY MOUNTAIN ($3.99)
04/2017: Rock Candy Mtn #1  -- 10,794
The debut issue of Kyle Stark’s new comic has an April Fools variant.
—
206 - INJECTION ($2.99)
04/2016: Injection #9  -- 11,433 (-  3.6%)
05/2016: --
06/2016: Injection #10 -- 11,771 (+  3.0%)
07/2016: --
08/2016: --
09/2016: --
10/2016: --
11/2016: --
12/2016: --
01/2017: --
02/2017: --
03/2017: Injection #11 --  9,052 (- 23.1%)
04/2017: Injection #12 --  8,615 (-  4.8%)
-----------------
6 months:    n.a.
1 year  : - 24.6%
—
224 - MOTOR CRUSH ($3.99)
12/2016: Motor Crush #1  -- 21,801
01/2017: Motor Crush #2  -- 12,643 (- 42.0%)
02/2017: Motor Crush #3  --  9,757 (- 22.8%)
03/2017: Motor Crush #4  --  9,071 (-  7.0%)
04/2017: Motor Crush #5  --  7,065 (- 22.1%)
No theme variant (just the regular variant) = a larger than normal drop this time out.
—
237 - GREEN VALLEY ($2.99)
10/2016: Green Valley #1 of 9 -- 16,091
11/2016: Green Valley #2 of 9 --  9,713 (- 39.6%)
12/2016: Green Valley #3 of 9 --  8,219 (- 15.4%)
01/2017: Green Valley #4 of 9 --  7,553 (-  8.1%)
02/2017: Green Valley #5 of 9 --  7,187 (-  4.8%)
03/2017: Green Valley #6 of 9 --  7,204 (+  0.2%)
04/2017: Green Valley #7 of 9 --  6,842 (-  5.0%)
-----------------
6 months: - 57.5%
—
258 - COPPERHEAD ($3.99)
04/2015: Copperhead #6  -- 10,148
---------------------------------
04/2016: --
05/2016: --
06/2016: --
07/2016: --
08/2016: --
09/2016: --
10/2016: --
11/2016: --
12/2016: --
01/2017: --
02/2017: --
03/2017: Copperhead #11 --  6,369 (- 26.5%)
04/2017: Copperhead #12 --  5,517 (- 13.4%)
-----------------
6 months:    n.a.
1 year  :    n.a.
2 years : - 45.6%
—
262 - THE BEAUTY ($3.99)
04/2016: --
05/2016: The Beauty #7  --  9,178 (- 13.4%)
06/2016: The Beauty #8  --  9,577 (+  4.3%)
07/2016: The Beauty #9  --  8,340 (- 12.9%)
08/2016: --
09/2016: The Beauty #10 --  7,986 (-  4.2%)
10/2016: The Beauty #11 --  7,210 (-  9.7%)
11/2016: --
12/2016: --
01/2017: --
02/2017: The Beauty #12 --  6,179 (- 14.3%)
03/2017: The Beauty #13 --  6,067 (-  1.8%)
04/2017: The Beauty #14 --  5,465 (-  9.9%)
-----------------
6 months: - 24.2%
1 year  :    n.a.
—
265 - THE FEW ($4.99)
01/2017: The Few #1 of 6 -- 10,571
02/2017: The Few #2 of 6 --  8,431 (- 20.2%)
03/2017: The Few #3 of 6 --  6,067 (- 28.0%)
04/2017: The Few #4 of 6 --  5,119 (- 15.6%)
—
276 - BLACK ROAD ($3.99)
04/2016: Black Road #1  -- 16,572
05/2016: Black Road #2  -- 10,131 (- 38.9%)
06/2016: Black Road #3  -- 10,484 (+  3.5%)
07/2016: Black Road #4  --  7,292 (- 30.4%)
08/2016: Black Road #5  --  6,912 (-  5.2%)
09/2016: --
10/2016: --
11/2016: --
12/2016: --
01/2017: Black Road #6  --  5,748 (- 16.8%)
02/2017: Black Road #7  --  5,340 (-  7.1%)
03/2017: Black Road #8  --  5,030 (-  5.8%)
04/2017: Black Road #9  --  4,809 (-  4.4%)
-----------------
6 months:    n.a.
1 year  : - 64.9%
—
280 - LOOSE ENDS ($3.99)
01/2017: Loose Ends #1 of 4 -- 10,847
02/2017: Loose Ends #2 of 4 --  5,858 (- 46.0%)
03/2017: Loose Ends #3 of 4 --  4,912 (- 16.1%)
04/2017: Loose Ends #4 of 4 --  4,672 (-  4.9%)
—
283 - UNDERWINTER ($3.99)
03/2017: Underwinter #1  -- 10,555
04/2017: Underwinter #2  --  4,576 (- 56.6%)
—
287 - ECLIPSE ($3.99)
09/2016: Eclipse #1  -- 12,375
10/2016: Eclipse #2  --  7,764 (- 37.3%)
11/2016: Eclipse #3  --  6,818 (- 12.2%)
12/2016: Eclipse #4  --  5,762 (- 15.5%)
01/2017: --
02/2017: --
03/2017: Eclipse #5  --  ????? (< 4,812)
04/2017: Eclipse #6  --  4,486
-----------------
6 months: - 42.2%
—
300 - MAGDELENA ($3.99)
04/2012: --
--------------------------------
03/2017: Magdalena #1  --  7,567 (+ 52.0%)
04/2017: Magdalena #2  --  4,244 (- 43.9%)
-----------------
5 years :    n.a.
—
Image titles shipping but not making the Top 300 in March (cutoff at 4,244) include: Circuit Breaker, Drifter, Elephantmen, Hadrian’s Wall, Horizon, Mirror, Planetoid Praxis, Savage Dragon, She Wolf, Sons of the Devil, Stray Bullets, Sun Bakery, They’re Not Like Us, Think Tank, Throwaways.
Note that this doesn’t necessarily mean that any of them are in danger of being cancelled; there are many reasons that the creators of these books may desire to keep them going.
The Fine Print (Disclaimers, et cetera)
The numbers above are estimates for comic-book sales in the North American direct market, as calculated by ICv2.com according to the chart and index information provided by Diamond Comic Distributors.
ICv2.com’s estimates are somewhat lower than the actual numbers, but they are consistent from month to month, so the trends they show are fairly accurate. Since it’s a “month-to-month” column, the comments, unless otherwise noted, are on the most recent month.
Bear in mind that the figures measure sales of physical comics to retailers, not customers. Also, these numbers do not include sales to bookstores, newsstands, other mass-market retail chains or the United Kingdom. Re-orders are included, so long as they either reached stores in a book’s initial calendar month of release or were strong enough to make the chart again in a subsequent month. Keep in mind that sales for some titles may include incentives to acquire variants and not every unit sold is necessarily even intended to be sold to a customer.
If additional copies of an issue did appear on the chart after a book’s initial calendar month of release, you can see the total number of copies sold in brackets behind those issues (e.g. “[36,599]”). Should more than one issue have shipped in a month which is relevant for one of the long-term comparisons, the average between them will be used.
Titles which are returnable have their numbers artificially adjusted down by Diamond. To make up for that this column increases the reported numbers for those titles by 10%. Which is likely also wrong, but it’s a different and likely less wrong kind of wrong, and experience has shown that this leads to sales figures which are more consistent.
Image is not a normal comics publisher, and the typical metrics for sales success may not apply. For many titles, collection sales tend to be a significant factor, so the numbers for those books should be taken with a grain of salt as well.
Please keep in mind that raw sales numbers do not tell us about how profitable a book is for a publisher or for the creators.
Above all, do not allow sales numbers to dictate your purchasing and enjoyment of a particular comic. If you enjoy reading a comic series then go right on buying and reading that comic, no matter what the sales figures say.
** Two asterisks after a given month in the average charts mean that one or more periodical release did not make the Top 300 chart in that month. In those cases, it’s assumed that said releases sold as many units as the No. 300 comic on the chart for that month for the purposes of the chart, although its actual sales are likely to be less than that.
Opinions expressed in this column are mine alone, and do not necessarily reflect those of my employer, Heidi MacDonald or anyone at The Comics Beat, The International Organization for Standardization, or my former neighbor’s dog Miles.
The author of this column does weekly snapshots of Amazon comic sales charts at http://yetanothercomicsblog.blogspot.com/ and tweets about comics and related subjects on Twitter at @davereadscomics (PM me there if you need to contact me).
As always, we welcome your comments and corrections below. Please try to keep things civilized.



Are those drops on The Walking Dead really standard attrition? I know there were some promo spikes, but that 25% drop and 68K total seem low for Image’s flagship book.
@Ray: Last month’s issue (#165) was the first in a long time that didn’t have a variant cover (or was promo priced). This month’s drop of 3.1% represents standard attrition. WD typically sells around 65-70K without variants etc.
Another way to look at it: if you assumed a 1% drop per issue, it would more-or-less match the decline from issue #156 (the last issue before variant-palooza) to issue #165. Given that with the variants from #157-164 retailers would have a hard time gauging the actual readership, seeing a drop this month of 3% is a perfectly normal correction.
Weird reading how sales dropped or increased due to having, or not having, variant cover. I remember a year or two ago Image criticized other publishers for using variant covers and here we are now. Life comes fast at you, or how that saying goes?
Image work towards shrinking those gaps between arcs — four months is too long.
Comments are closed.