by Brett Schenker
The Walking Dead is a cultural phenomenon. The property regularly breaks records, whether it’s television ratings, print runs and sell-outs in comics, or winning accolades and awards when it comes to video games. There have been very few series that tap into the cultural zeitgeist and become regular water cooler conversation. With it being Halloween, I felt it appropriate to look at who the fans of The Walking Dead are on Facebook. In this report I lumped in the television show, comic book, video games, books and characters.
What I learned is the breakdown between men and women is very similar to the general comic fan population. Walking Dead fans are 59.38% male and 40.63% females. General comic fans are 57.38% male and 40.98% female. So the two populations are very close when it comes to that.
But, when you look at the different media, they’re not all created equal. The television show skews a bit better even than the percents above, while the comic book series and video games are much mores (and also pretty close to each other).
Here’s how each media shapes up, and I’ve included the general “zombie” genre and “horror” genre as comparison:
We can see that the television break down between men and women is far more even than that of the comic books or video games, and out performs the “zombie” genre as a whole. All fall far behind the “horror” genre which is the MAJORITY female. But, there’s that large difference in media. The delivery of the entertainment is different between television and comics, but the stories and characters are similar. Here’s an example where advertising to one might help the other (ie advertising the comics to the television female fans).
Now, I will say that there’s a chance that since the majority are fans of the television show already, they might not be inclined to also be fans of the comic books, video games, or books, as well, so they might be under reported.

Looking further into into those total populations, there are 400,000 individuals who are fans of the comic book series but NOT the television show, while there are 0 as far as the video games and books. There are 60,000 individuals who are fans of the video games and NOT the comics and the same amount for the books. Finally, there are 160,000 people who are fans of the Walking Dead books, but NOT the video games. Those aren’t numbers to sneeze at.

The story and characters are very similar in the television show, comics, video games and books, HOW all of that is delivered is what’s different. Here’s a perfect example of cross promotion with numbers that would make a huge impact in the comic book industry if they were to be converted and a perfect example of the same property having different audiences depending on how it’s delivered.


Even Walking Dead doesn’t do this perfectly, but it would be amazing if someone like DC or Marvel got themselves into a scenario where every production (TV, Movie, comics, games) were all canon. It would pretty much be impossible, but interesting.
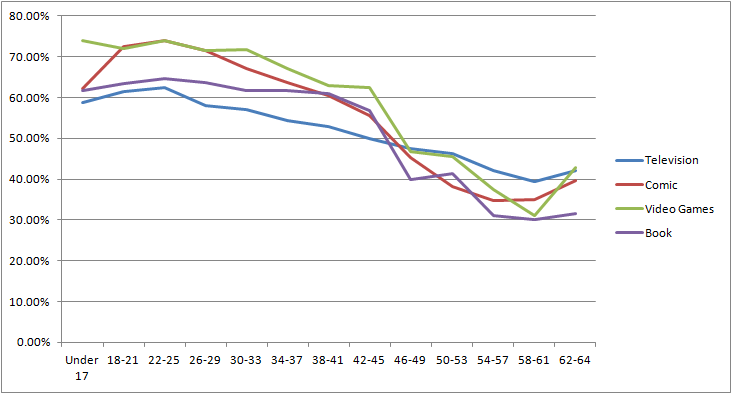
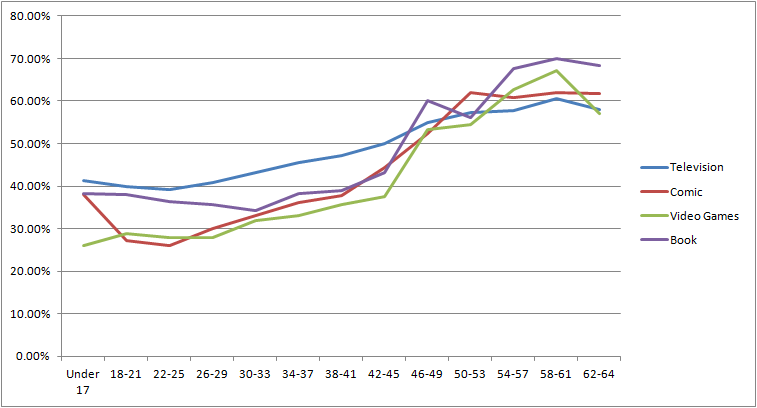
It might just be how my computer is rendering those two graphs, but I’m not sure I understand what information those “men by age” and “women by age” graphs intend to convey. Is it just that for each of the age bands in the horizontal axis, the point on the vertical axis shows what % of fans of that particular medium (TV, comic, video game, book) are male/female? If so, then I guess my comment is that I still suspect that data might be better presented in a single chart–perhaps as a bar chart–since, presumably, in any given price band, the percentage of males plus the percentage of females will always equal 100% (excluding, for the moment, any cases in the data where the person’s sex might not be evident.) It just seems that there ought to be a way to put both male and female data in a single chart rather than having two of them. But then again, maybe I’m missing some insight that this separate presentation is conveys.
My second comment is that I like the observation that there are apparently large populations who are fans of one medium (say, TV) who are not fans of another (say, books) who might make a good target for promotion of that other medium. Regardless of whether or not it’s actually possible to meaningfully convert fans of one medium into another, I appreciate the fact that that’s an actual, potentially actionable *insight* coming out of all this recreational number-crunching. Don’t get me wrong: recreational number-crunching is fun. But being able to draw insight from analysis is what takes things to the next level–whether we’re talking about Facebook demographics, or transmedia properties, or whatever else.
Wait, is this saying that interest in Walking Dead diminishes for men as their age goes up, but interest in WD for women rises?
Good time to be into older ladies, I guess.
Glenn: I agree that it’s tempting to read these graphs in that way, but I don’t think that’s what these data are saying — which is a reason why I think the line graph presentation is confusing.
That is, I think what these data say is not that women’s interest in Walking Dead rises as their age goes up, but rather that a greater percentage of older fans of Walking Dead are women compared to the percentage of younger Walking Dead fans who are women.
Which isn’t quite the same thing.
Comments are closed.