Diamond has just released their November chart toppers, and DC led again by by a considerably smaller margin than the ass-whoopin’ they gave Marvel in October. DC led by 2 points in units and a mere single digit in dollars. JUSTICE LEAGUE, BATMAN, and ACTION led the periodicals, while Marvel had three books in the top 10. BATMAN: NOEL, a clever and much needed “Batman does Christmas Carol,” led the GNs.
Sales overall are up for 2011, mostly thanks to a big boost from periodicals. GNs are down 10% year to year; however, they were up 30% in November, due to, perhaps, a more attractive product mix.
Wonder Woman and Aquaman enter the fray as Earth’s heroes join forces against the Parademons in Geoff Johns and Jim Lee’s Justice League #3 from DC Comics, November’s best-selling comic according to information provided by Diamond Comic Distributors, the world’s largest distributor of comics, graphic novels, and pop culture merchandise.
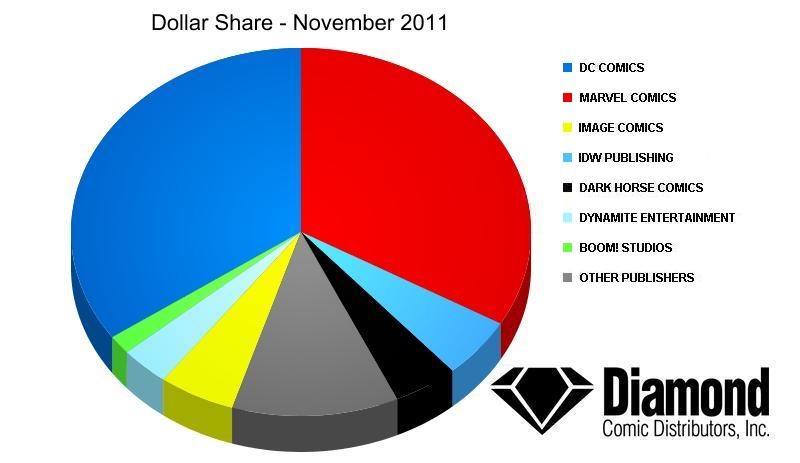
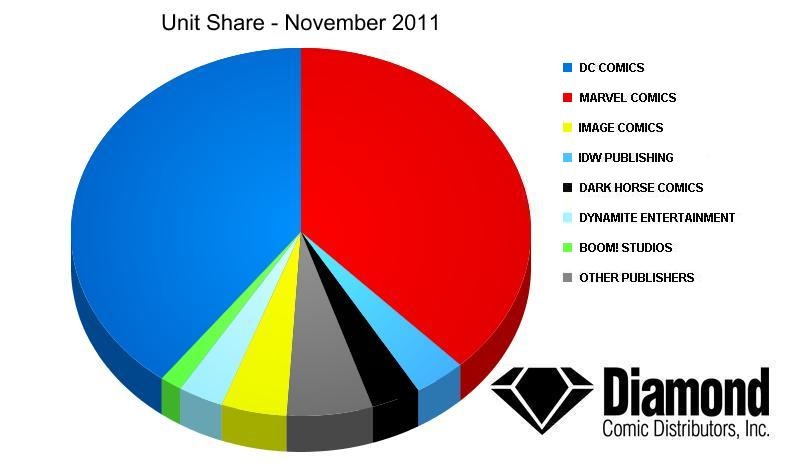
DC Entertainment led the market again in November, taking 34.69% of the month’s retail dollars and 39.66% of units sold. Marvel Comics showed a strong second place for the month, with 33.30% of retail dollars and 37.94% of units.
November’s sales as a whole improved over October’s by 4.33% with a strong increase of nearly 30% in the graphic novel segment. November’s sales in the print categories were up by double digits over the previous November’s, and the year-to-date sales are up nearly 2% over 2010.
A classic tale, Charles Dickens’ A Christmas Carol, is given a new twist in Lee Bermejo’s Batman: Noel hardcover graphic novel from DC Comics, which was November’s best-selling graphic novel.
Blizzard’s World of WarCraft is the most-played massively multiplayer online role-playing game in the world, and DC Direct released new dynamic figures based on the game in November with the World of WarCraft Premium Series 4 Figures, the month’s best-selling Toys product to specialty retailers.
Risk, one of the best-selling board games of all-time, was given a persistent gameplay makeover for Hasbro’s Risk Legacy, giving the publisher the best-selling Game to specialty retailers in November.
|
PUBLISHER
|
DOLLAR
SHARE
|
UNIT
SHARE
|
| DC COMICS |
34.69%
|
39.66%
|
| MARVEL COMICS |
33.30%
|
37.84%
|
| IMAGE COMICS |
5.36%
|
4.60%
|
| IDW PUBLISHING |
5.28%
|
3.65%
|
| DARK HORSE COMICS |
4.56%
|
3.47%
|
| DYNAMITE ENTERTAINMENT |
3.48%
|
3.20%
|
| BOOM! STUDIOS |
1.64%
|
1.55%
|
| VIZ MEDIA |
1.05%
|
0.39%
|
| AVATAR PRESS |
0.97%
|
0.55%
|
| RANDOM HOUSE |
0.96%
|
0.27%
|
| OTHER NON-TOP 10 |
8.70%
|
4.81%
|
|
DOLLARS
|
UNITS
|
|
|
NOVEMBER 2011 VS. OCTOBER 2011
|
||
| COMICS |
-4.57%
|
-7.00%
|
| GRAPHIC NOVELS |
29.67%
|
30.06%
|
| TOTAL COMICS/GN |
4.33%
|
-4.98%
|
|
NOVEMBER 2011 VS. NOVEMBER 2010
|
||
| COMICS |
23.10%
|
31.19%
|
| GRAPHIC NOVELS |
12.43%
|
-0.69%
|
| TOTAL COMICS/GN |
19.44%
|
28.12%
|
|
YEAR-TO-DATE 2011 VS. YEAR-TO-DATE 2010
|
||
| COMICS |
4.06%
|
7.01%
|
| GRAPHIC NOVELS |
-2.56%
|
-10.27%
|
| TOTAL COMICS/GN |
1.87%
|
5.47%
|
|
RANK
|
DESCRIPTION
|
PRICE
|
ITEM CODE
|
VENDOR
|
|
1
|
JUSTICE LEAGUE #3 |
$3.99
|
SEP110095 | DC |
|
2
|
BATMAN #3 |
$2.99
|
SEP110120 | DC |
|
3
|
ACTION COMICS #3 |
$3.99
|
SEP110114 | DC |
|
4
|
GREEN LANTERN #3 |
$2.99
|
SEP110137 | DC |
|
5
|
POINT ONE |
$5.99
|
SEP110496 | MAR |
|
6
|
AVENGING SPIDER-MAN #1 |
$3.99
|
SEP110536 | MAR |
|
7
|
UNCANNY X-MEN #1 |
$3.99
|
SEP110591 | MAR |
|
8
|
DETECTIVE COMICS #3 [*] |
$2.99
|
SEP110124 | DC |
|
9
|
FLASH #3 |
$2.99
|
SEP110102 | DC |
|
10
|
WOLVERINE AND X-MEN #2 |
$3.99
|
SEP110589 | MAR |
|
RANK
|
DESCRIPTION
|
PRICE
|
ITEM CODE
|
VENDOR
|
|
1
|
BATMAN: NOEL DELUXE EDITION HC |
$22.99
|
JUL110245 | DC |
|
2
|
HELLBOY: HOUSE OF THE LIVING DEAD HC |
$14.99
|
JUN118156 | DAR |
|
3
|
THE BOYS VOLUME 9: BIG RIDE TP |
$24.99
|
SEP110972 | DE |
|
4
|
THE WALKING DEAD VOLUME 1: DAYS GONE BYE |
$9.99
|
JUL068351 | IMA |
|
5
|
BATMAN AND ROBIN VOL. 2: BATMAN VS ROBIN TP |
$17.99
|
AUG110241 | DC |
|
6
|
SCALPED VOLUME 8: YOU GOTTA SIN TO GET SAVED TP (MR) |
$17.99
|
AUG110288 | DC |
|
7
|
GREEN LANTERN: WAR OF THE GREEN LANTERNS HC |
$29.99
|
JUL110252 | DC |
|
8
|
SAILOR MOON VOLUME 2 TP |
$10.99
|
SEP111140 | RAN |
|
9
|
B.P.R.D.: BEING HUMAN TP |
$17.99
|
AUG110037 | DAR |
|
10
|
JOE THE BARBARIAN DELUXE EDITION HC (MR) |
$29.99
|
MAY110294 | DC |
|
RANK
|
DESCRIPTION
|
ITEM CODE
|
VENDOR
|
|
1
|
WORLDS OF WARCRAFT PREMIUM SERIES 4 FIGURES | NOV100306 | DC |
|
2
|
GREEN LANTERN SERIES 4 FIGURES | APR110271 | DC |
|
3
|
BLACKEST NIGHT ACTION FIGURE BOX SET | APR110270 | DC |
|
4
|
MARVEL SELECT: INCREDIBLE HULK FIGURE | DEC074356 | DST |
|
5
|
SPIDER-MAN & FIREFIGHTER NYCC 2011 MINIMATE 2-PACK | MAY118250 | DST |
|
6
|
MARVEL SELECT: SPIDER-MAN FIGURE | JUL091428 | DST |
|
7
|
MARVEL SELECT: BLACK WIDOW FIGURE | AUG108034 | DST |
|
8
|
X-MEN DANGER ROOM SESSIONS: GAMBIT FINE ART STATUE | MAY111836 | KOT |
|
9
|
DC HEROES WAVE 19 ACTION FIGURES | MAR118284 | MAT |
|
10
|
SPIDER-WOMAN STATUE | MAR111818 | BOW |
|
RANK
|
DESCRIPTION
|
ITEM CODE
|
VENDOR
|
|
1
|
RISK LEGACY | JUN118204 | KEN |
|
2
|
MARVEL HEROCLIX: INCREDIBLE HULK EXPANSION | OCT112062 | NEC |
|
3
|
THE WALKING DEAD TV BOARD GAME | JUL112137 | CRY |
|
4
|
DOCTOR WHO FAMILY BOARD GAME | OCT101792 | DIA |
|
5
|
DOCTOR WHO ACTION BOARD GAME | OCT101791 | DIA |
|
6
|
MAGIC THE GATHERING TCG: INNISTRAD BOOSTER PACKS | AUG112115 | WIZ |
|
7
|
DC HEROCLIX: SUPERMAN: BATTLE FOR SMALLVILLE FAST FORCES | JUL118255 | NEC |
|
8
|
TOP GEAR BOARD GAME | AUG118197 | DIA |
|
9
|
MUNCHKIN: AXE COP | JUL112169 | PSI |
|
10
|
YU-GI-OH! TCG: PHOTON SHOCKWAVE BOOSTER PACKS | JUL118061 | KON |
How does Diamond calculate the charts? It all starts at the comic book shop.
Data for Diamond’s sales charts — which include the monthly market shares and all top product charts — are compiled by Diamond Comic Distributors from a universe of over 3,500 comic book specialty shops located in North America and around the world. The account base includes brick-and-mortar comic book specialty shops, Internet merchants, and other specialty stores.
Unit and dollars sales are calculated based upon orders invoiced and shipped to Diamond accounts during any given month, which comprises initial pre-orders, advance reorders, and reorders, minus any copies that are received back from a title marked as returnable.
Please note that comics marked with an asterisk have had their reported quantities reduced due to retailer returnability, and thus may rank lower on the charts than their actual sales would reflect.


Quick question: in the paragraph about how the numbers are calculated, it says the numbers “are compiled by Diamond Comic Distributors from a universe of over 3,500 comic book specialty shops located in North America and around the world”. In the past, various articles have specifically said the numbers were North America only. Is this a change in reporting (hence part of the reason numbers are up)?
The numbers in the charts should only account for the sales in North America. I’m not sure why the last paragraph changed, but I’ve been told of no change to the past procedure. If they had been added at some point, we probably would have noticed, because sales of every title across the board would suddenly have gone up by 10%. We’ve seen aggregate increases of that size, but nothing like that on the per-title level.
I read from the tables that, with November’s increase, 2011 is almost certainly going to be an up year for the Direct Market, and the ninth growth year out of the past 11. My figuring is here:
http://blog.comichron.com/2011/12/november-2011-puts-industry-back-in.html
I think in some cases — though they are exceptions — European stores can get their U.S. product directly from Diamond U.S., rather than from Diamond U.K. Maybe that’s the reason for the phrasing here.
Nice even split between DC, Marvel, and everyone else. Is this the smallest share of DC + Marvel? (I suspect the first year of Image might be an example, as well as Marvel’s bankrupt period.)
But, John, it’s a “fact” that the DM is down.
I boggle!
-B
I don’t try as hard as I used to to combat that, Brian — pretty much, I can just put the numbers out. The problem is the old adage about the blind men and the elephant — everyone sees it from their perspective, and not all perspectives have access to the same information.
Creators, for example, are naturally going to be focused on the performances of their individual titles — a small sample of the overall population of books on sale. So when you have a situation where many titles’ circulations decline, it doesn’t much matter when the combined sales of all titles go up. A retailer or a large publisher can take advantage of economies of scale by adding titles; a creator, not so much. Likewise the reader, who can only afford to follow a small sample of titles. The sense of the market is simply different for these observers, because the information most relevant to them doesn’t reflect the whole picture.
So we get seemingly conflicting observations that are still correct — it just depends on how you’re looking at it.
Torsten — actually the DC/Marvel share of 68% this month is right in the middle. It got down to 48.03% in February 1998, which, yes, was during the bankruptcy.
Okay Brian and JJM, I get confused by things like the following that
was just posted on ICV@:
So have sales been rising since 2007? Or falling? And if they were falling (the manga implosion clearly a huge part of that) is it not just because DC pulled the trigger on the Nuclear option and fixed everything?
I don’t want to be unduly gloomy or unduly chipper. But I think there are mixed messages here.
I’m not sure there is such a thing as “the direct market,” for that matter.
There’s Marvel, and there’s DC. There are Image, Dark Horse, IDW and a few others. And then there are publishers like Fantagraphics or Drawn & Quarterly. Plus, all the smaller publishers and self-publishers that don’t register much on these charts. And the merchandise and magazines. And even within Marvel and DC, you’ve got things like Vertigo or Icon, or the kids lines, or the book programs, which are entirely different animals from the superhero periodicals. And then you’ve got special things like discounts or returnability or relaunches or variant-cover or gimmick promotions or a WATCHMEN or WALKING DEAD or SCOTT PILGRIM that can and do distort the numbers.
Basically, there are so many factors in motion at any given time that it’s hard to divine what those total figures released by Diamond mean to anyone in particular — let alone the creators, who, in most cases, are still last in line when whatever profits there are start trickling down.
I agree, Marc-Oliver: this is but one barometer, and it means different things depending on your point of view.
Heidi, I have the market peaking in 2008 rather than 2007, but regardless, the upshot is this: Total Direct Market sales have been fluctuating in a pretty narrow range from 2007 to present — around $428 million, plus or minus $10 million. We reached the lower end of that range last year; this year, we’re going to probably be in the higher end of that range. So we’re oscillating plus or minus 2.3%. It’s noticeable, sure — but in historic terms, it’s not in the ballpark with the market booms and swoons we know by name.
Inflation, of course, does figure in — and where we felt the biggest hit was in new comics unit sales, which controls for cover price. The Top 300 sold 85 million copies in 2007; 69 million, last year. We’re going to wind up in the mid-70s this year. That’s a plus — but we probably notice fluctuations more in this category because the range is wider, going plus or minus 10% from the five year average. And unit sales can be physically observed — so we notice when things change more.
I don’t want to try to predict what would have happened in the absence of a DC reboot — through July, we were on pace for comics sales in the mid-60 millions, but the later months usually tend to do better, so it’s hard to know. The weak trade market was probably more poised to be the story of the year; certainly glad it isn’t.
No, I don’t think we should be Panglossian — nor practice “wishful figuring.” Having gotten burned calling bottoms to the market in the 1990s at the trade magazine, I hope I approach the upticks a little more cautiously. But I try to treat the downturns the same way — and I definitely feel that, in the long view, the story of the last decade-plus is that the number of comics the direct market sold held relatively steady while the number of graphic novels exploded. Hence, an increase in revenue and reach. We’ll see what digital can add to that.
I’m in the middle of a major survey of sales in the early 1960s, so I tend to take the extremely long view on ups and downs, as these things go. The comparisons are interesting. On the one hand, there were FAR more eyeballs being reached then — but there may actually be more money in the comics business today, even adjusted for inflation, than there was 50 years ago:
http://blog.comichron.com/2011/03/difference-50-years-makes.html
So there may be more livings being made now — and there are certainly more new comics stories being written and drawn. And I think that’s the missing statistic I’d most love to see: an actual total of full-time workers in the business. I would have to think that figure topped out in 1993, with the retail explosion, but I have no idea how we’d come up with it now, much less over time.
Congrats to DC for their third straight month as number 1. Not looking to good that they will have a fourth.
Although shouldn’t it be noted that Marvels top title is only there because they double shipped it and gave retailers half for free. haha… speaking of which – my local store didn’t give me a free copy, the tight arses.
And how many titles did each company produce for the month? 75 for dc, 95 for Marvel?
Even if DC loses #1 rank next month I think that DC and Marvel will be around even for a while. Remember, only a few months ago, Marvel was consistently 10% above DC or more month. The new 52 is a success, o matter what the haters call it. Sure it will be a different picture come Spring, but hats ff to DC for taking this risk and sparking the market with something new. Alot of people bitched about the new 52 (including myself) but there have been some good stuff out there. Heck thy even took some risk launching a bunch of titles that would not have normally been so. Just look at iVampire, Animal man, Grifter, etc….alot of these were dead franchises.
Now Marve is kind of doing their relaunch but slowly and discreetly. Look at the x-men and surely the Avengers once Bendis leaves. Their problem is the continuity and there successive relaunches. (look at DD, FF, Cap, Avengers, Wolverine etc…). I am not too hyped about their attempted so far.
I agree with Marc, there are tons of factors affecting everything in this report. It’s not even Apples to Apples on the Big Two if Marvel publishes 20 more titles than DC & charges $1 more on (almost) every title, but ya gotta start somewhere for your snapshot of what’s happening.
@JJM—please don’t be logical on this site, esp. on this issue—it just confuses the Hibbs’ of the world…
I guess this goes to show all the calls from 1-4 months ago of “What is Marvel going to do? Another big summer crossover isn’t nearly enough! They need to blow up the Marvel U” were absolutely, and totally premature.
3 months from now, it seems like everything will be status quo. And Marvel will have the same “cohesive” universe, while DC writers are dealing with there “there is no history, well, there is some history, if we say so” boondoggle.