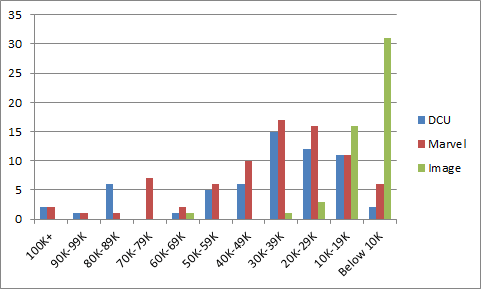
And finally, the comparison chart of DC, Marvel and Image. So we can see where the biggest sales sit on the Direct Market Landscape.
Standard disclaimers: The numbers are based on the Diamond sales charts as estimated by the very reliable John Jackson Miller. These charts are pretty accurate for U.S. Direct Market sales with the following caveats: 1) you can add ~10% for UK sales, which are not reflected in these charts; 2) everyone’s best guess is you can add ~10% for digital sale – while some titles do sell significantly better in digital (*cough* Ms. Marvel *cough*), that’s the average rule of thumb; 3) it’s not going to include reorders from subsequent months, although reorders will show up in subsequent months if they’re high enough. So if you’re a monster seller in Southampton and it took the US audience 3 weeks to reorder, it’s probably not going to be reflected here.
What’s a sales band? It’s another way to have a higher level view of the market. The general idea is to divide the market into bands of 10K copies sold and see how many issues are in each band. How many issues sold between 90-99K copies, 80-89K copies, etc. etc. In very broad terms, the market is healthier when there are several titles selling in the 70K-100K+ range because titles that move a lot of copies give the retailers some margin of error on their ordering. When you see titles selling in the 20-29K band and especially below, there’s a pretty good chance a lot of retailers aren’t ordering those titles for the shelf (pull box/pre-order only) or minimal shelf copies at best.
When we look at the full chart for the three main single issue publishers, we see a fairly full chart. Some issues that were ordered in at over 100K. Issues in every sales band. The highest concentration in the 30K-39K band – you’d rather see that concentration in a higher band, but it’s better than in the 10K-19K band.
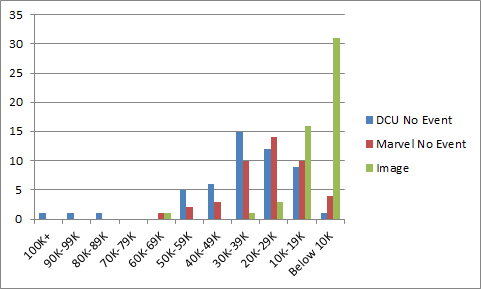
But remember, there’s a lot of events going on and in particular there’s some question as to how well Marvel’s Legacy initiative and lenticular covers are selling through. So what happens if we take away those event issues and look at the core titles?
Yikes! That’s a bit of a change, isn’t it? You remember our refrain from the last few months of “throw out Batman for DC and throw out Star Wars for Marvel and the number look awfully similar for both publishers?” That’s not the case this month. Now… perhaps some of this is a result of Marvel issues that are part of the lenticular promotion, instead of being “normal” issues. But on the whole, the core is drifting to the right of the chart. The big hole is still there at 70K-79K and there isn’t any kind of volume until the 50K-59K sales band, even if it’s minor volume.
DC’s doing a good job of bringing some sales heat with Metal that’s filling up some of the left side of the chart. With Legacy, it’s not clear that Marvel’s bringing consumer sell-through or what the sales levels are necessarily going to be moving forward, so we’re just going to have to see. The trouble is, that’s as close to a relaunch as Marvel’s getting for a few months and it’s not abundantly clear there’s going to be a sales bump for anything past those lenticulars and the jacked up minimum orders that came with them. With DC, they’ll be having a prolonged rollout of “New Age of Heroes” titles coming out shortly, with the hopes that some of those fill in closer to the left side of the chart than the right. Frankly, the could use a wave of new titles now, not necessarily a trickle of them, but I suppose that way they can spread the #1s out. That can be a form of management for the monthly sales average.
Nobody wants to see the standard attrition drift anything much further to the right, but we’ll have to see where the market and the reader’s purchases take things.
DC Chart
Marvel Chart
Image and Indies Chart
Want to learn more about how comics publishing and digital comics work? Try Todd’s book, Economics of Digital Comics


