by John Jackson Miller
[Reprinted with permission from Comichron.com]
November was no October when it came to comics sales, but it didn’t need to be to improve upon last year’s performance. Based on Comichron’s analysis of data released by Diamond Comic Distributors, comics shops in North America ordered nearly $46 million in printed product during the month, 8% more than last November — and the gains were made by both comic books and graphic novels. Click to see the sales estimates for comics ordered in November 2014.
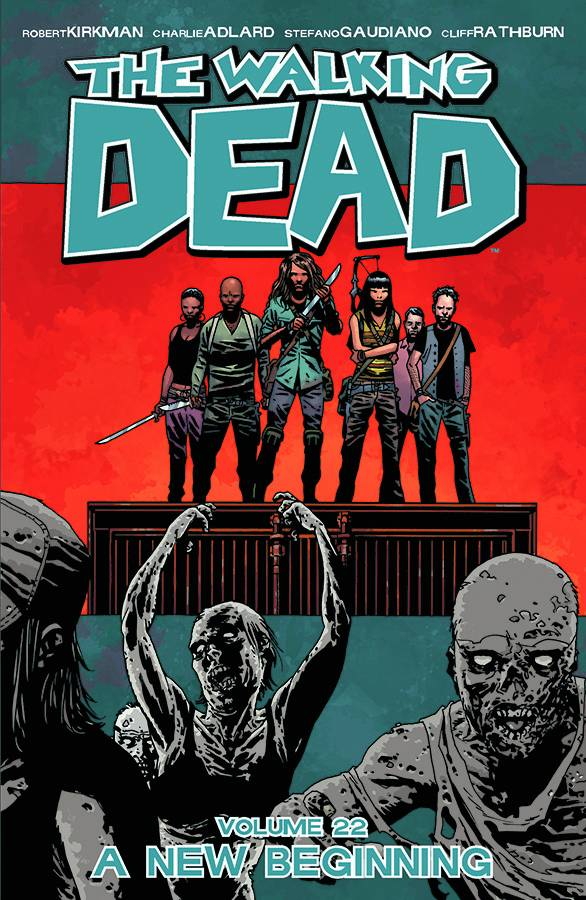
The graphic novel category improved more during the month, up 14.4% thanks in part to the category leader, Walking Dead Vol. 22: A New Beginning, which debuted with first-month orders of nearly 23,000 copies. Sales of the Top 300 graphic novels for the whole year to date are still lagging 1% behind the same grouping last year — but since Diamond reports that all graphic novels sold are up 6%, that means the growth has all been in the “long tail,” the books outside the Top 300. (And there are a lot of them!)
Amazing Spider-Man #9, one of two issues of the title released in the month, led the comics category with sales of more than 135,000 copies. The Top 300 comics for the month outsold the same grouping for last November by nearly 100,000 copies, so that extra Spidey issue could be considered the margin of difference.
Walking Dead returned to its previous sales level, following last month’s Loot Crate-enhanced sales; this would seem to strengthen the case that the October Loot Crate purchase ofWalking Dead #132 was likely around 256,000 copies. That’s more than Loot Crate appears to have bought of Guardians of the Galaxy #1 earlier in the summer, so it’s likely there’s quite a bit of variance in its orders from set to set. Given how the “crates” can be purchased a la carte as well as by subscription, that would make sense.
The aggregate changes:
November 2014: 6.73 million copies
Versus 1 year ago this month: +2%
Versus 5 years ago this month: +9%
Versus 10 years ago this month: +5%
Versus 15 years ago this month: unchanged
YEAR TO DATE: 75.9 million copies, -3% vs. 2013, +11% vs. 2009, +12% vs. 2004, +6% vs. 1999
ALL COMICS UNIT SALES
November 2014 versus one year ago this month: +5.84%
YEAR TO DATE: -0.11%
November 2014: $25.12 million
Versus 1 year ago this month: +2%
Versus 5 years ago this month: +16%
Versus 10 years ago this month: +35%
Versus 15 years ago this month: +44%
YEAR TO DATE: $287.5 million, +1% vs. 2013, +22% vs. 2009, +48% vs. 2004, +55% vs. 1999
ALL COMICS DOLLAR SALES
November 2014 versus one year ago this month: +5.47%
YEAR TO DATE: +3.80%
November 2014: $8.8 million
Versus 1 year ago this month: +19
Versus 5 years ago this month: -9%
Versus 10 years ago this month, just the Top 100 vs. the Top 100: +45%
Versus 15 years ago this month, just the Top 25 vs. the Top 25: +39%
YEAR TO DATE: $82.31 million, -1% vs. 2013
ALL TRADE PAPERBACK SALES
November 2014 versus one year ago this month: +14.44%
YEAR TO DATE: +6.16%
November 2014: $33.92 million
Versus 1 year ago this month: +6%
Versus 5 years ago this month: +11%
Versus 10 years ago this month, counting just the Top 100 TPBs: +24%
Versus 15 years ago this month, counting just the Top 25 TPBs: +59%
YEAR TO DATE: $369.8 million, +1% vs. 2013
ALL COMICS AND TRADE PAPERBACK SALES
November 2014 versus one year ago this month: +8.36%
YEAR TO DATE: +4.52%
November 2014: approximately $45.77 million (subject to revision)
Versus 1 year ago this month: +8%
Versus 5 years ago this month: +31%
Versus 10 years ago this month: +59%
YEAR TO DATE: $496.96 million, +5% vs. 2013
RELEASES
New comic books released: 499
New graphic novels released: 301
New magazines released: 32
All new releases: 832
The average comic book in the Top 300 cost $3.71; the average comic book retailers ordered cost $3.73. The median and most common price for comics offered was $3.99. Click to see comics prices across time.
As mentioned Friday, Comichron projects the comic shop market will complete the year with orders totaling around $542 million, up a little less than 5% over 2013. You can contribute to that total by visiting your local comic shop; find one here.
John Jackson Miller has tracked the comics industry for more than 20 years, including a decade editing the industry’s retail trade magazine; he is the author of several guides to comics, as well as more than a hundred comic books for various franchises. He is the author of several novels including Star Wars: Kenobi, Star Wars: A New Dawn, and the upcoming Star Trek: The Next Generation – Takedown. Visit his fiction site at http://www.farawaypress.com. And be sure to follow Comichron on Twitter andFacebook.


“November was no October when it came to comics sales”
Well, October had 5 Wednesdays. November had 4. The drop for November was pretty much exactly standard for 5-to-4 Wednesday month drops.
Good to see a bunch of small increases on lots of books across the industry.
Great info, as usual. One little tidbit: I think this summer’s Loot Crate was for Rocket Raccoon #1 (The article says Guardians of the galaxy #1)
You’re right, of course! I was writing the “Guardians of the Galaxy spinoff…” and forgot the rest. Original version is corrected.
The difference between October and November — November was 18.4% smaller — is larger than the historic average difference between four- and five-week months, which tends to be in the 10-12% range; the addition of an extra week doesn’t equate to a 25% increase in the number of publisher releases. But this particular October’s release slates were incredibly heavy, so it was closer to that than we usually see.
Regarding the long tail of graphic novels…
How does the #300 title of this year compare to previous years? Is it rising like with the comics list?
2012 300 0.19 JAMES PATTERSON ZOO GN $25.99 HAC 305
2013: 300 0.31 D GRAY MAN 3IN1 TP VOL 02 $14.99 VIZ 386
2014: 300 0.39 ALICE I/T COUNTRY OF CLOVER KNIGHTS KNOWLEDGE GN VOL 03 (MR) $13.99 STM
445
Yup… Any significance to the index number?
Curiously, the #1 title for each November is The Walking Dead, but the initial sales keep slipping.
Is that because retailers are getting savvy and ordering fewer up front? (Although, wouldn’t that affect their discounts?) The compendiums continue to sell consistently each week.
Is total units shipped for the Top 300 higher than previous years?
As I prepare the annual analysis of the New York Times bestseller lists, I notice that in TPs, about half of each weekly list is dominated by the same titles: Saga, Walking Dead, anything by Raina Telgemeier.
709 comics/graphic novels were sold in Nov 2013.
800 comics/graphic novels were sold in Nov 2014.
I don’t keep regular tabs on Top 300 graphic novel units across time because it’s meaningless: $9 and $150 items are in the same chart — and we also get a huge amount of noise from deep-discounted graphic novels, which tend to hit the charts in waves. But Diamond reports that overall graphic novels are up 6.52% in units year-to-date, and up 21% versus last November. I think the prominence of SAGA and WICKED & DIVINE this month — both top five titles, both $10 — has something to do with that.
The Top 300 Graphic Novel unit count in November 2014 was about 404,000; in November 2013 it was about 363,000; in November 2012 it was 350,000. I think in general there’s a larger number of offerings, meaning that the typical book on the list is more likely to be a first-month seller and have higher numbers; I think that competition — plus the natural impulse to order fewer of a newer volume of a long series right away — may contribute to any lower numbers seen on the Walking Dead up-fronts.
“Versus 15 years ago this month: unchanged”
Wow, I hope digital and first time book sales truly are making up the difference because 15 years ago was a nightmare if anyone remembers that era. That was when people were really getting ready to throw in the towel in this business. If you were in the business then you were thinking very seriously how to get out. A lot of us did right around that time.
You’re absolutely right about the atmosphere then, but there are a couple of factors that make the comparison less concerning.
Then, as now, the #1 factor making up comic book unit sales is the number of stores. The number of comic book stores was still higher in 1999 than it is now; nowhere near what it had been earlier in the 1990s, but the bleed-off was still ongoing (people throwing in the towel, as you say). So in a sense, having parity in the Top 300 with 1999 means that individual stores are each ordering more copies on average now than they did then.
Second, the Top 300 in 1999 was about it when it came to comics sales, whereas you can reliably count on another half-million to a million copies a month coming from outside the Top 300 these days. The 300th place comic book in November 2014 sold 5,214 copies; in November 1999 the level was 2,323 copies. Today’s 300th place book would have been in 236th place back then; 435 different comics now sell more than 2,323 copies. So the Top 300 is differently shaped, and encapsulates less of the market today than it did then.
And, finally, yes, graphic novel sales have added a few hundred million dollars a year that simply didn’t exist back then — and digital probably adds another hundred million. The market is in considerably better shape on all counts — and when I see the unit numbers for comics starting to exceed those of the late 1990s, I generally look on that as pretty good, considering the difference in the number of stores.
As an postscript to the 1999:2014 comparison:
There’s a huge market for graphic novels outside the Direct Market now.
Even in 1999, when we saw the invasion of Pokemon, and comics publishers finally entering the book trade market, the market was still similar to that of 1984… a shelf at the end of Science Fiction and maybe a few titles in Humor, a few titles shelved under 741.5 in libraries.
Now, there are bestselling graphic novels which are rarely found in comics shops. Roz Chast, Raina Telgemeier, even Neil Gaiman. (Yes, he had THREE titles on the hardcover bestseller list simultaneously. this year.)
Librarians (members of the Geek diaspora) love comics, and like cookbooks and romance novels, use them to bolster circulation figures, and to get reluctant readers hooked on literacy. The same goes for educators. (Heck, even World Book Encyclopedias is publishing comics!)
As for digital copies? I’m not seeing much interest in ebook graphic novels. Most collections are based on comics, and need a guided view to work. The original offerings… those are usually designed to work from page to page, generally with six or fewer panels per page. And librarians… they’re hampered by the publishers themselves.
Comments are closed.